
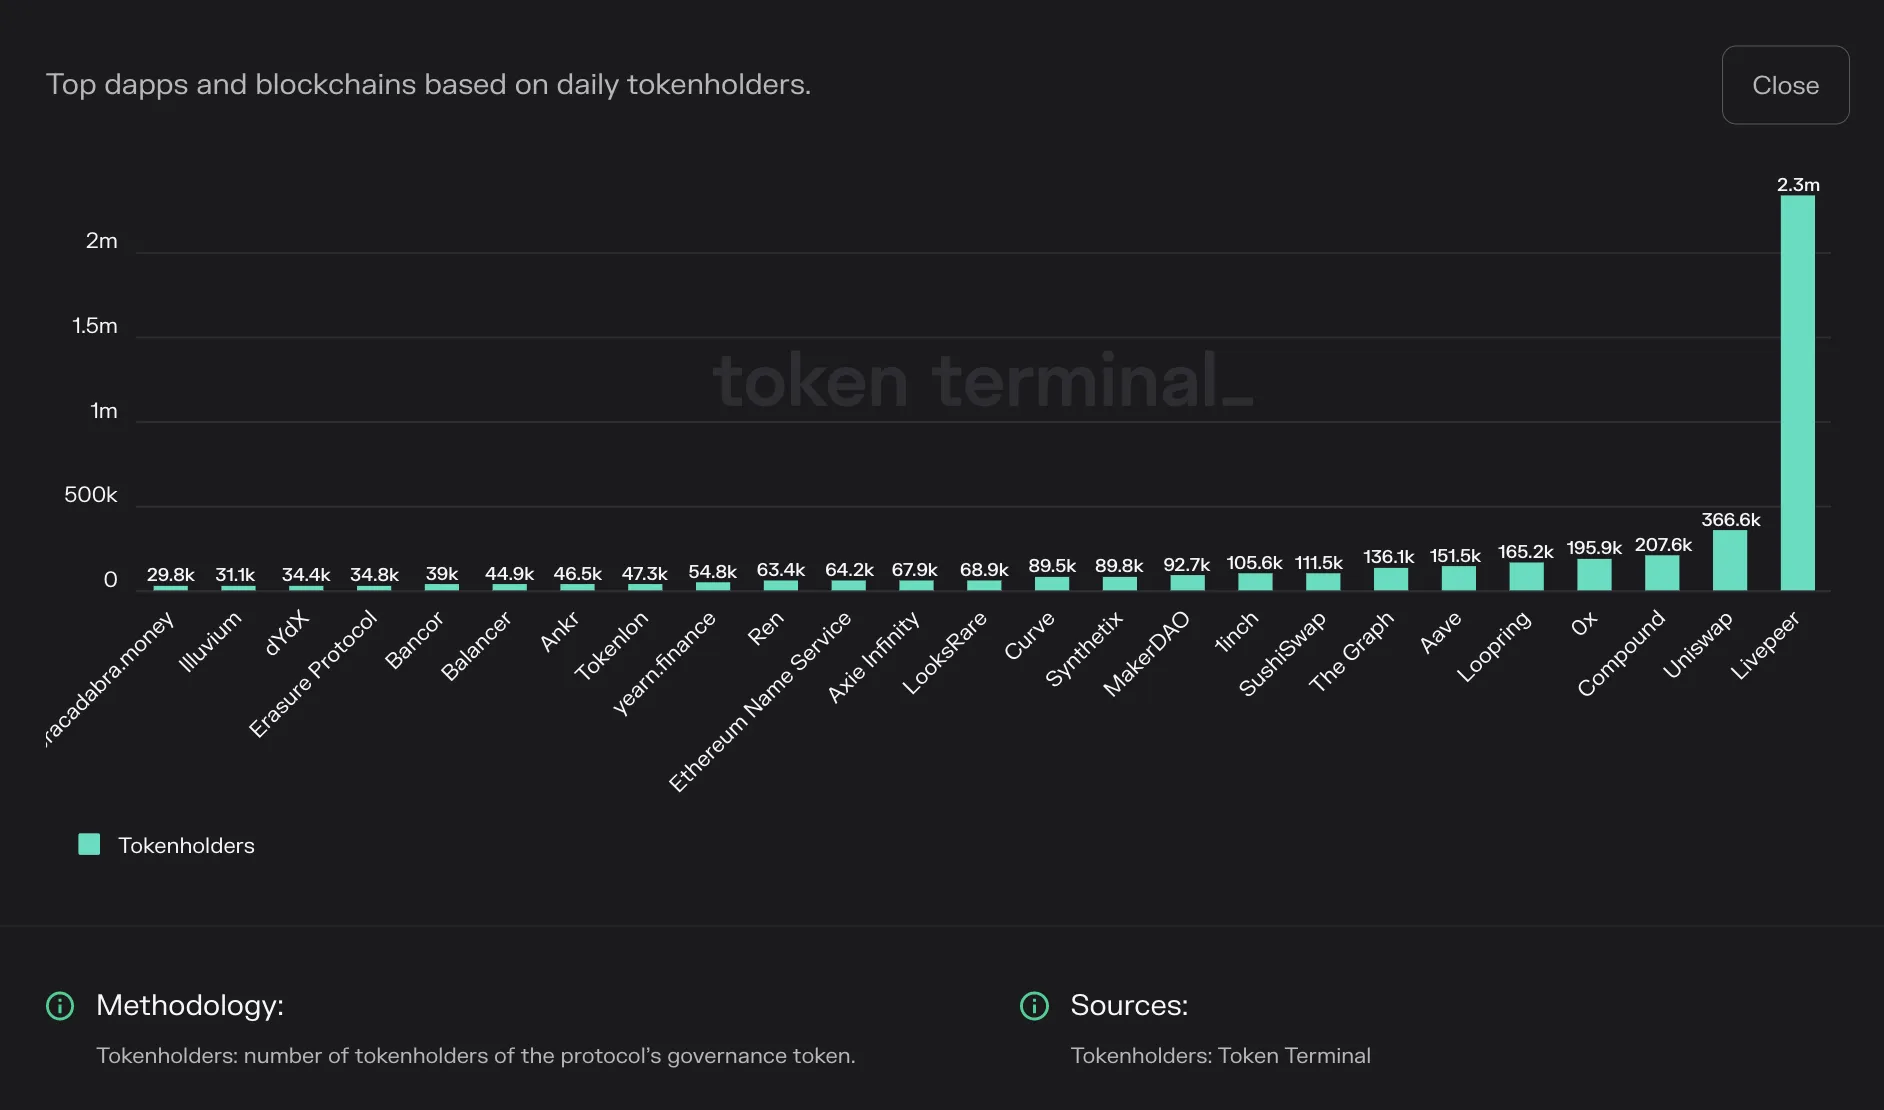
In this article, we provide an overview of what the tokenholder base looks like for the largest protocols.
These are the current top 25 dapps and blockchains based on the total number of tokenholders.
Tokenholders dashboard: https://tokenterminal.com/explorer/metrics/tokenholders
1. Livepeer (LPT)
Key stats:
- Circulating market cap: $163.7M
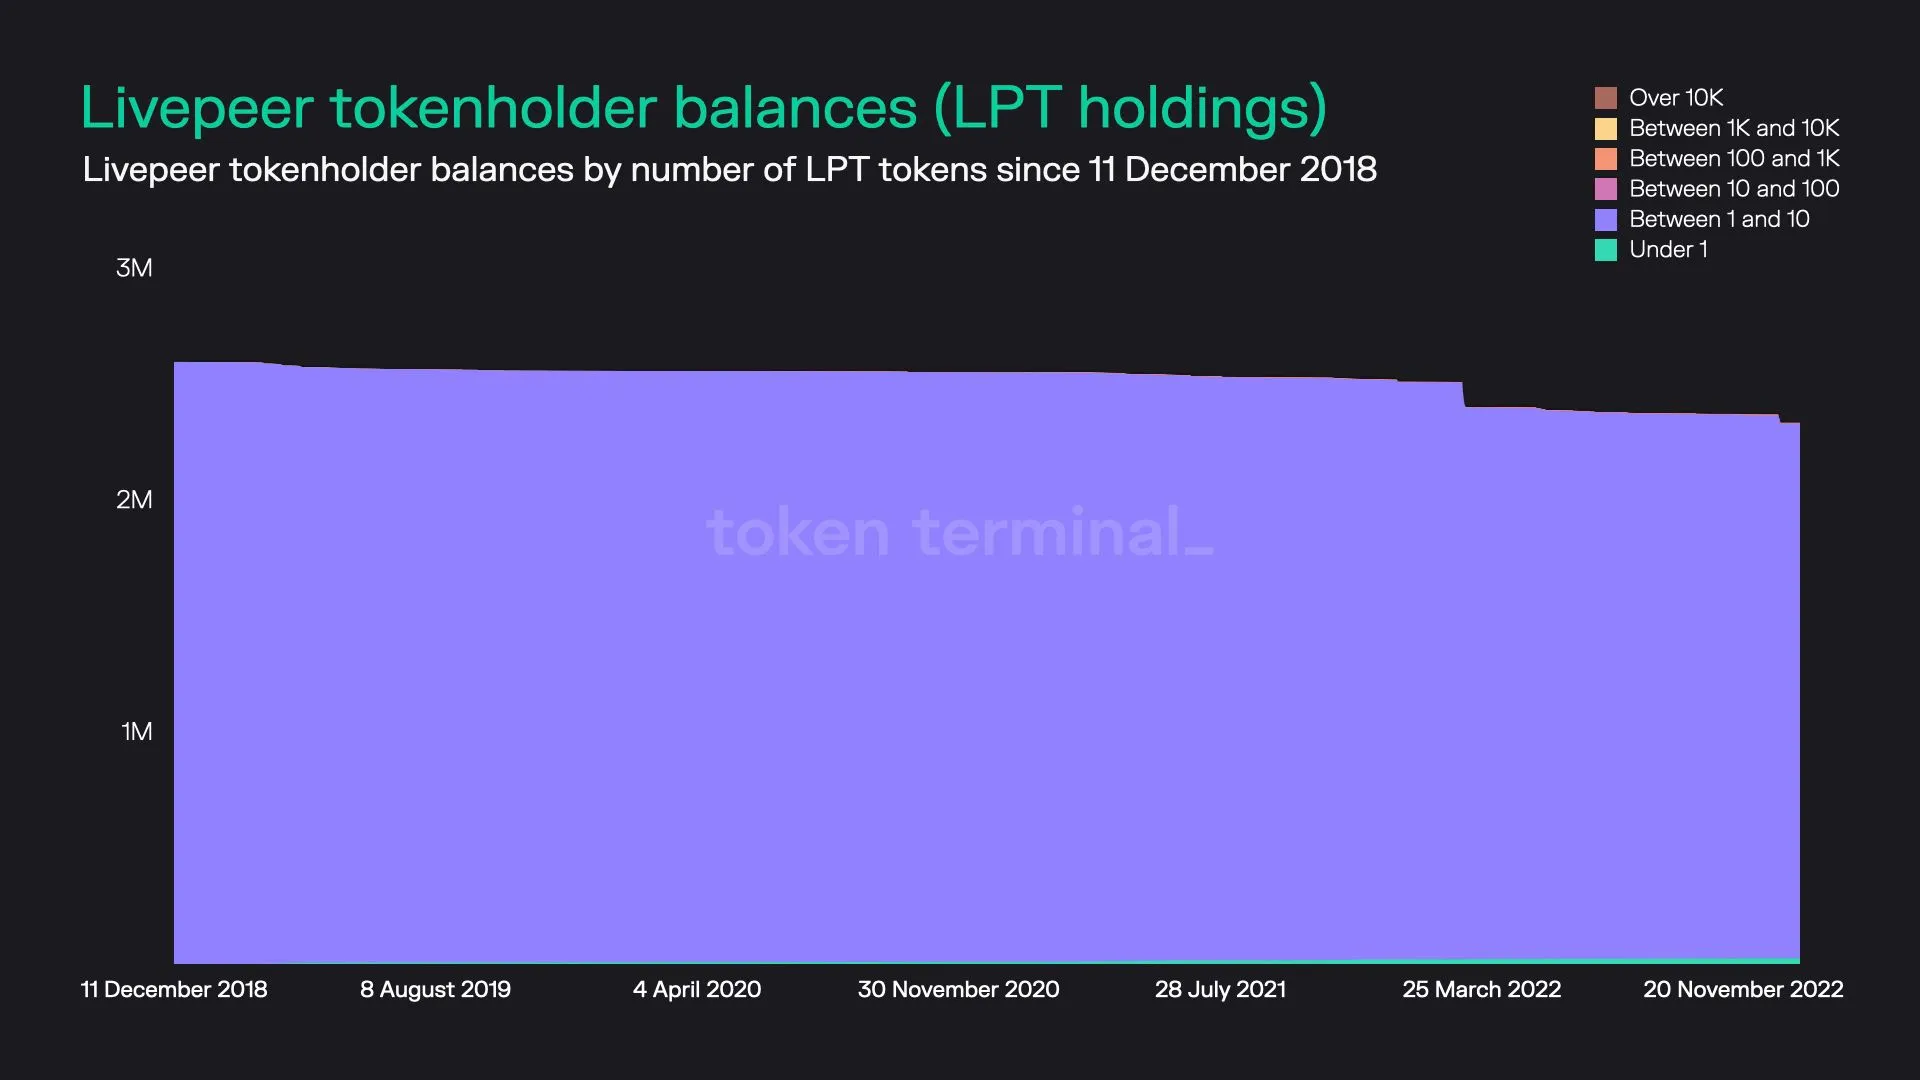
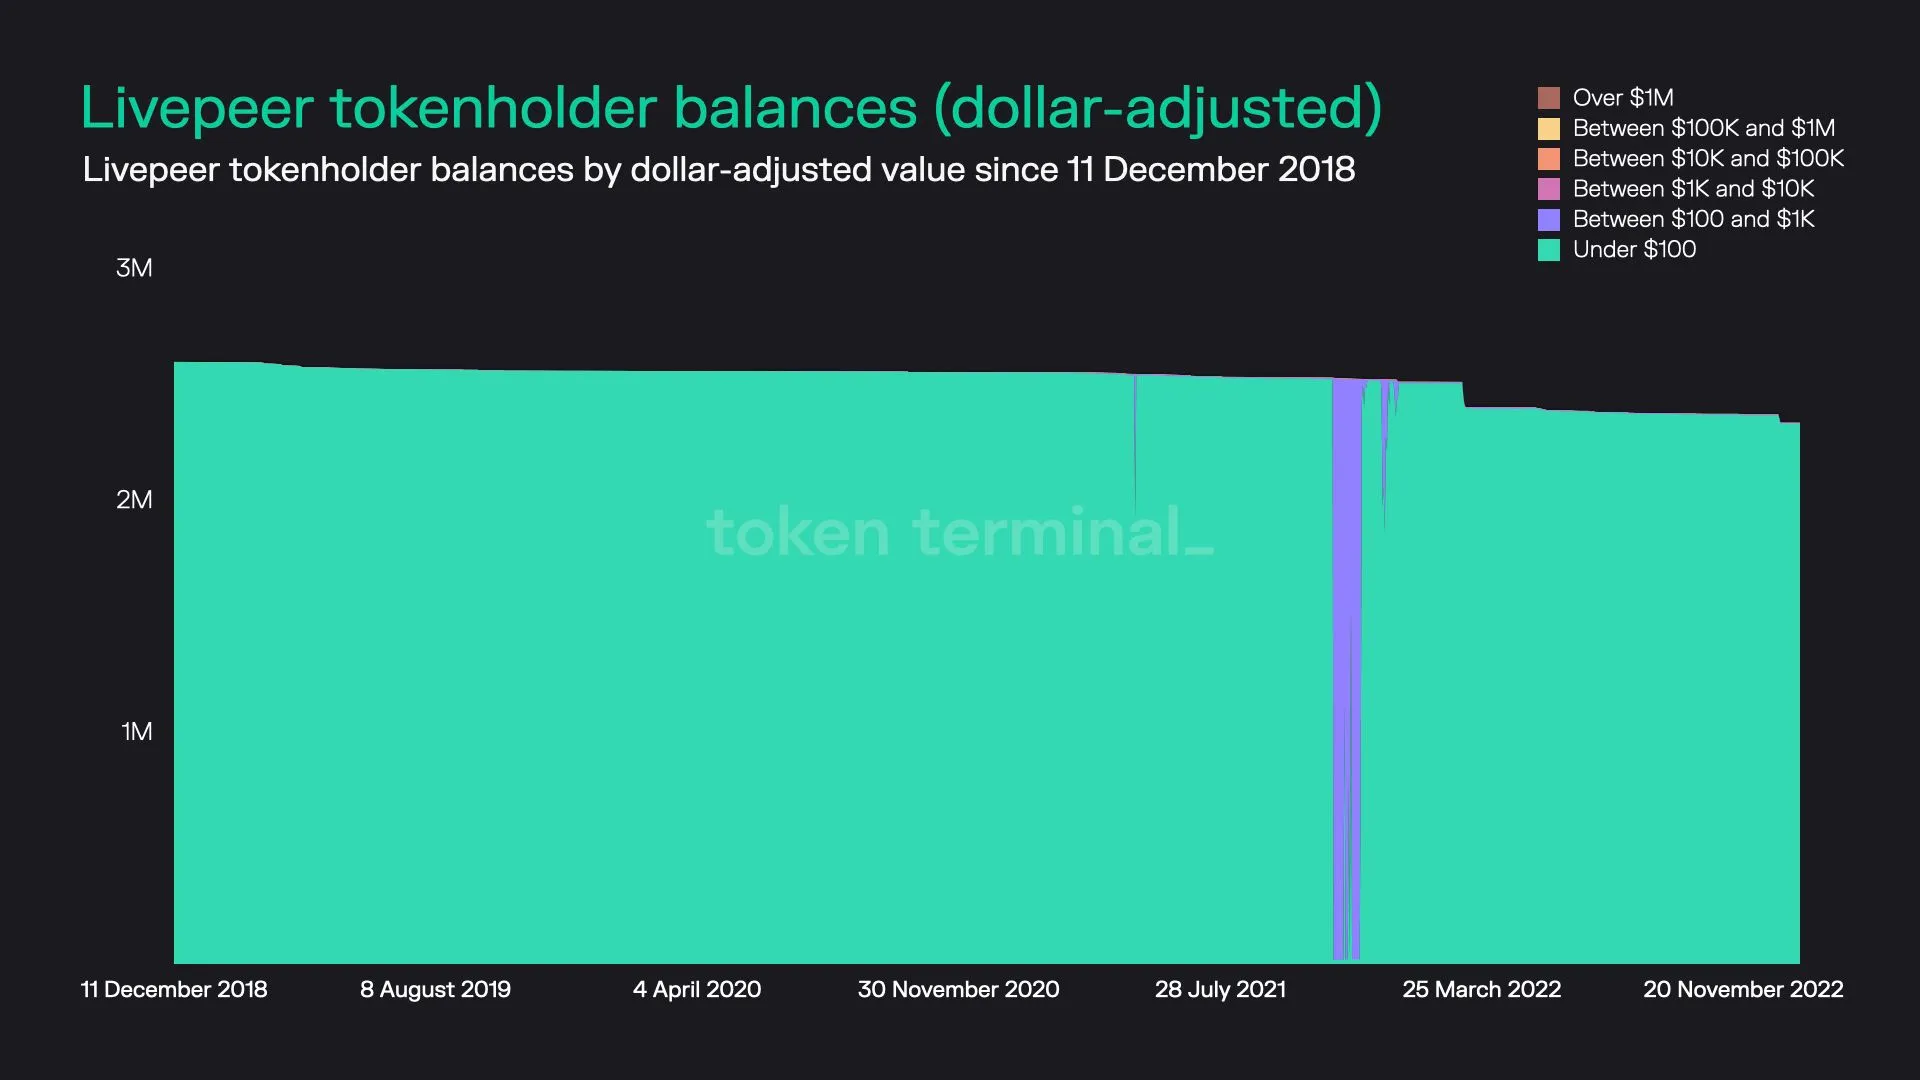
- Total number of LPT holders: 2.3M
- Average dollar-value of LPT per tokenholder: $71.2
- Percentage of LPT tokens held by the top 100 holders: 77.5%
Livepeer dashboard: https://tokenterminal.com/explorer/projects/livepeer
2. Uniswap (UNI)
Key stats:
- Circulating market cap: $5.0B
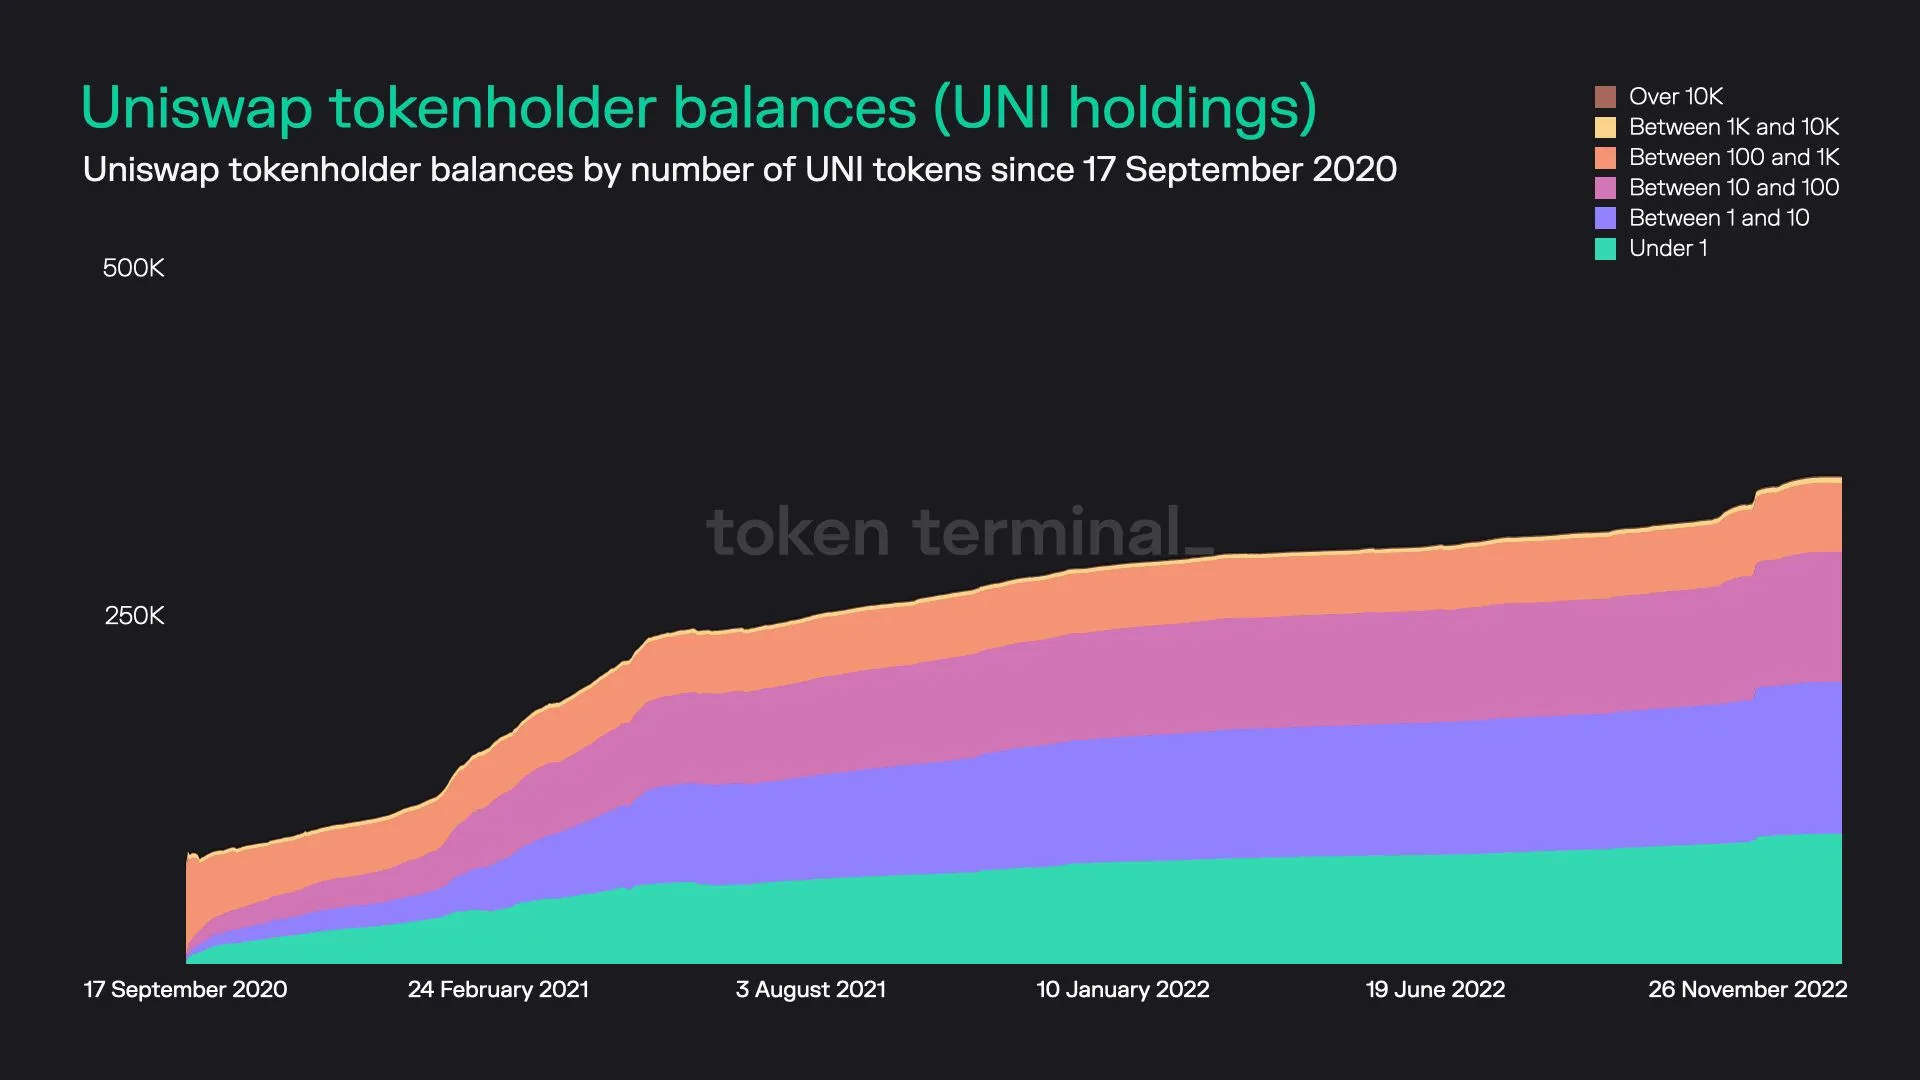
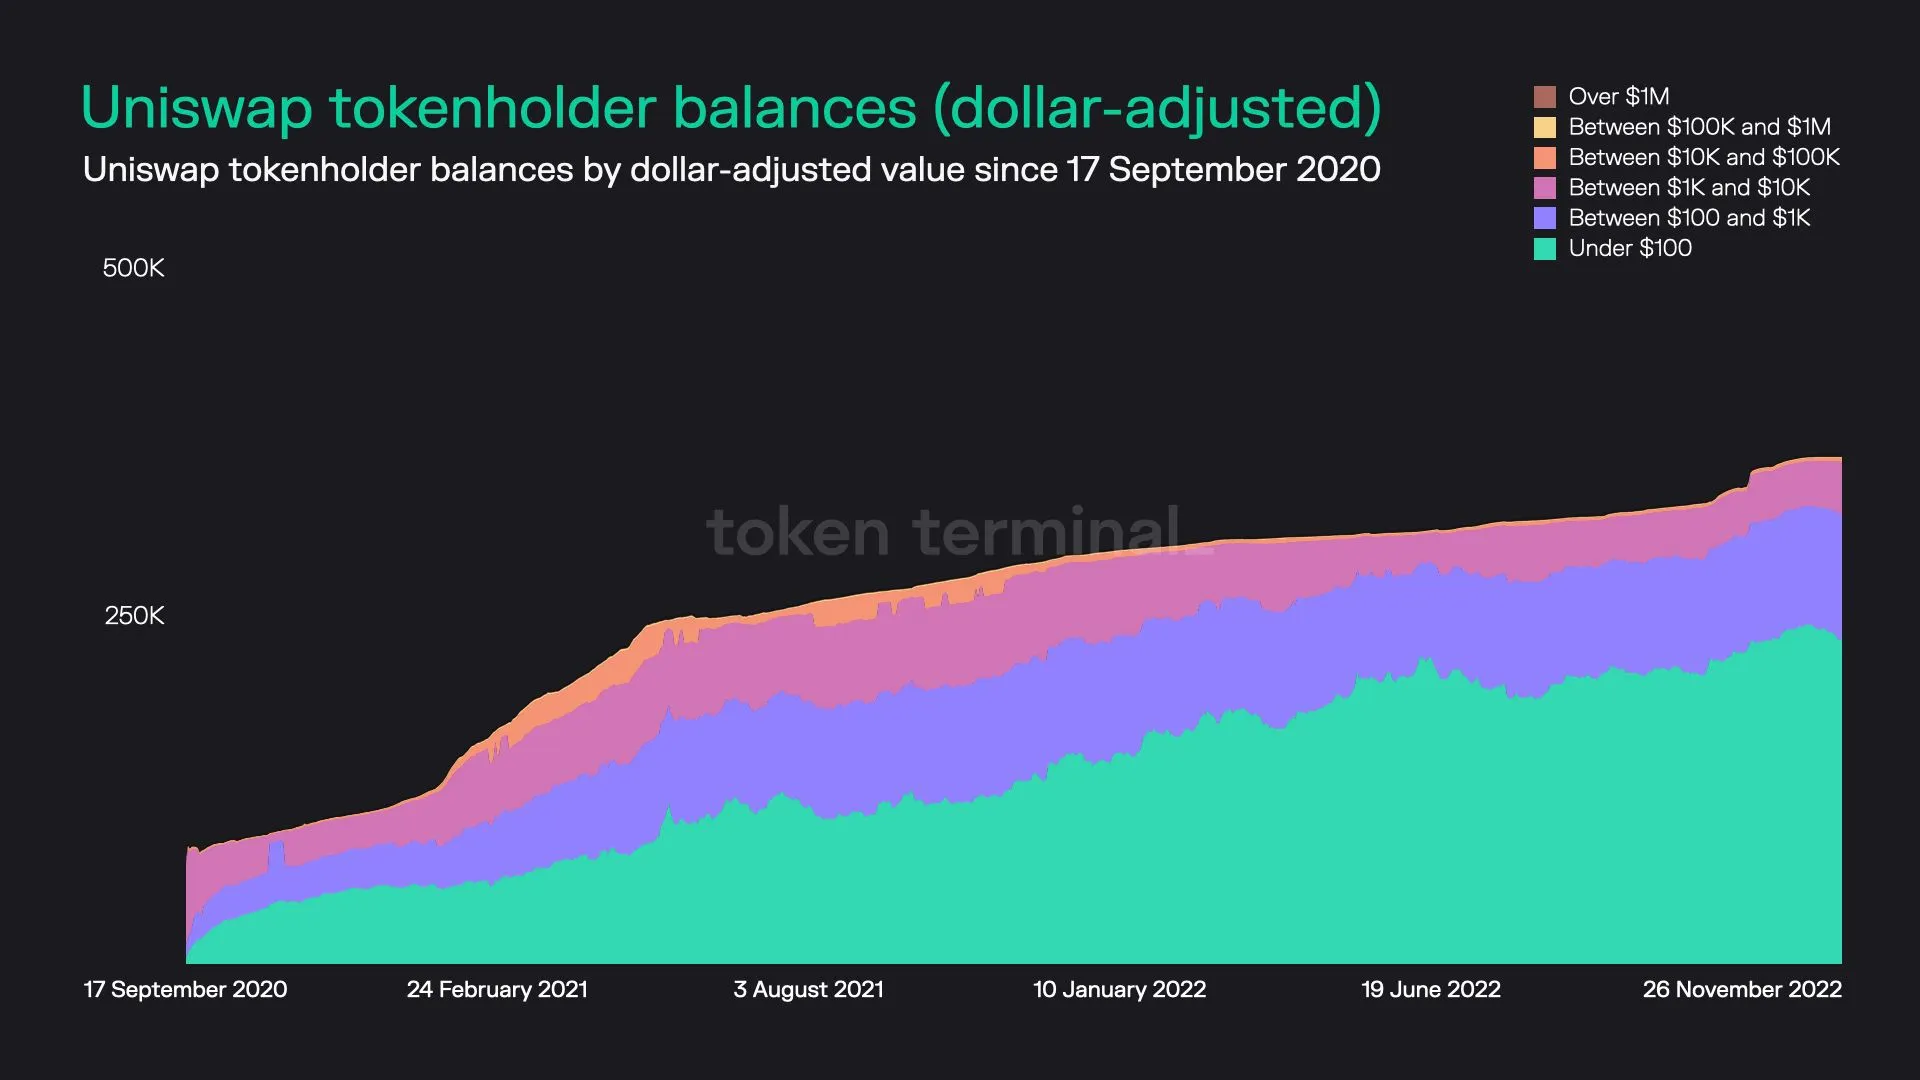
- Total number of UNI holders: 366.4K
- Average dollar-value of UNI per tokenholder: $13.6K
- Percentage of UNI tokens held by the top 100 holders: 84.4%
Uniswap dashboard: https://tokenterminal.com/explorer/projects/uniswap
3. Compound (COMP)
Key stats:
- Circulating market cap: $357.8M
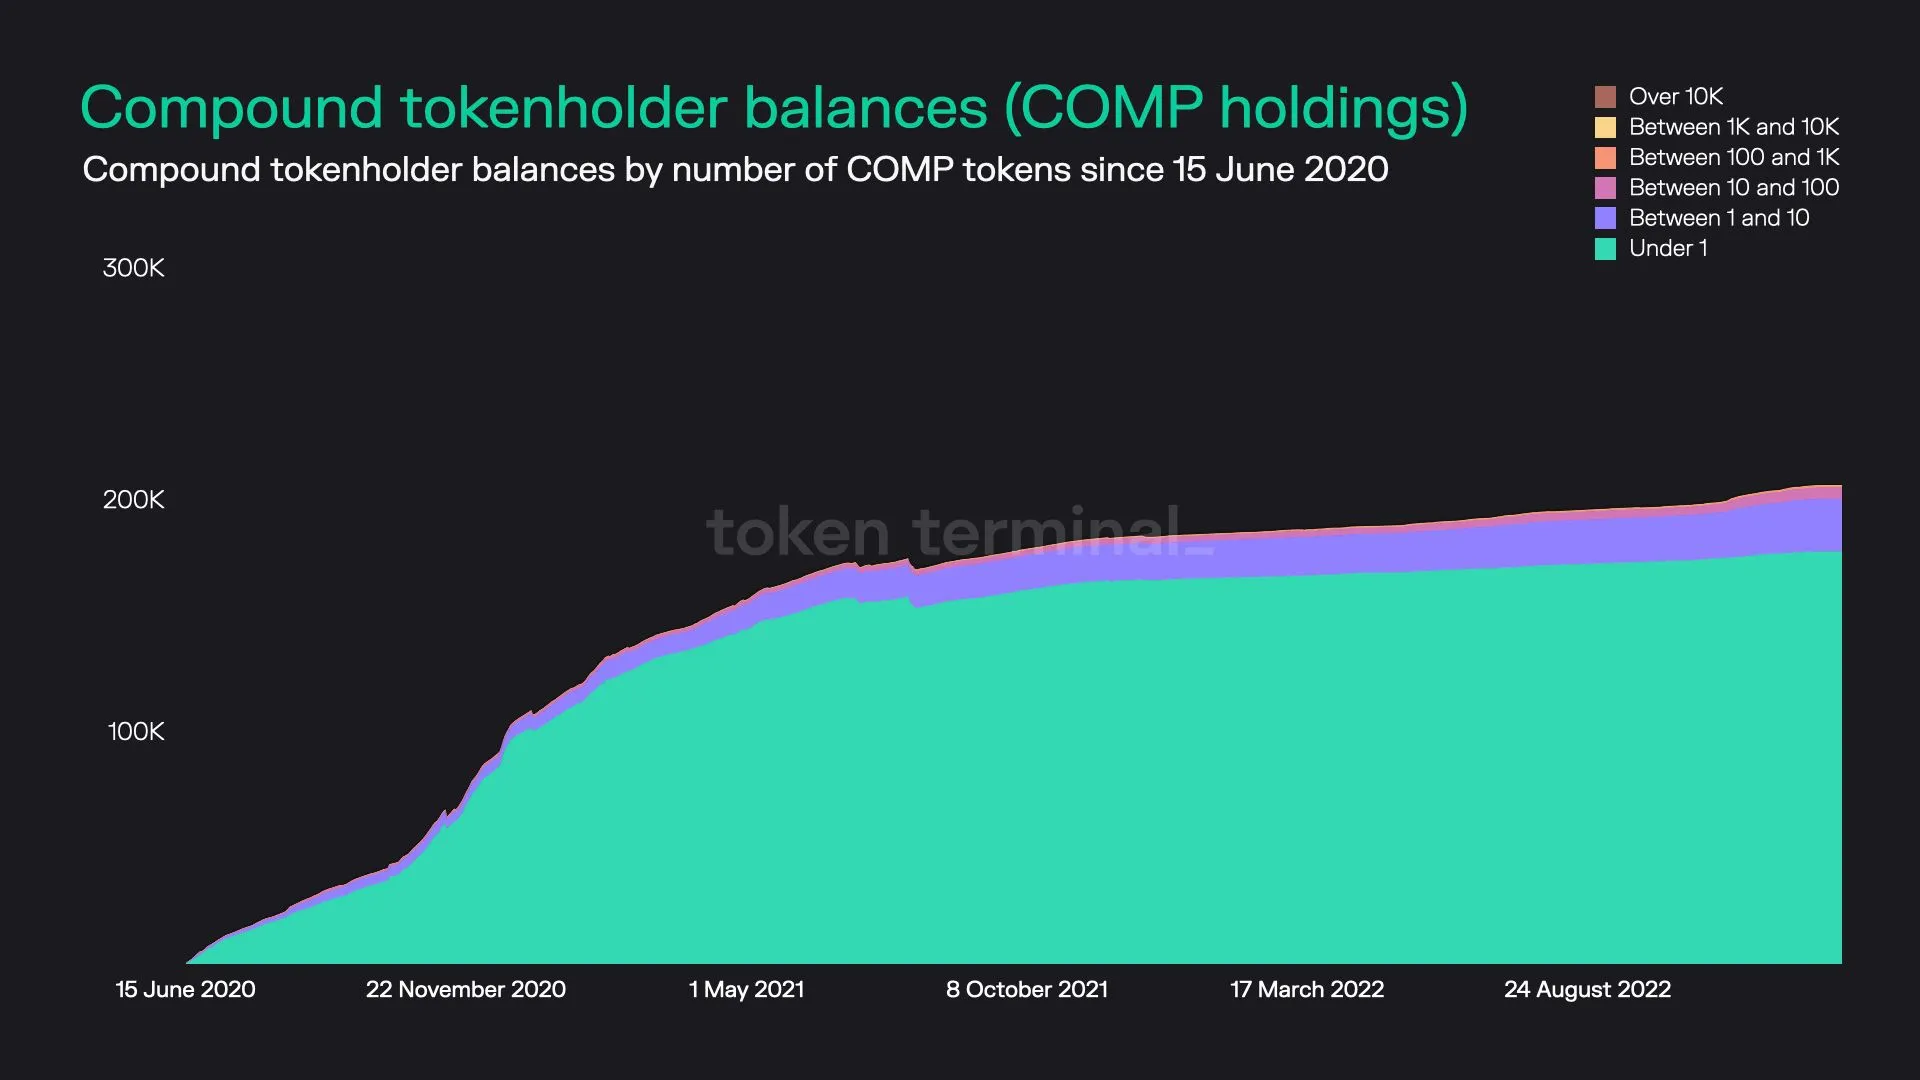
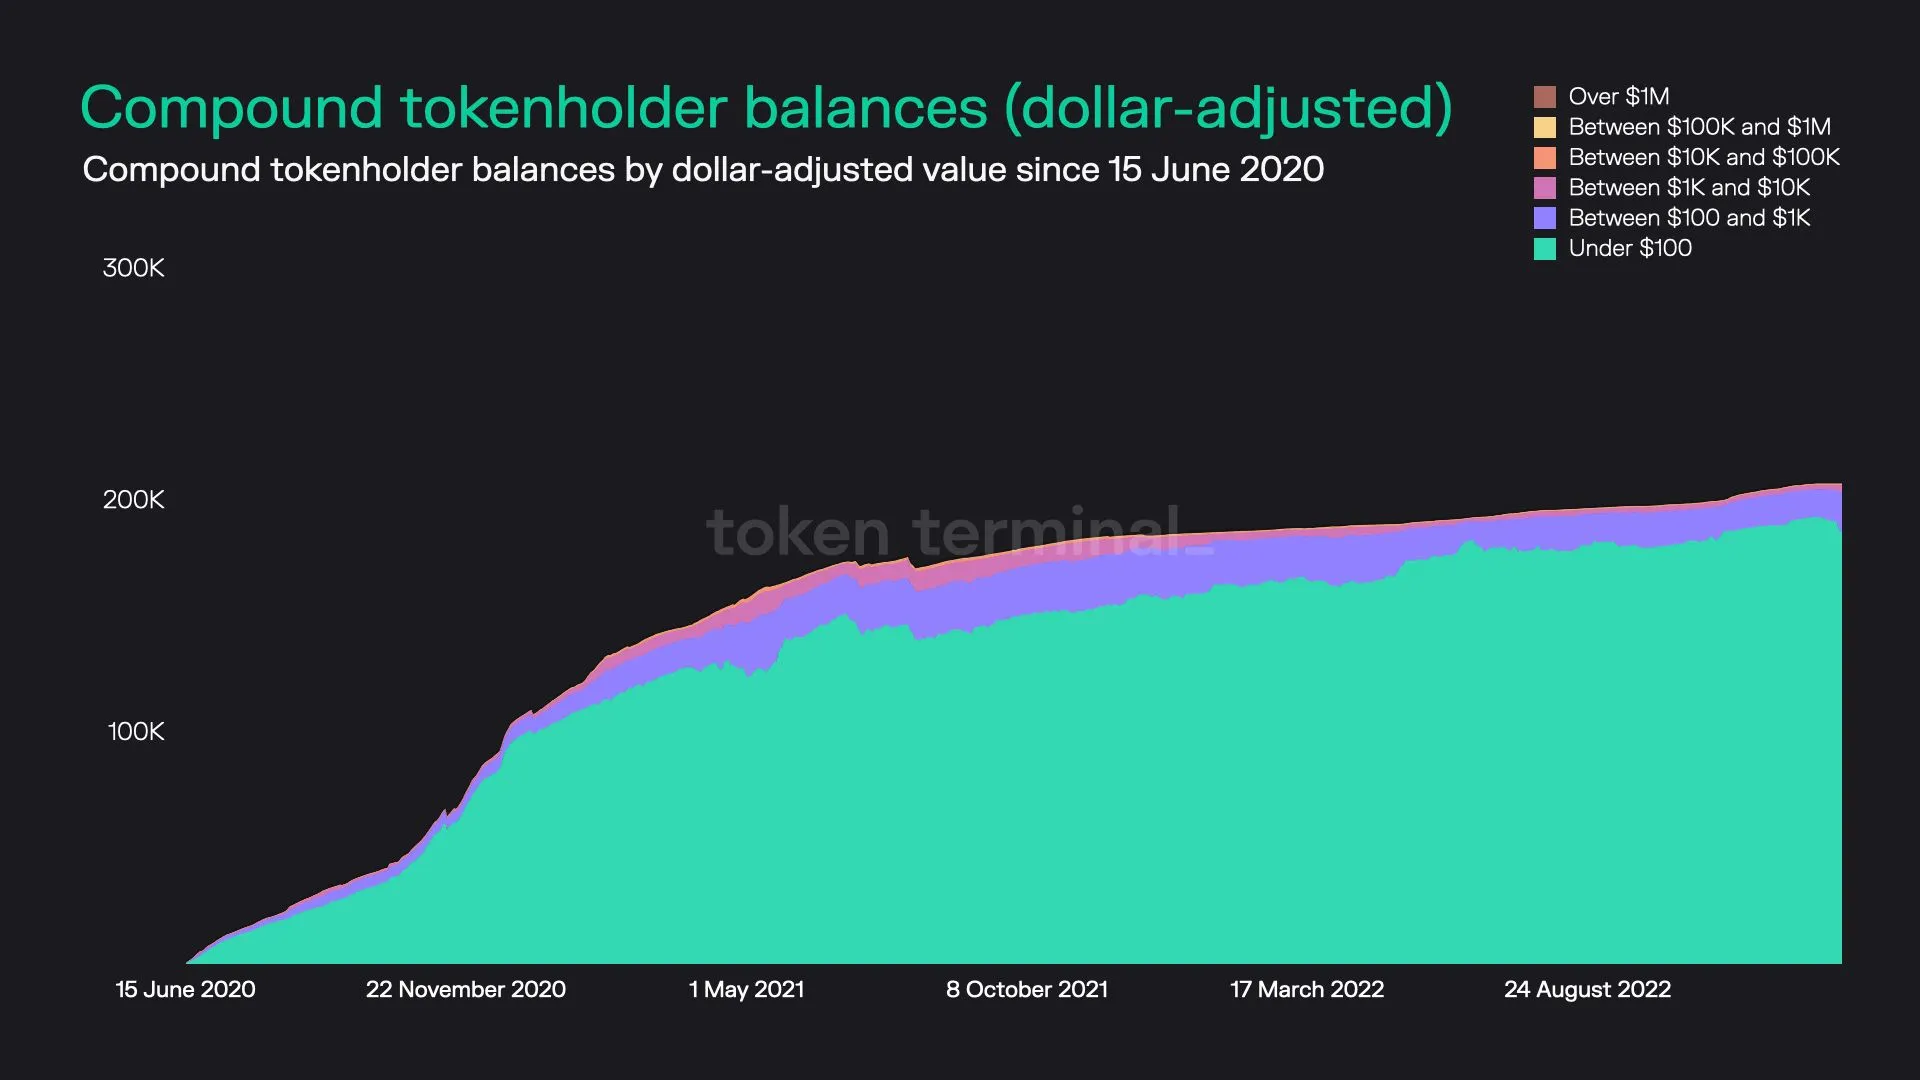
- Total number of COMP holders: 207.6K
- Average dollar-value of COMP per tokenholder: $1.7K
- Percentage of COMP tokens held by the top 100 holders: 88.7%
Compound dashboard: https://tokenterminal.com/explorer/projects/compound
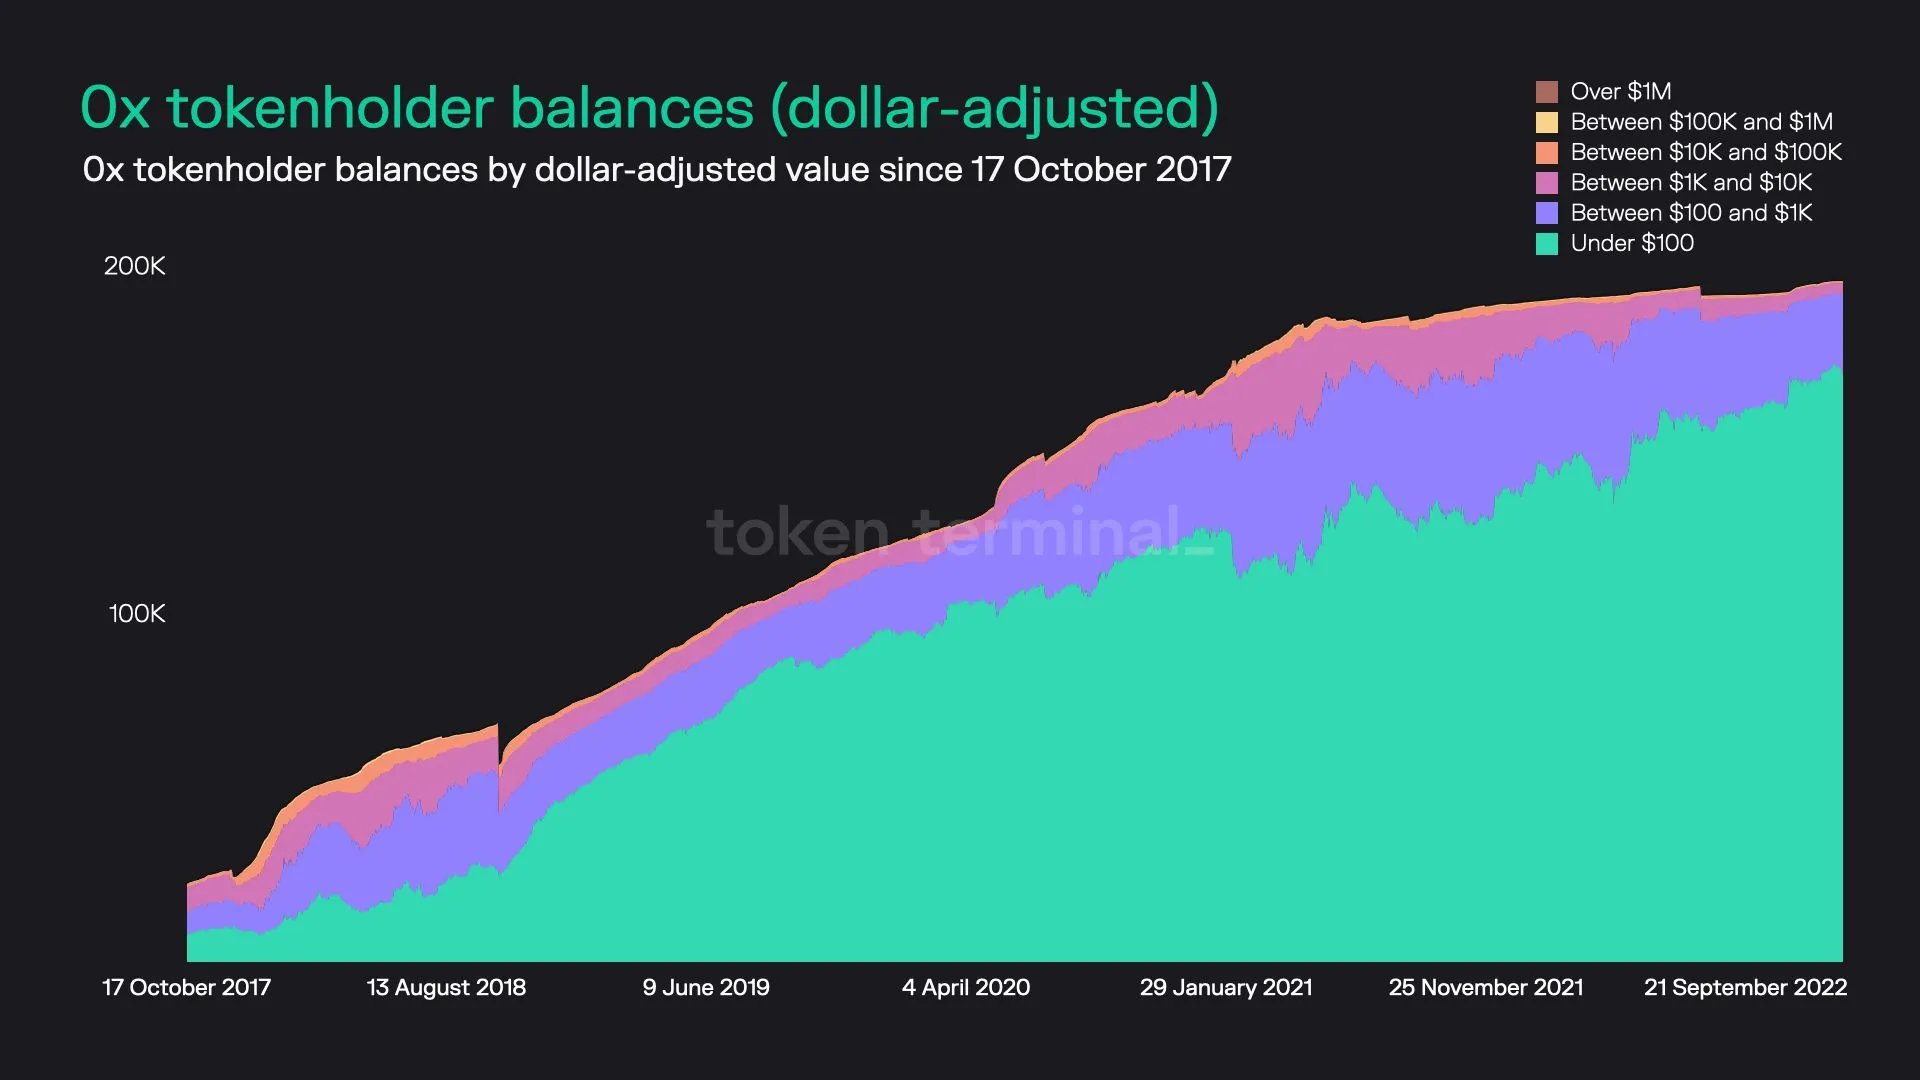
4. 0x (ZRX)
Key stats:
- Circulating market cap: $357.8M
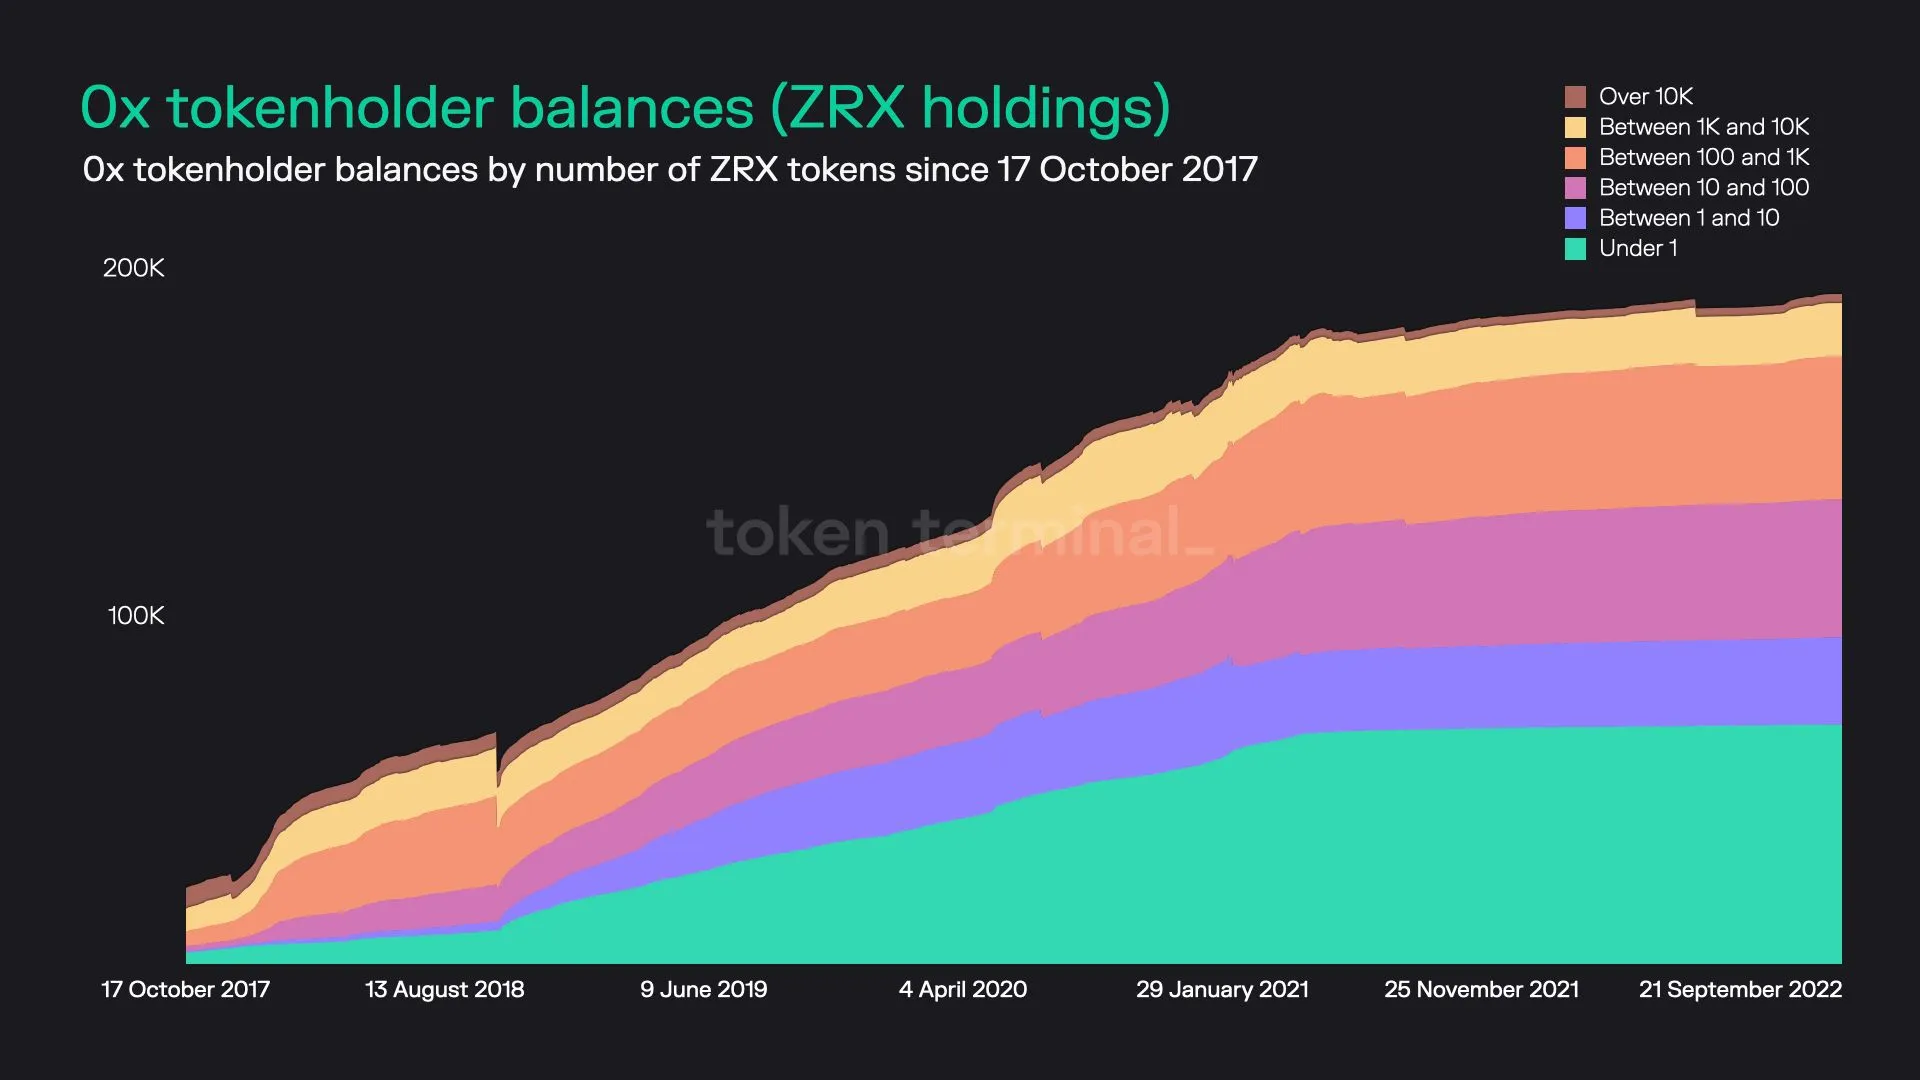
- Total number of ZRX holders: 207.6K
- Average dollar-value of ZRX per tokenholder: $1.7K
- Percentage of ZRX tokens held by the top 100 holders: 73.6%
0x dashboard: https://tokenterminal.com/explorer/projects/0x
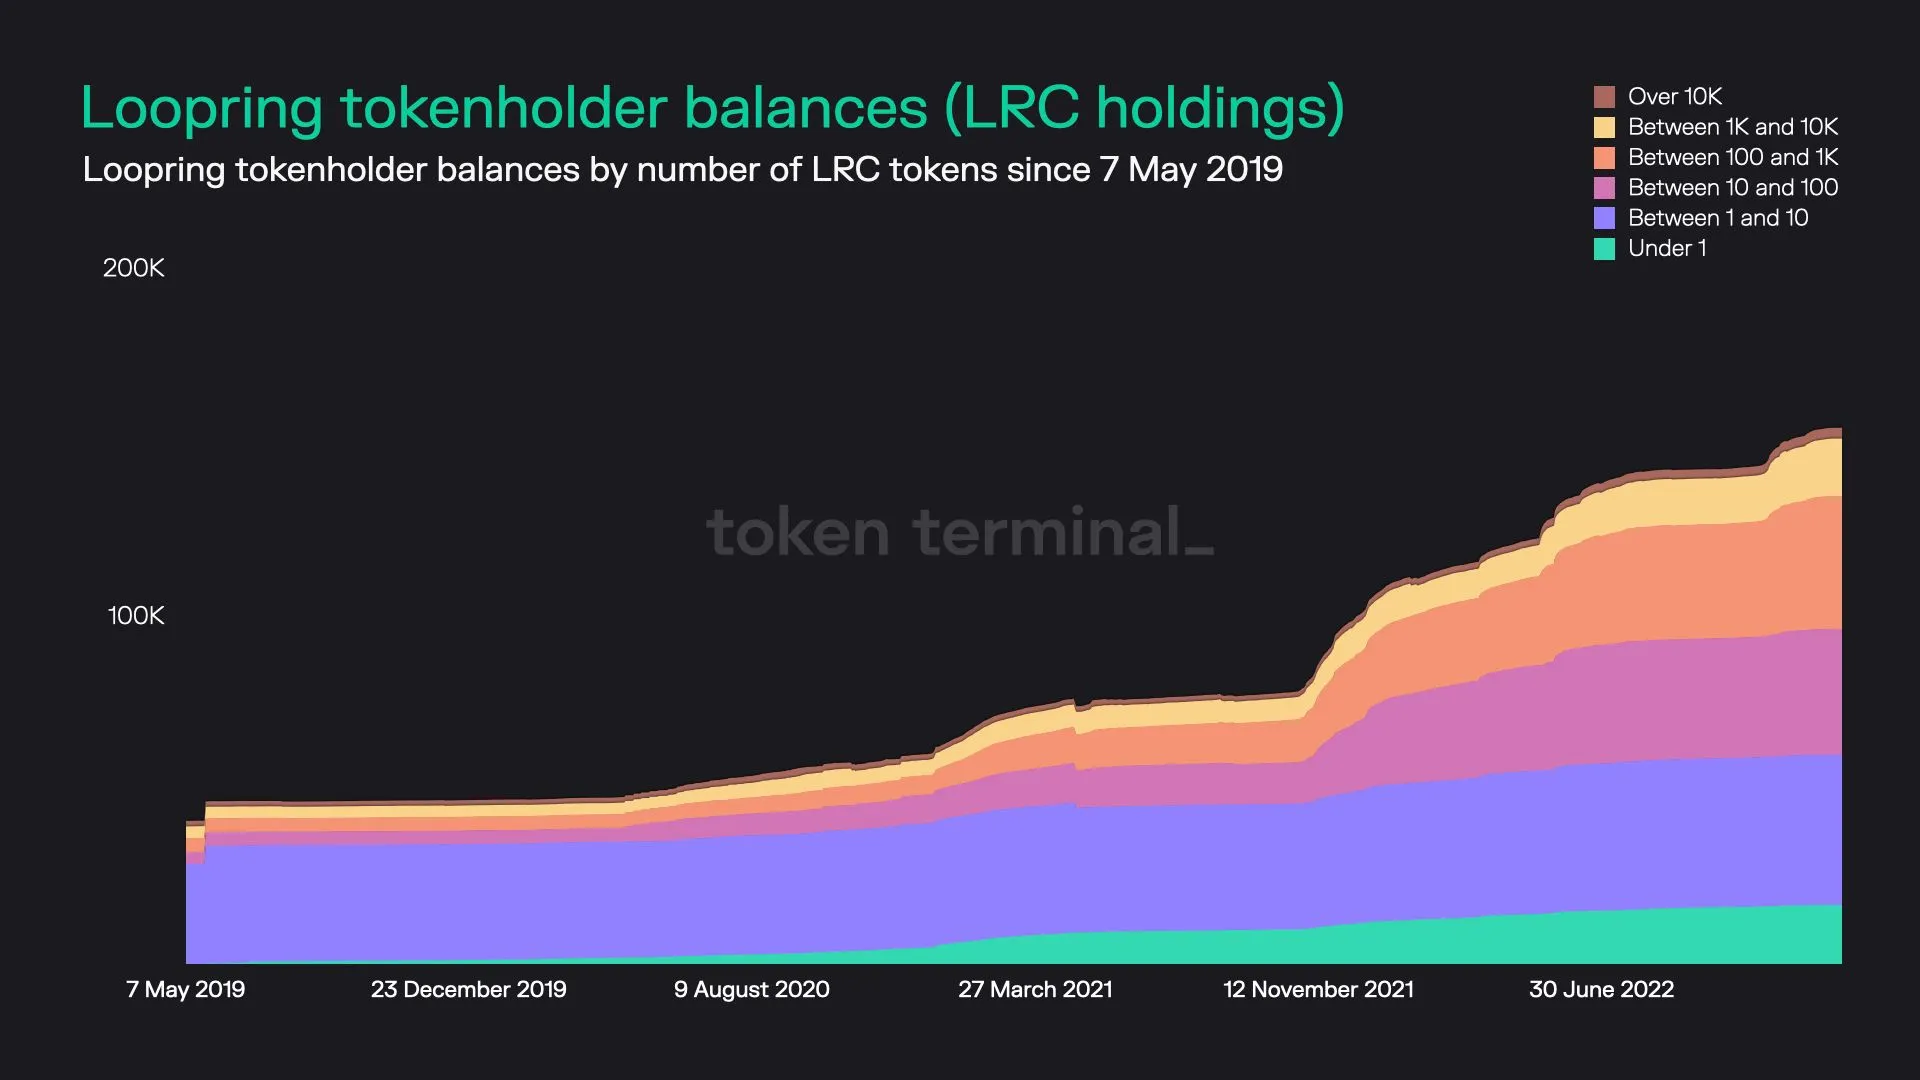
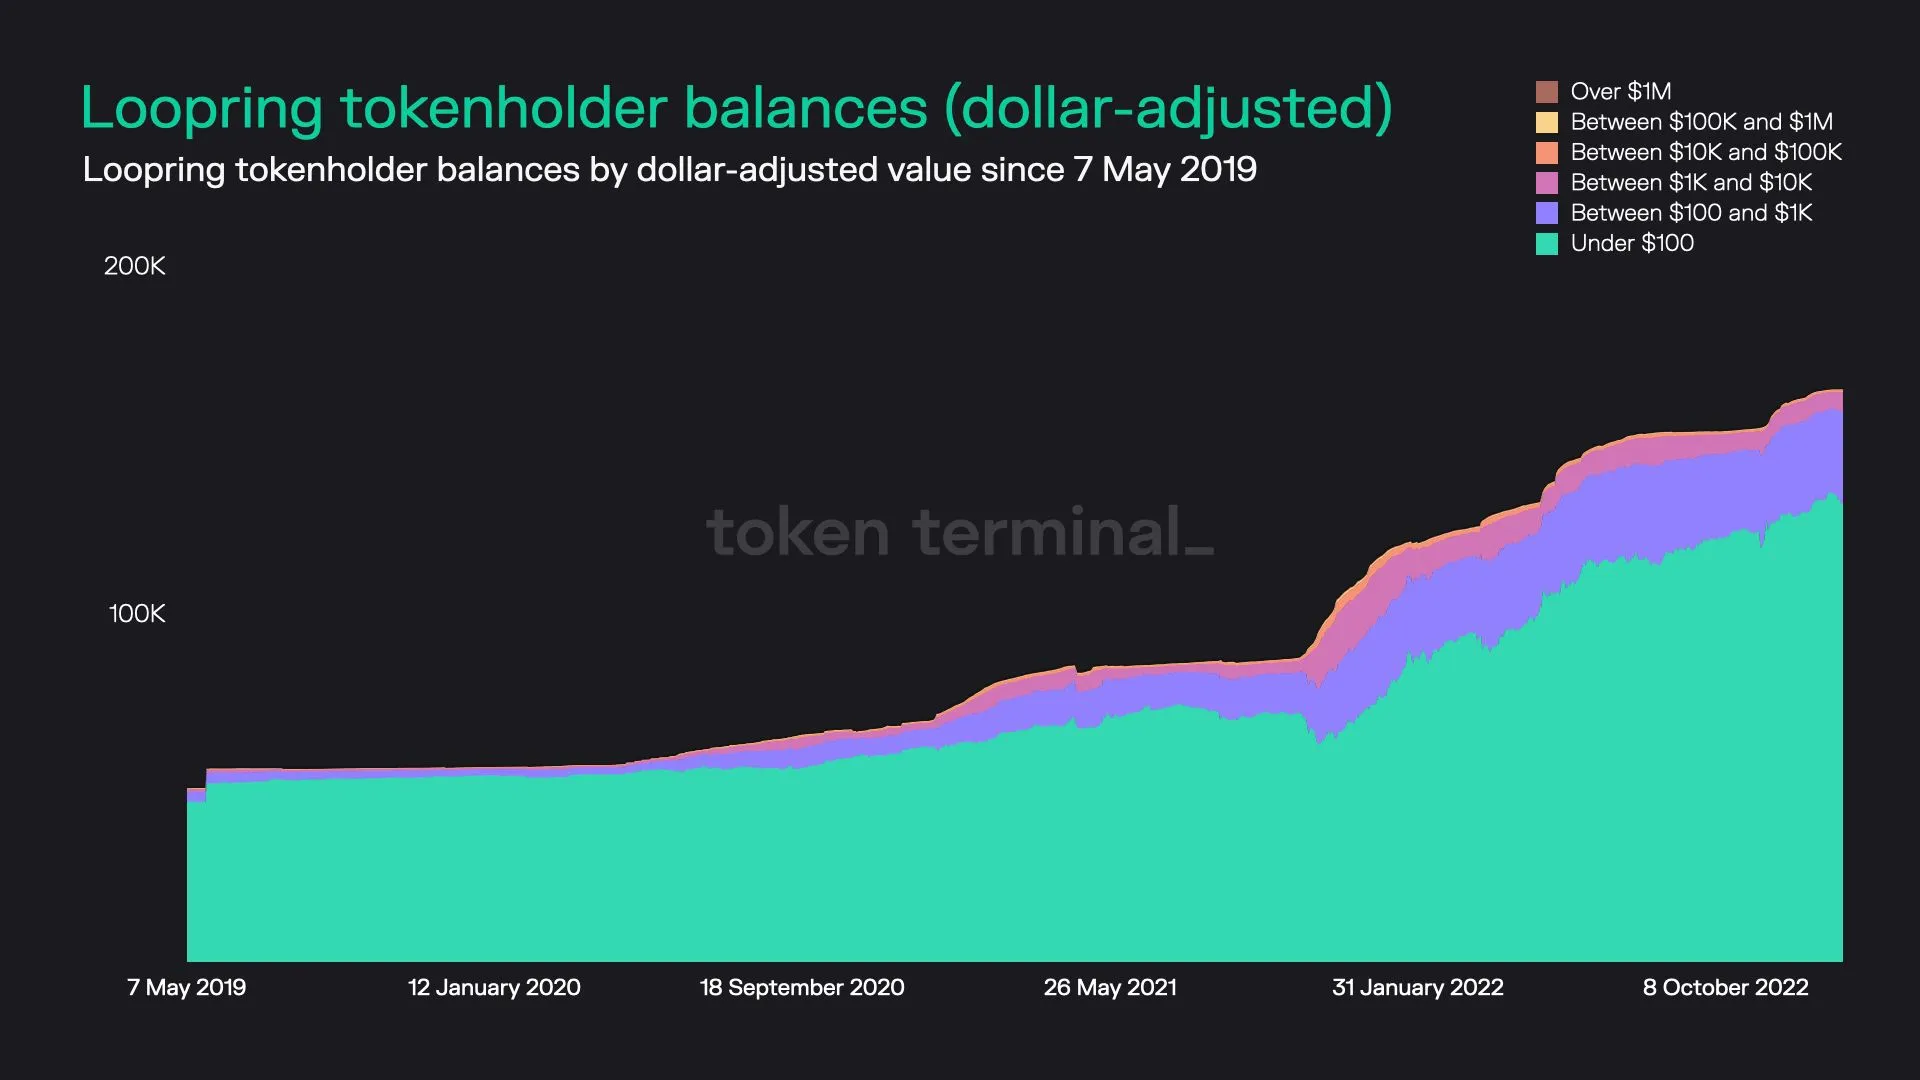
5. Loopring (LRC)
Key stats:
- Circulating market cap: $343.1M
- Total number of LRC holders: 165.2K
- Average dollar-value of LRC per tokenholder: $2.1K
- Percentage of LRC tokens held by the top 100 holders: 76.9%
Loopring dashboard: https://tokenterminal.com/explorer/projects/loopring
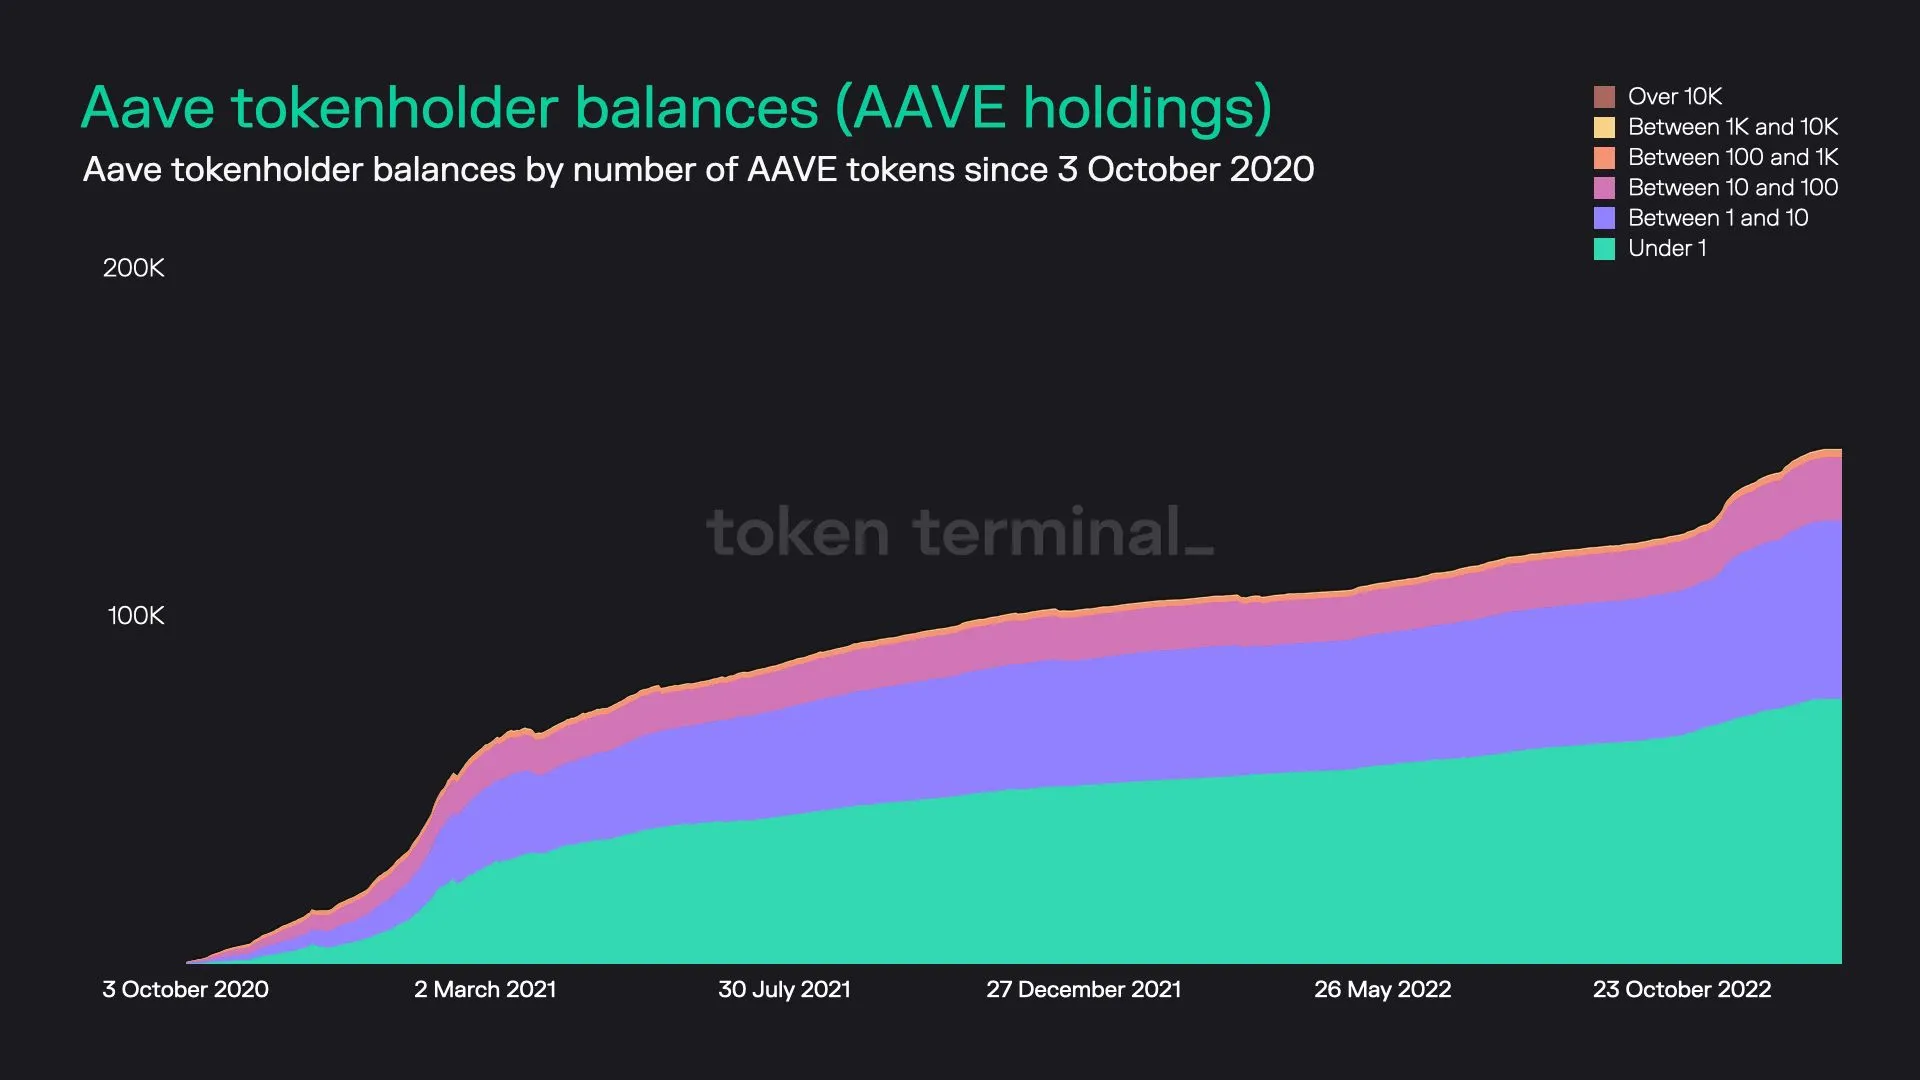
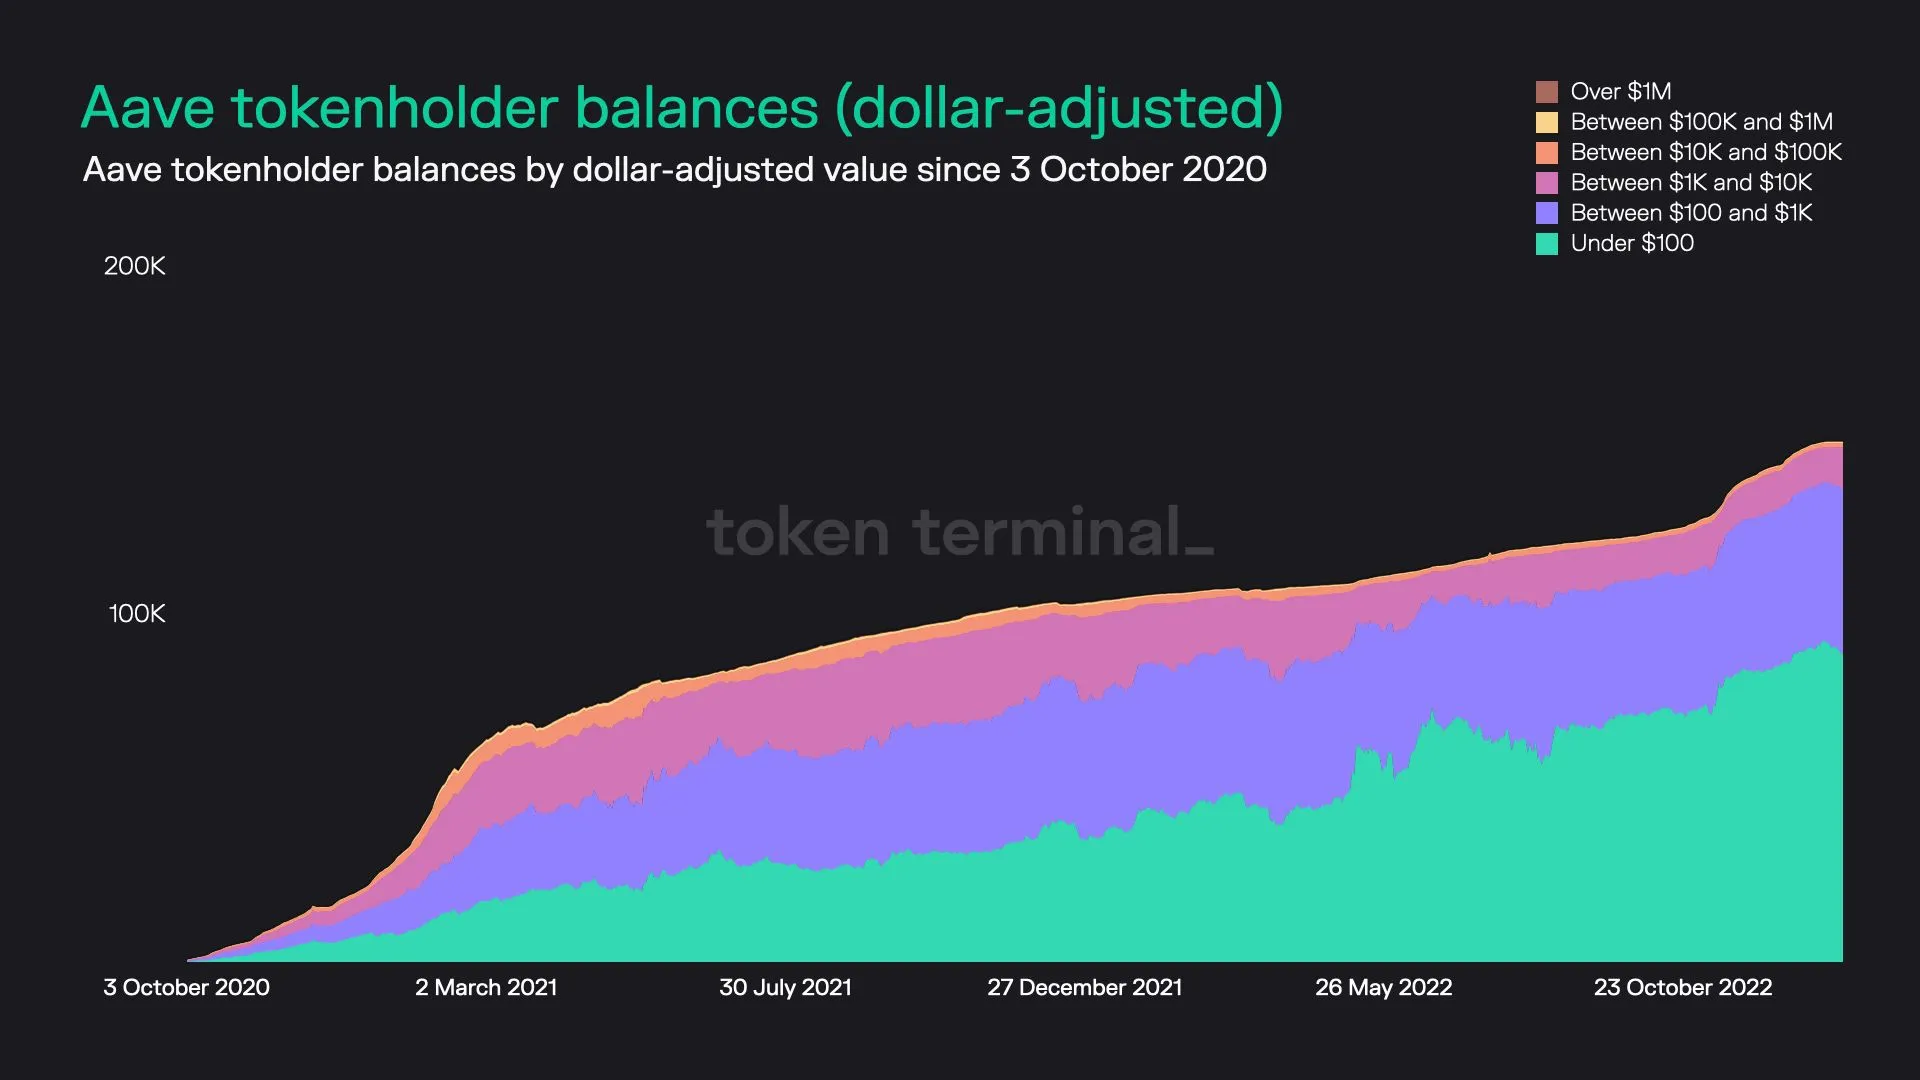
6. Aave (AAVE)
Key stats:
- Circulating market cap: $1.1B
- Total number of AAVE holders: 151.4K
- Average dollar-value of AAVE per tokenholder: $7.4K
- Percentage of AAVE tokens held by the top 100 holders: 83.5%
Aave dashboard: https://tokenterminal.com/explorer/projects/aave
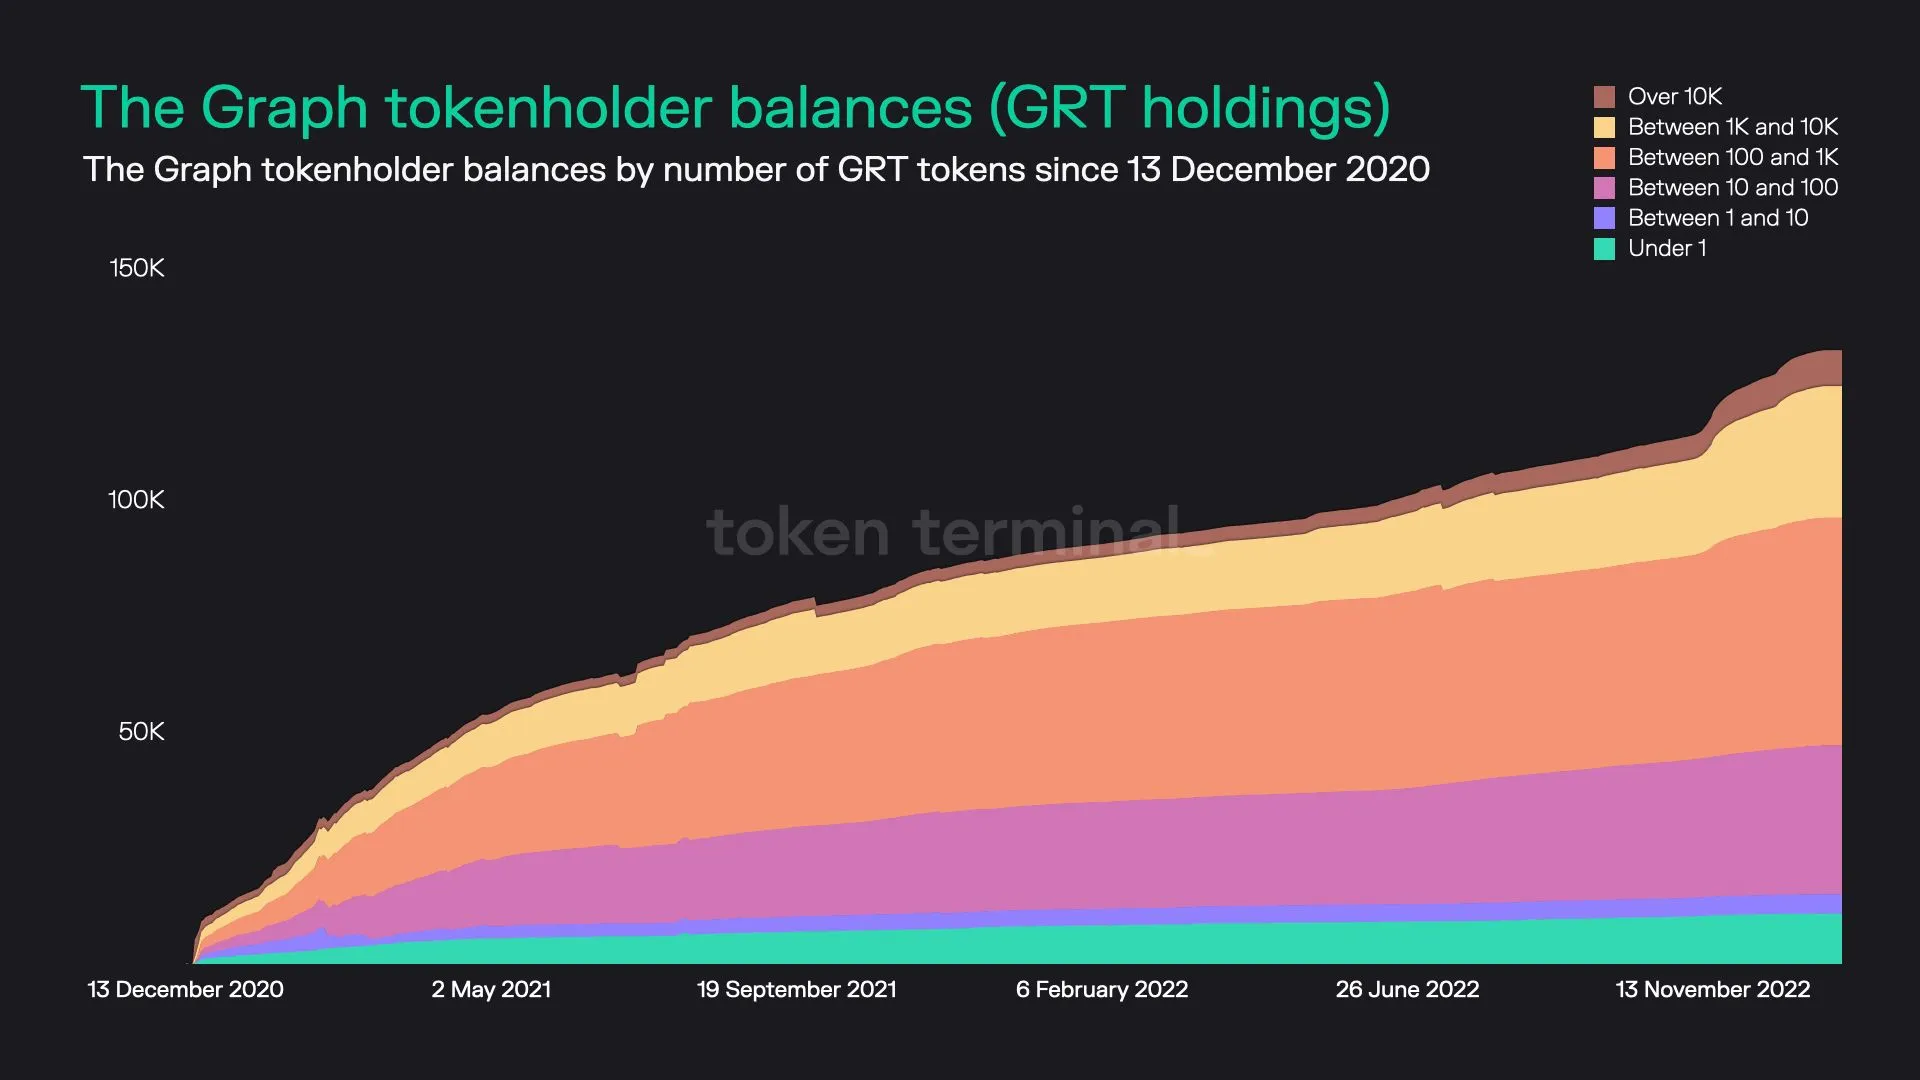
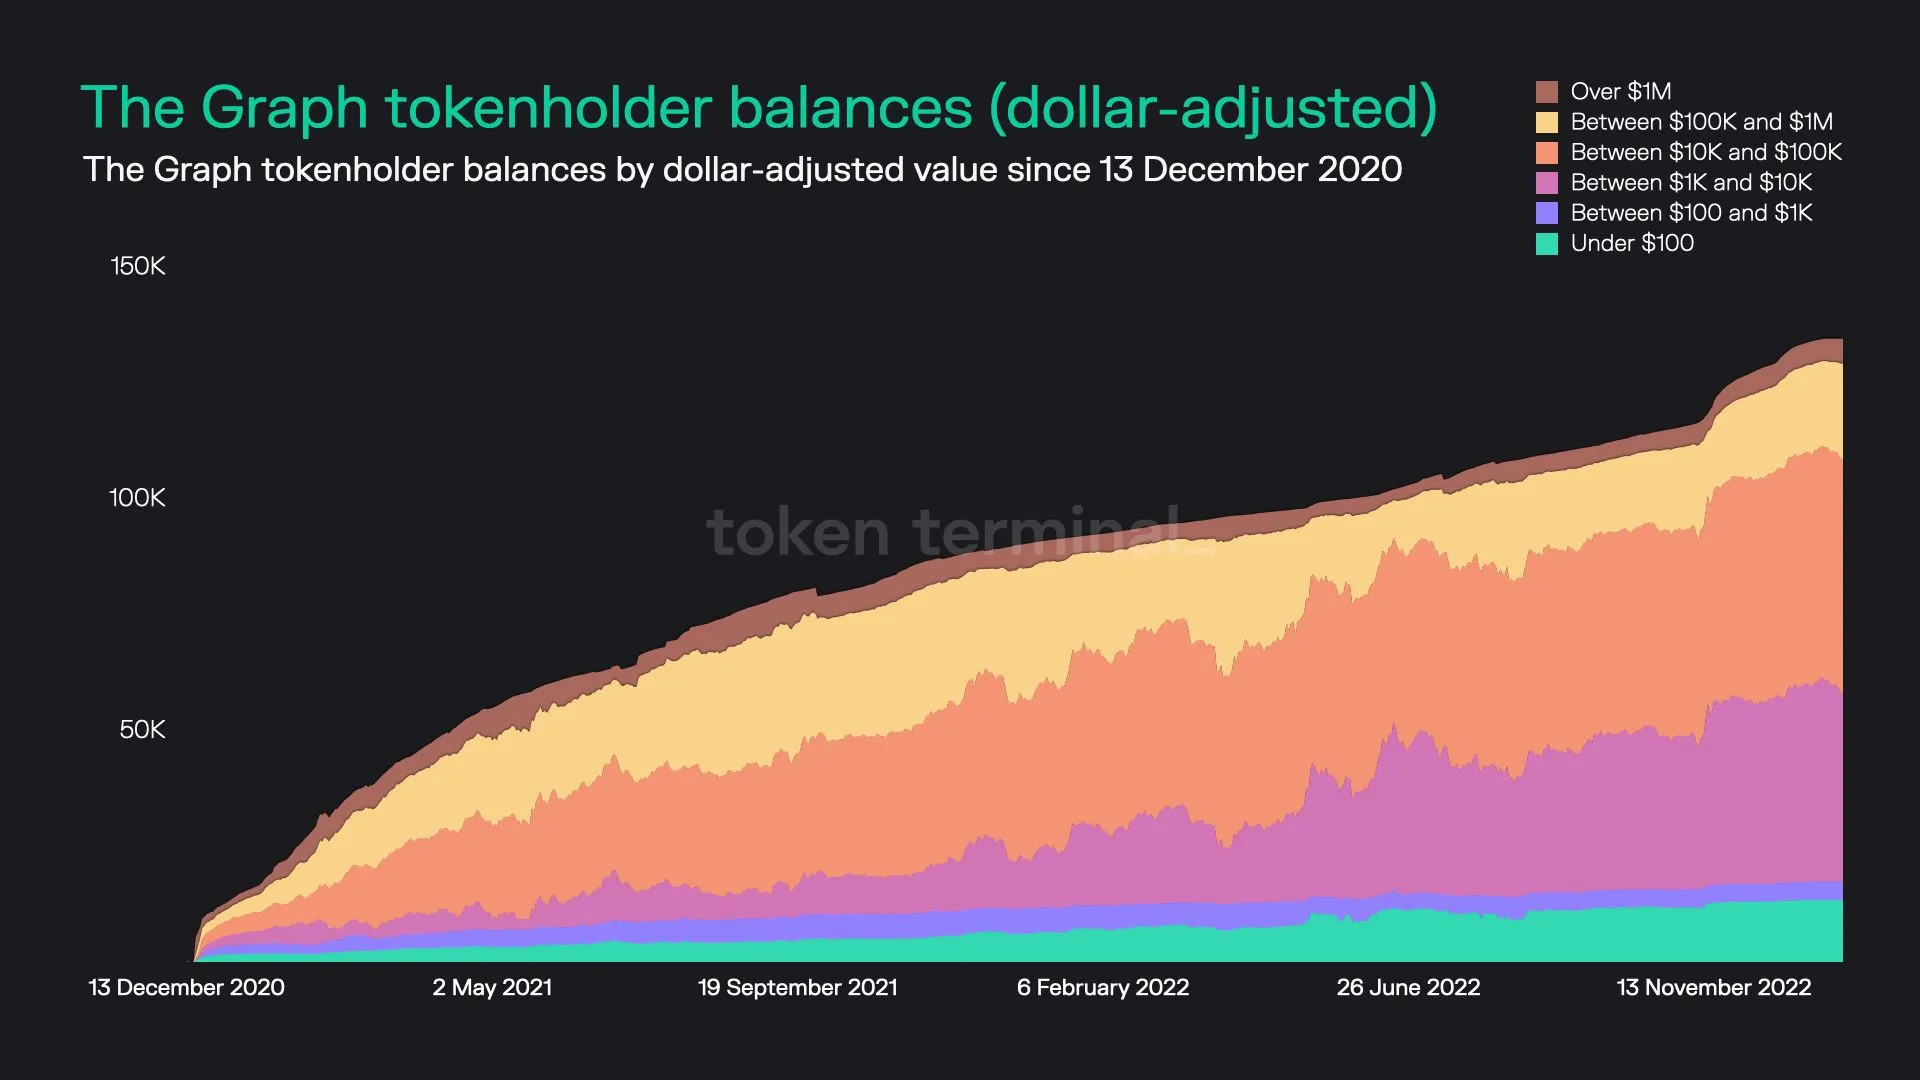
7. The Graph (GRT)
Key stats:
- Circulating market cap: $628.4M
- Total number of GRT holders: 135.9K
- Average dollar-value of GRT per tokenholder: $4.6K
- Percentage of GRT tokens held by the top 100 holders: 83.9%
The Graph dashboard: https://tokenterminal.com/explorer/projects/the-graph
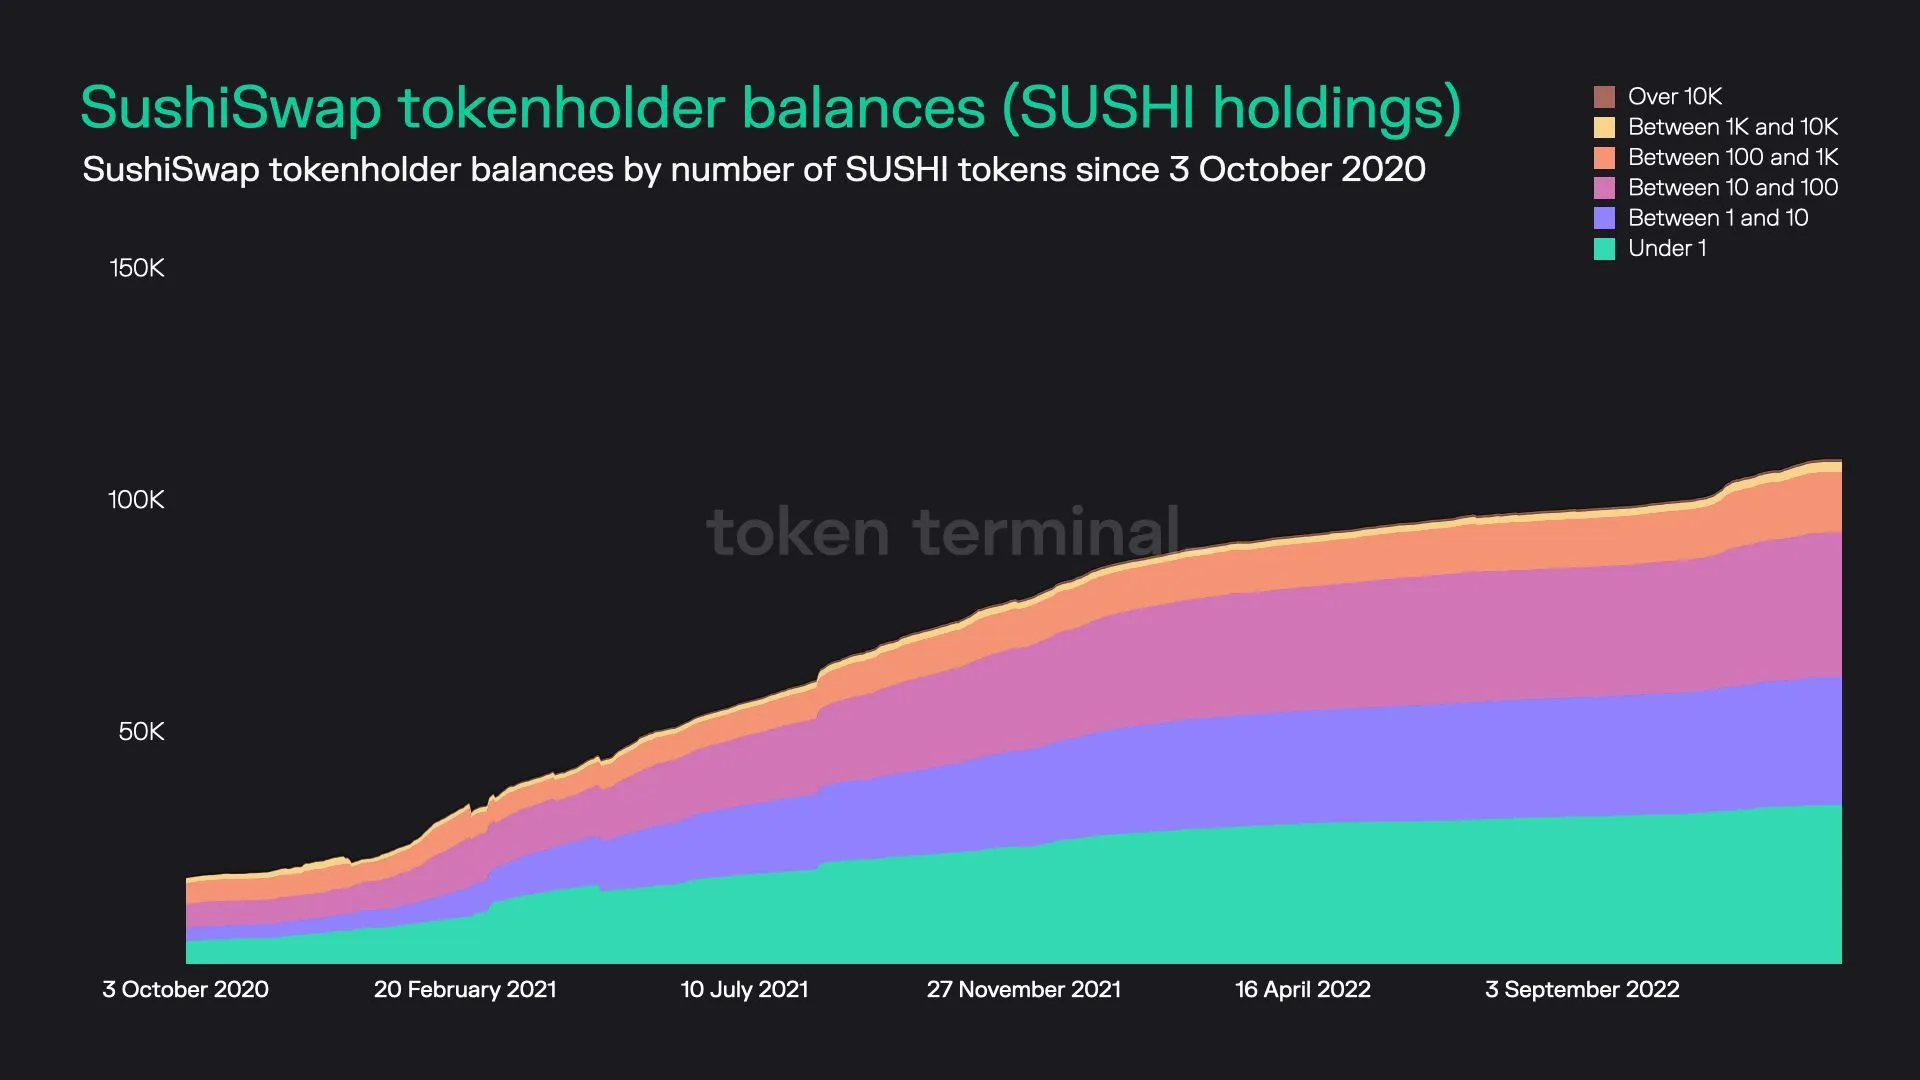
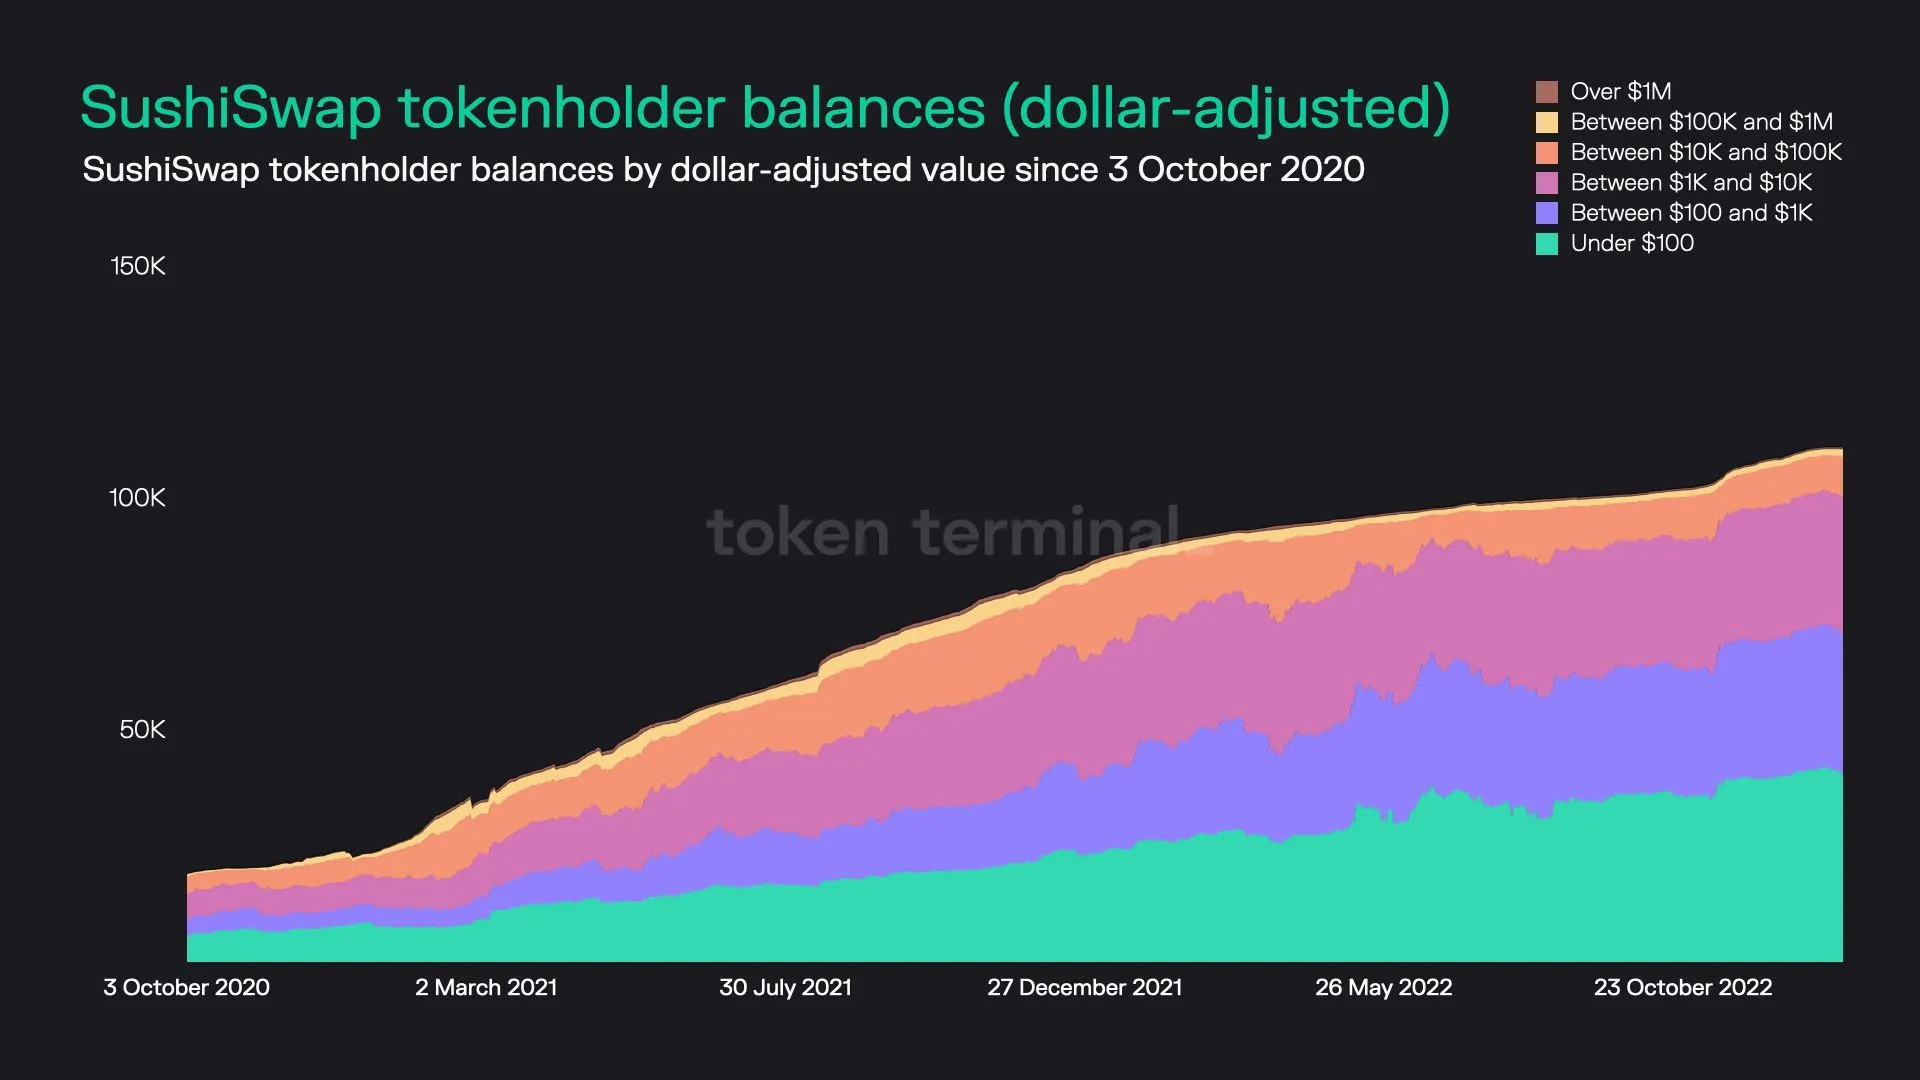
8. SushiSwap (SUSHI)
Key stats:
- Circulating market cap: $247.5M
- Total number of SUSHI holders: 111.5K
- Average dollar-value of SUSHI per tokenholder: $2.2K
- Percentage of SUSHI tokens held by the top 100 holders: 85.3%
SushiSwap dashboard: https://tokenterminal.com/explorer/projects/sushiswap
9. 1inch (1INCH)
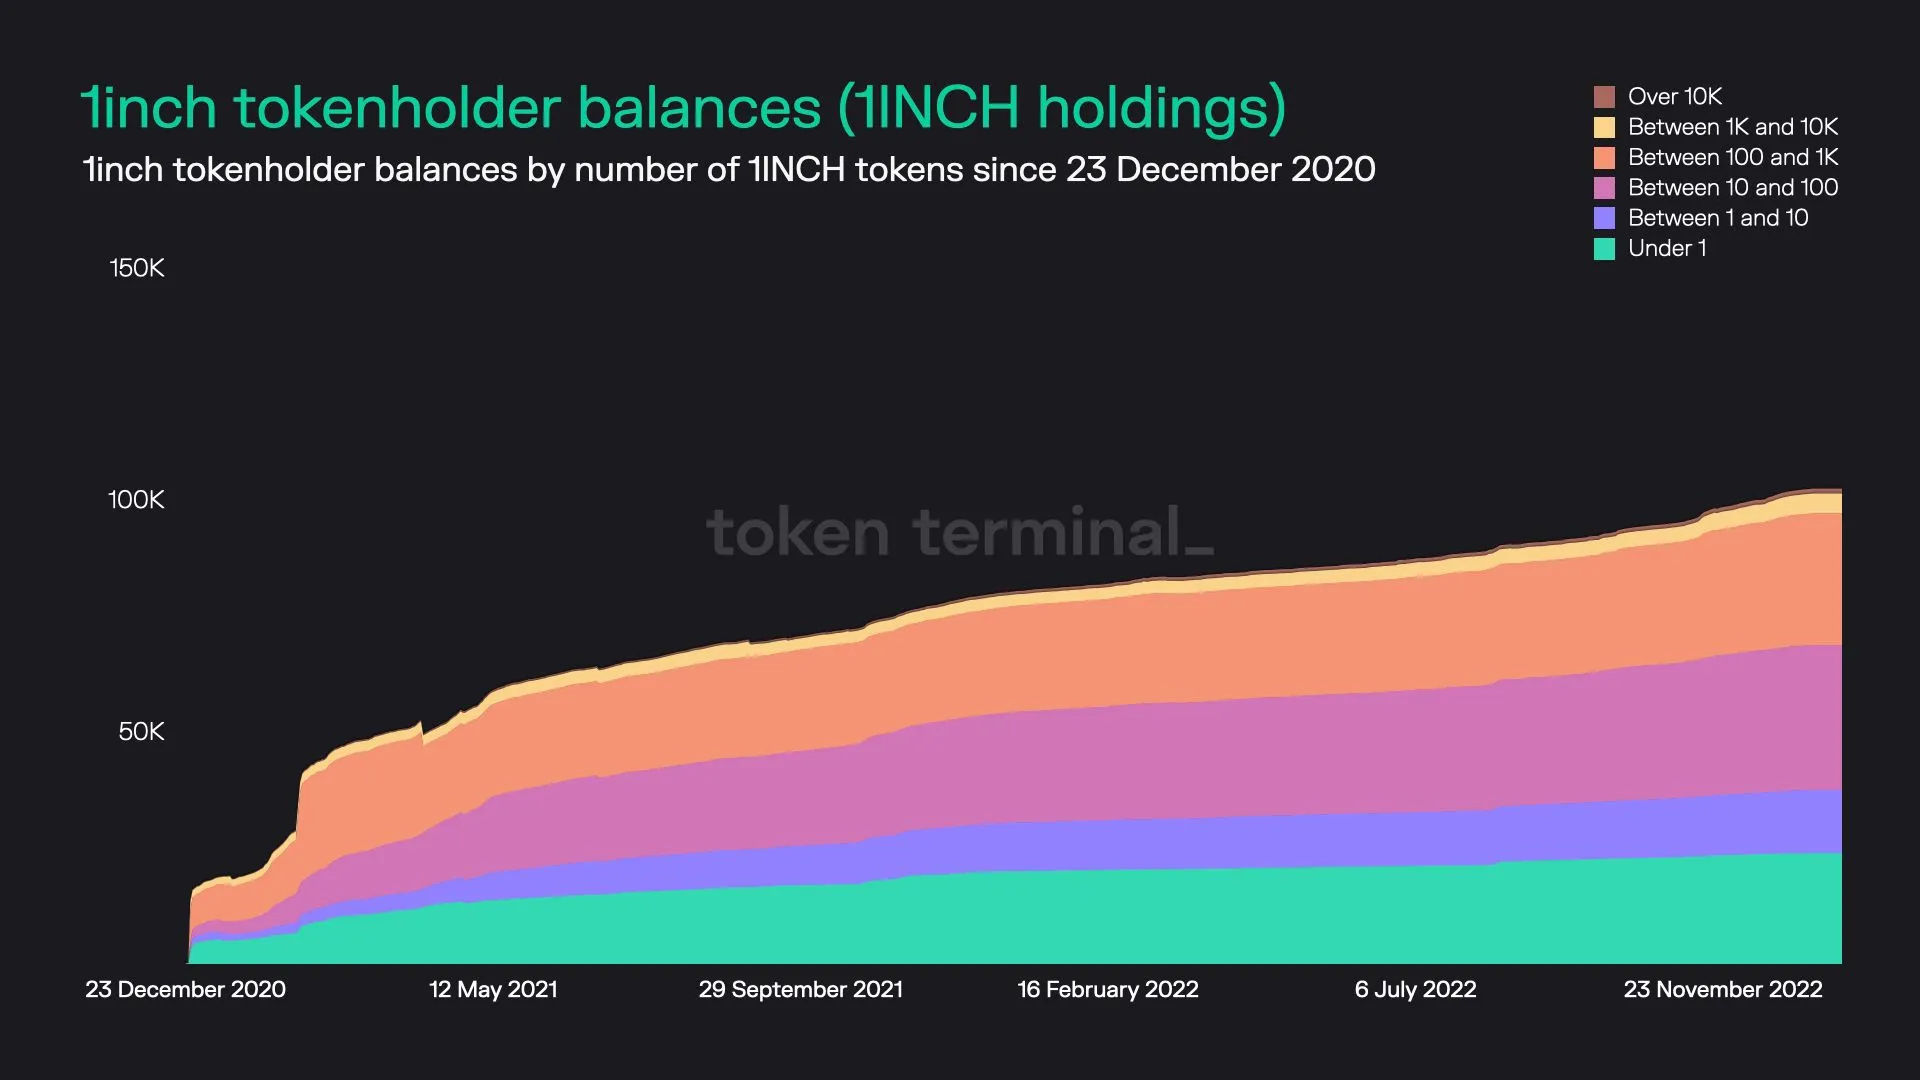
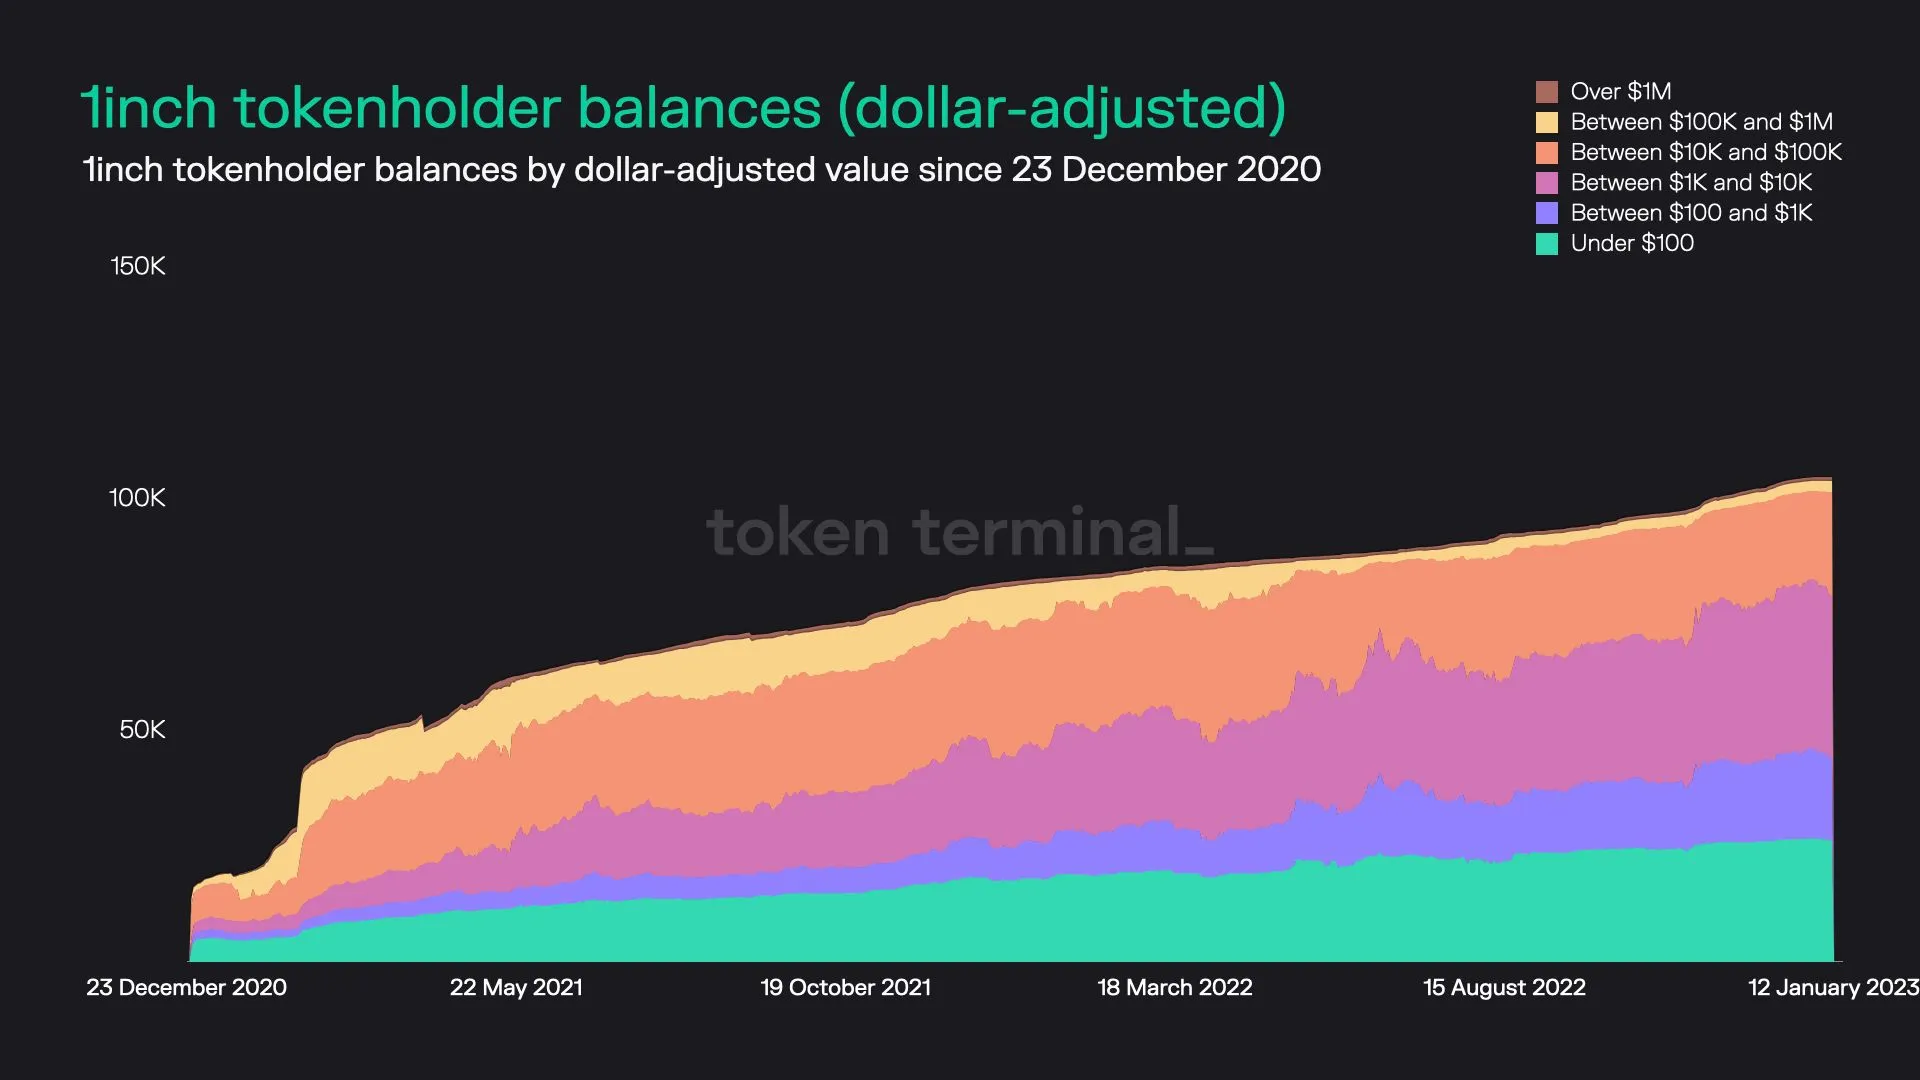
Key stats:
- Circulating market cap: $396.2M
- Total number of 1INCH holders: 105.4K
- Average dollar-value of 1INCH per tokenholder: $3.8K
- Percentage of 1INCH tokens held by the top 100 holders: 85.1%
1inch dashboard: https://tokenterminal.com/explorer/projects/1inch
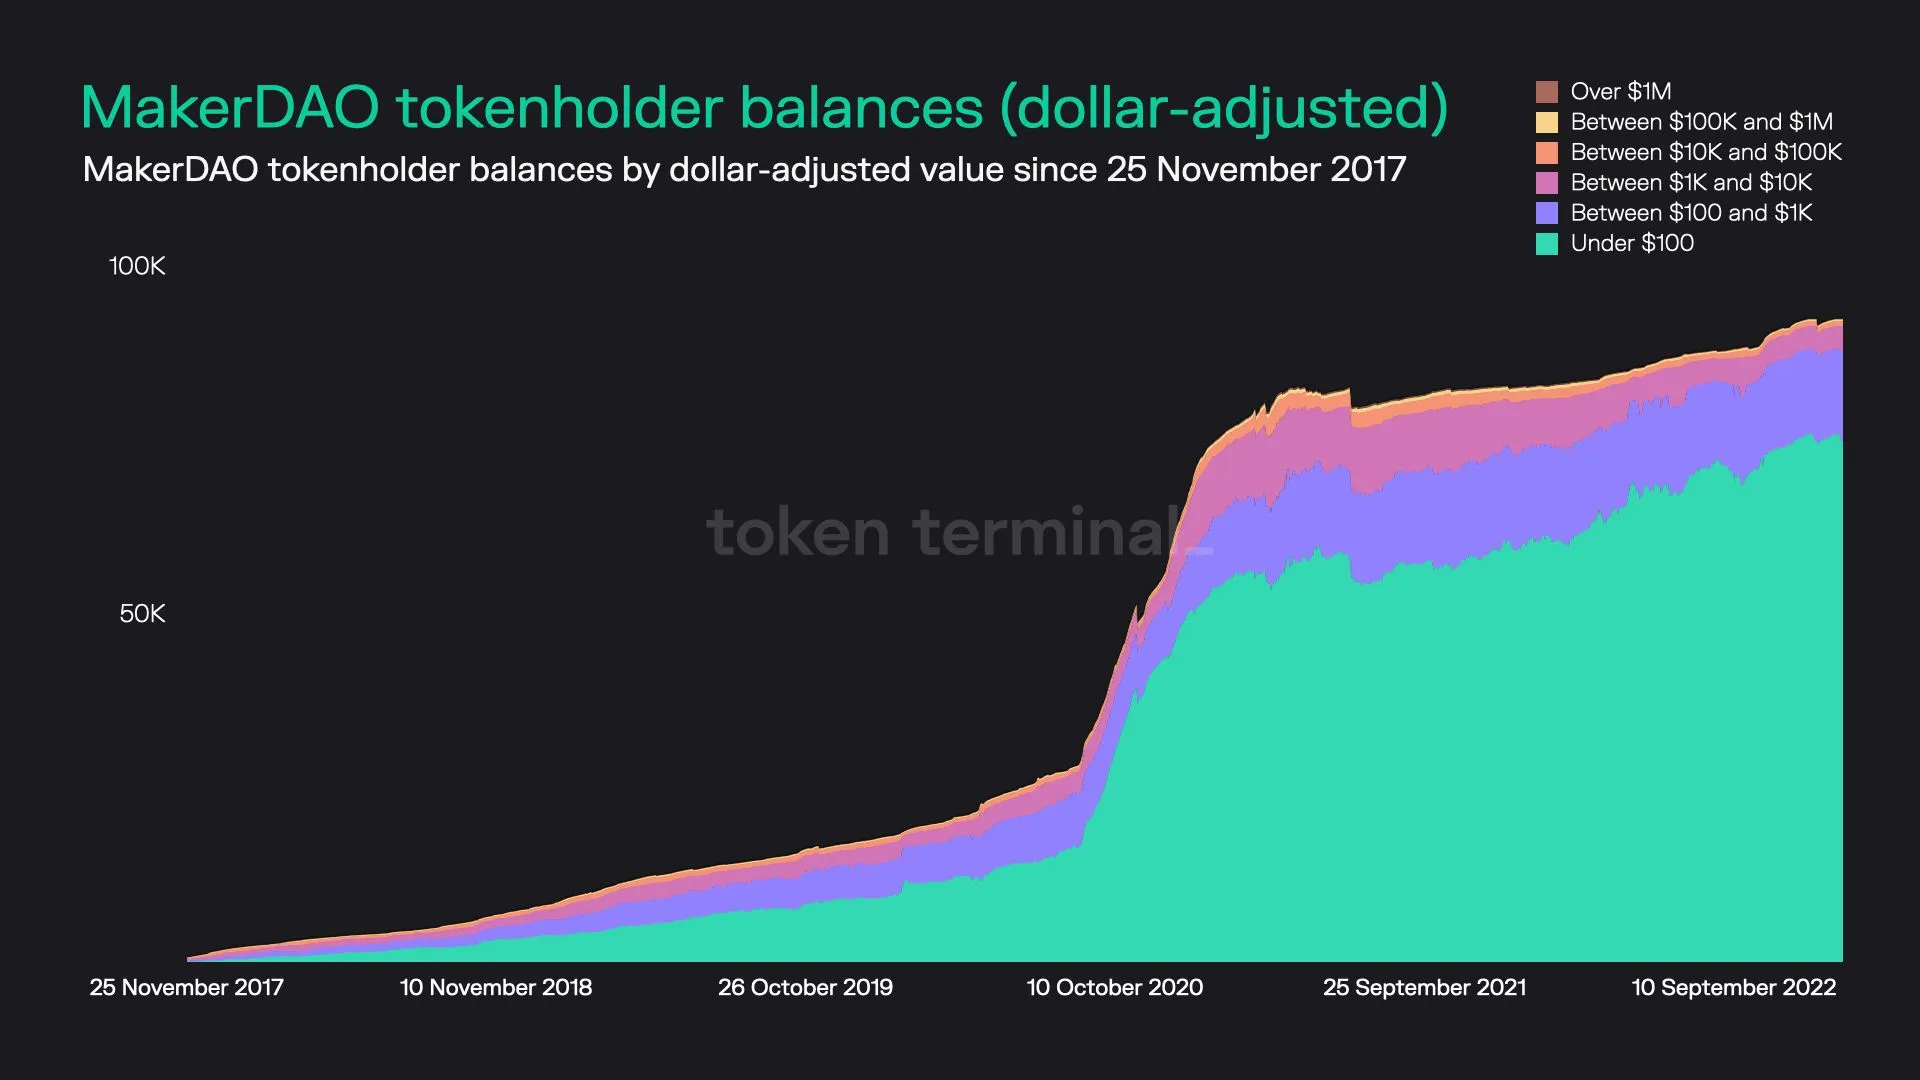
10. MakerDAO (MKR)
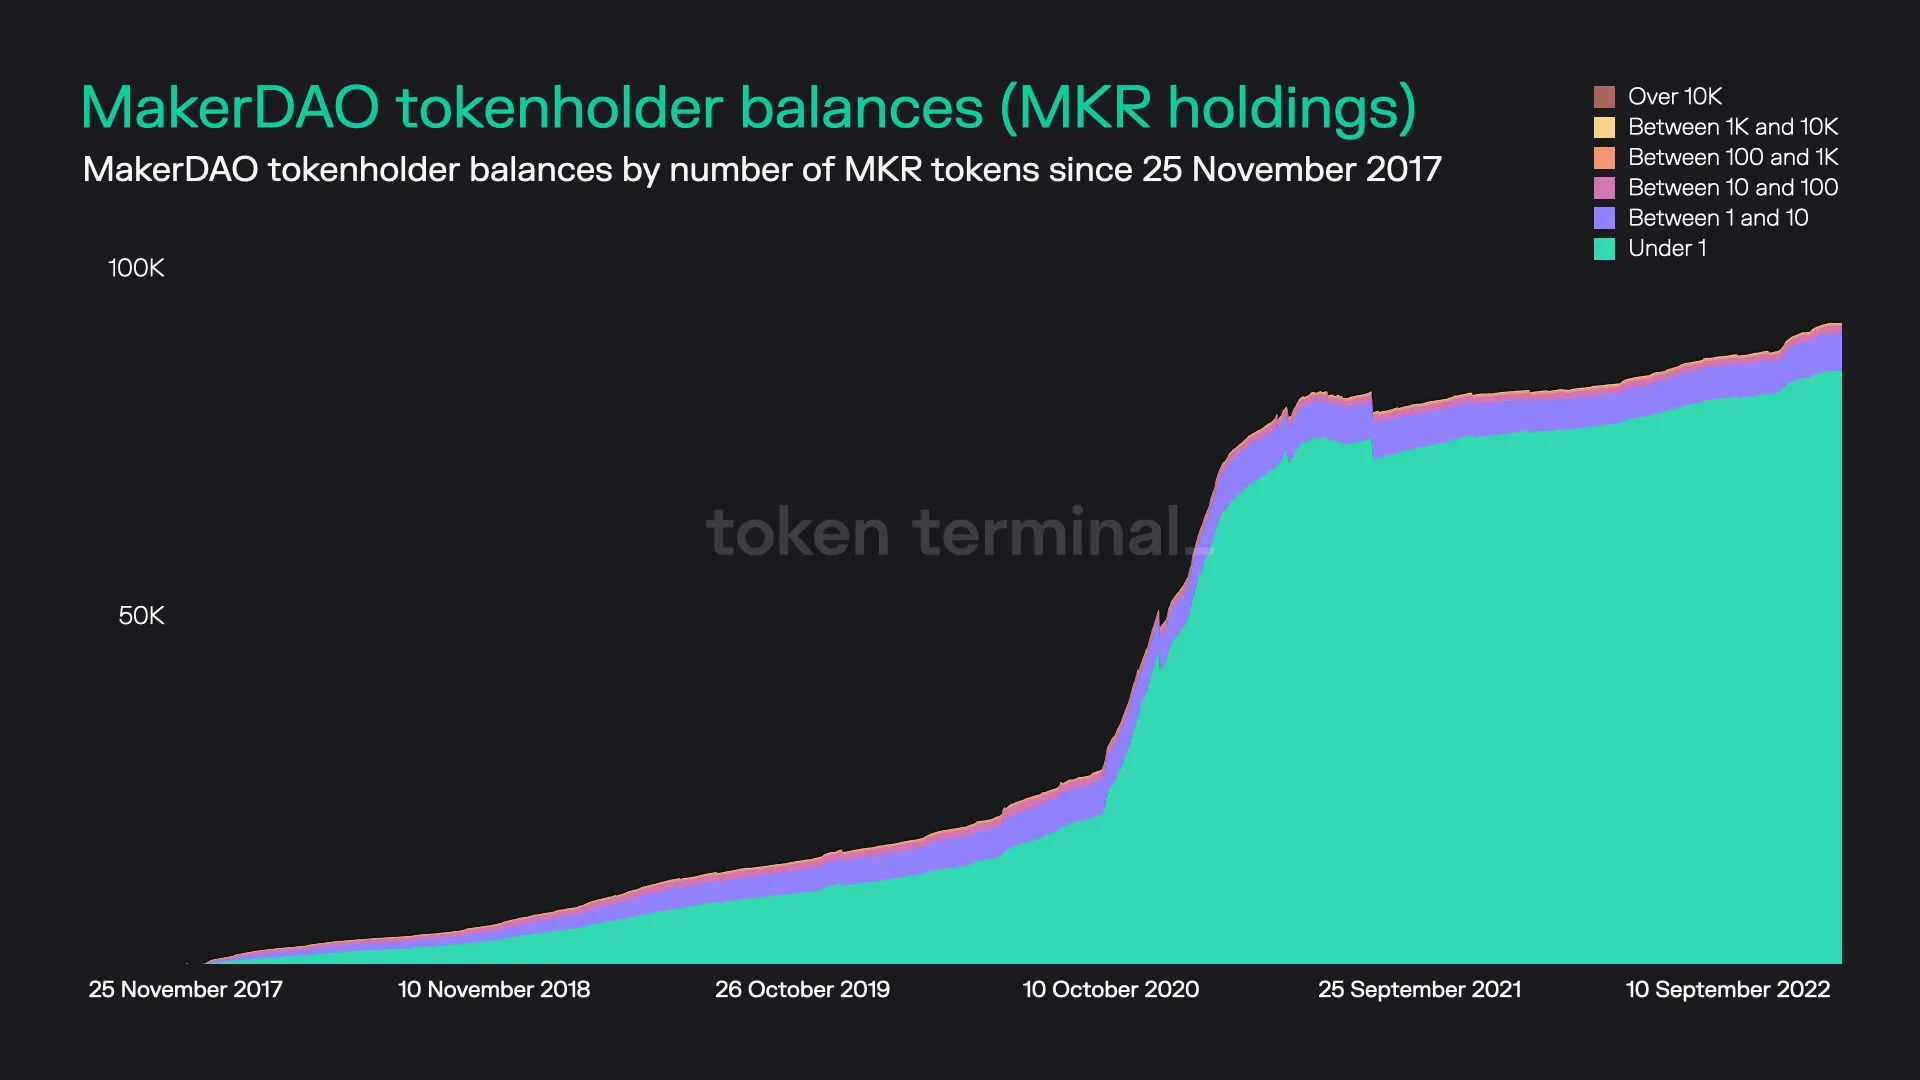
Key stats:
- Circulating market cap: $630.8M
- Total number of MKR holders: 92.6K
- Average dollar-value of MKR per tokenholder: $6.8K
- Percentage of MKR tokens held by the top 100 holders: 83.5%
MakerDAO dashboard: https://tokenterminal.com/explorer/projects/makerdao
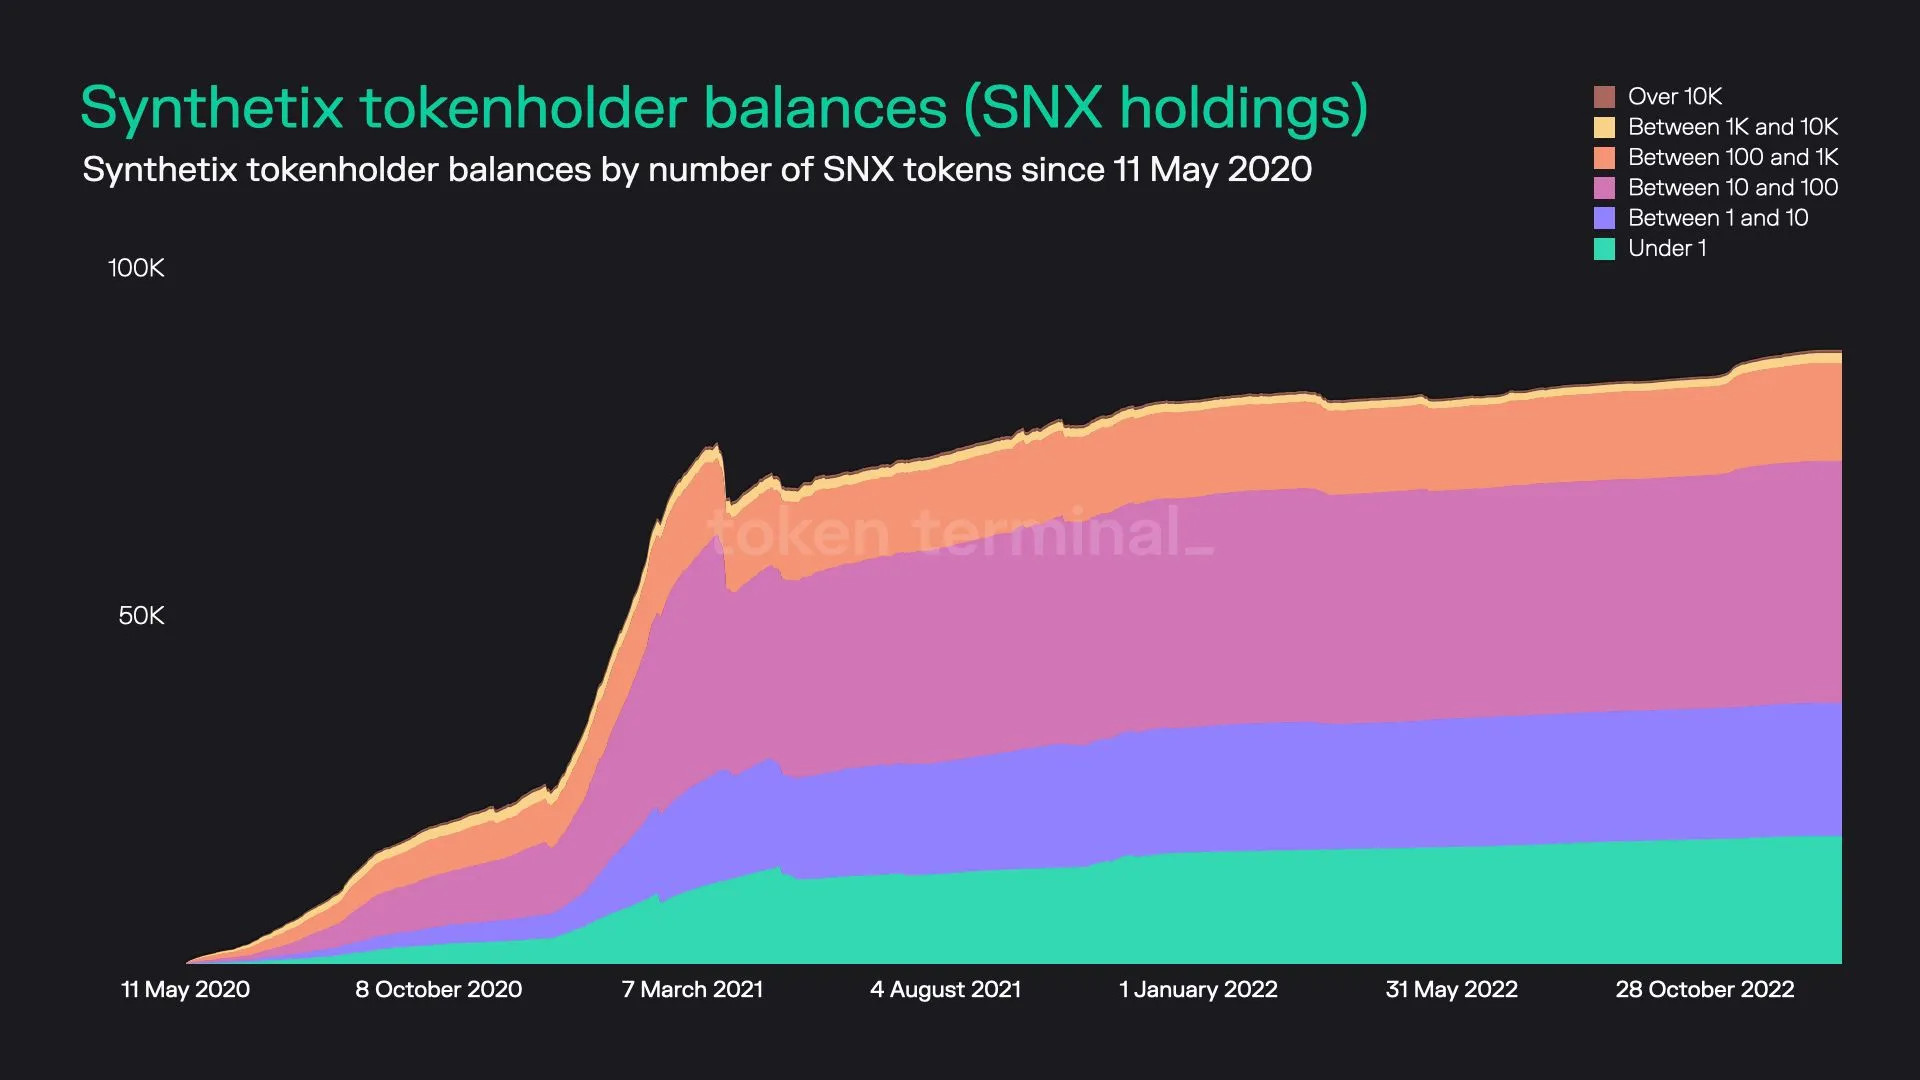
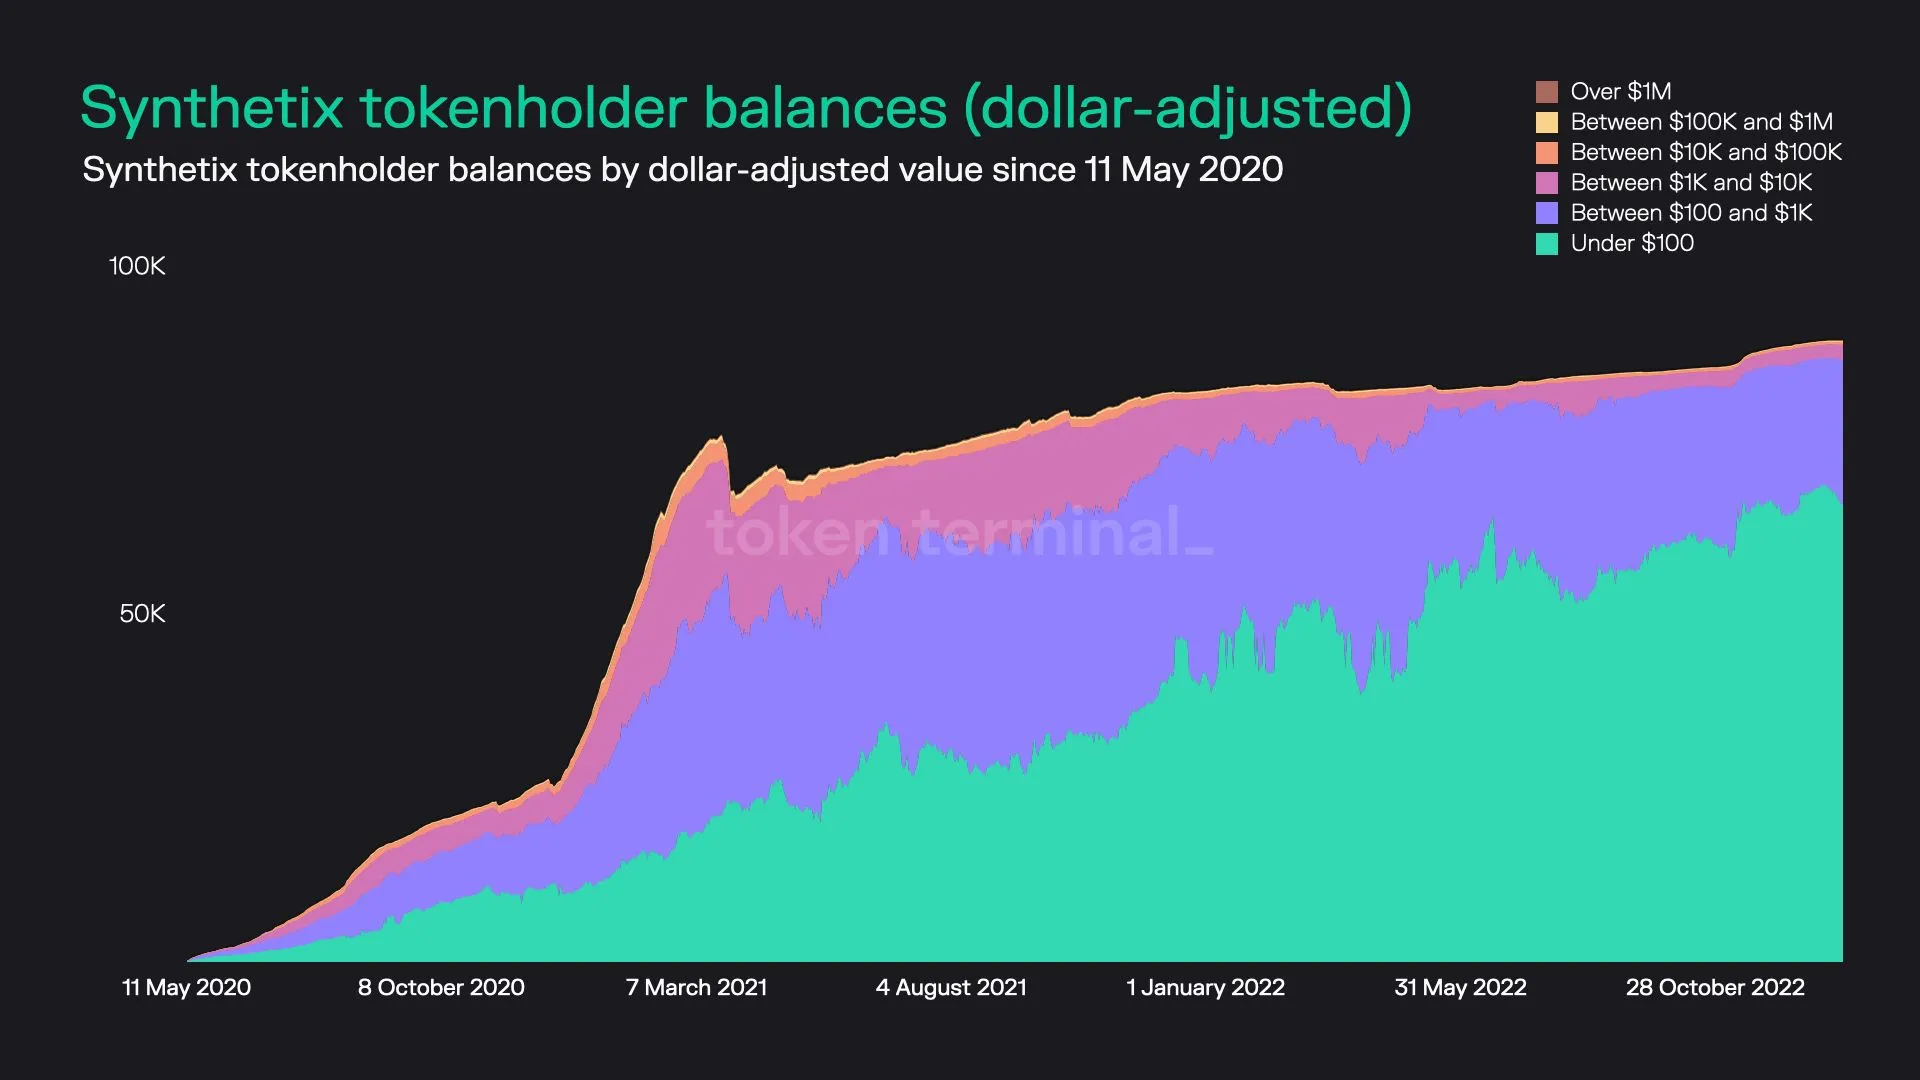
11. Synthetix (SNX)
Key stats:
- Circulating market cap: $522.1M
- Total number of SNX holders: 89.8K
- Average dollar-value of SNX per tokenholder: $5.8K
- Percentage of SNX tokens held by the top 100 holders: 90.8%
Synthetix dashboard: https://tokenterminal.com/explorer/projects/synthetix
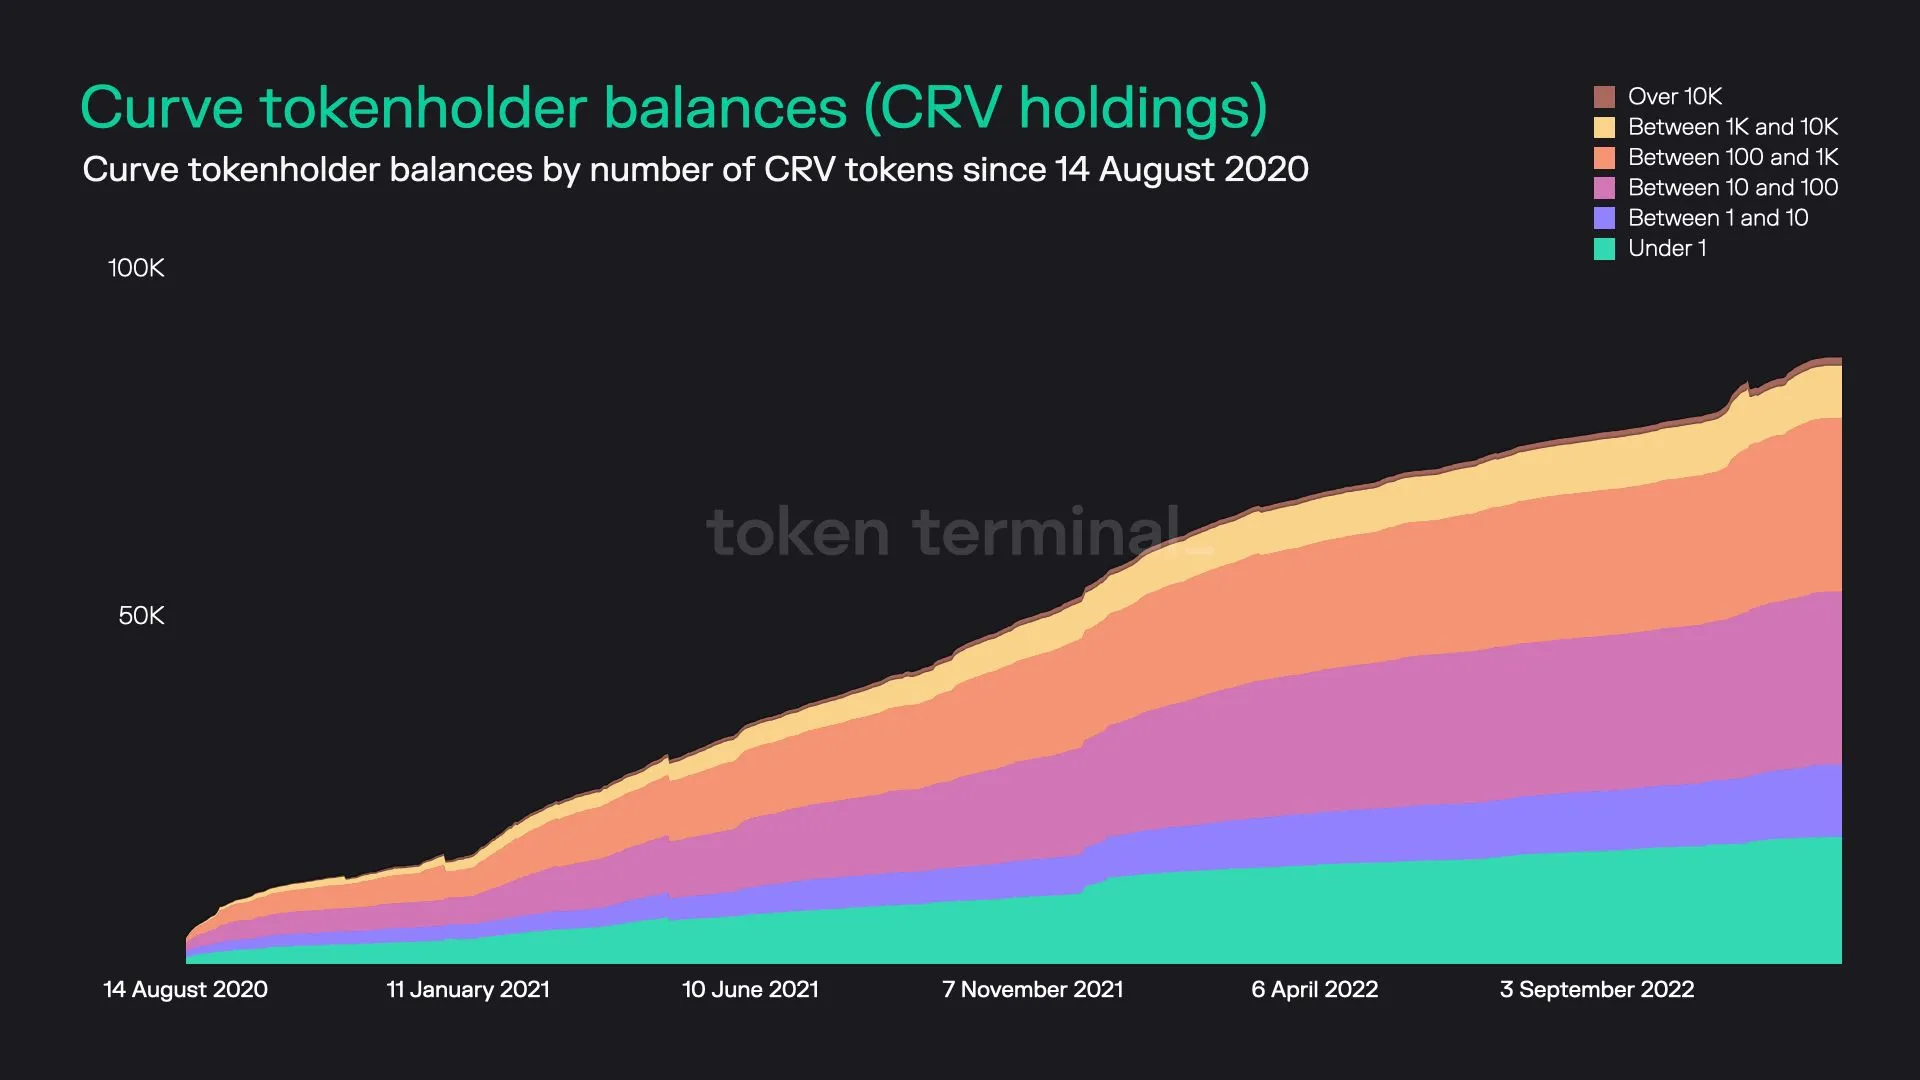
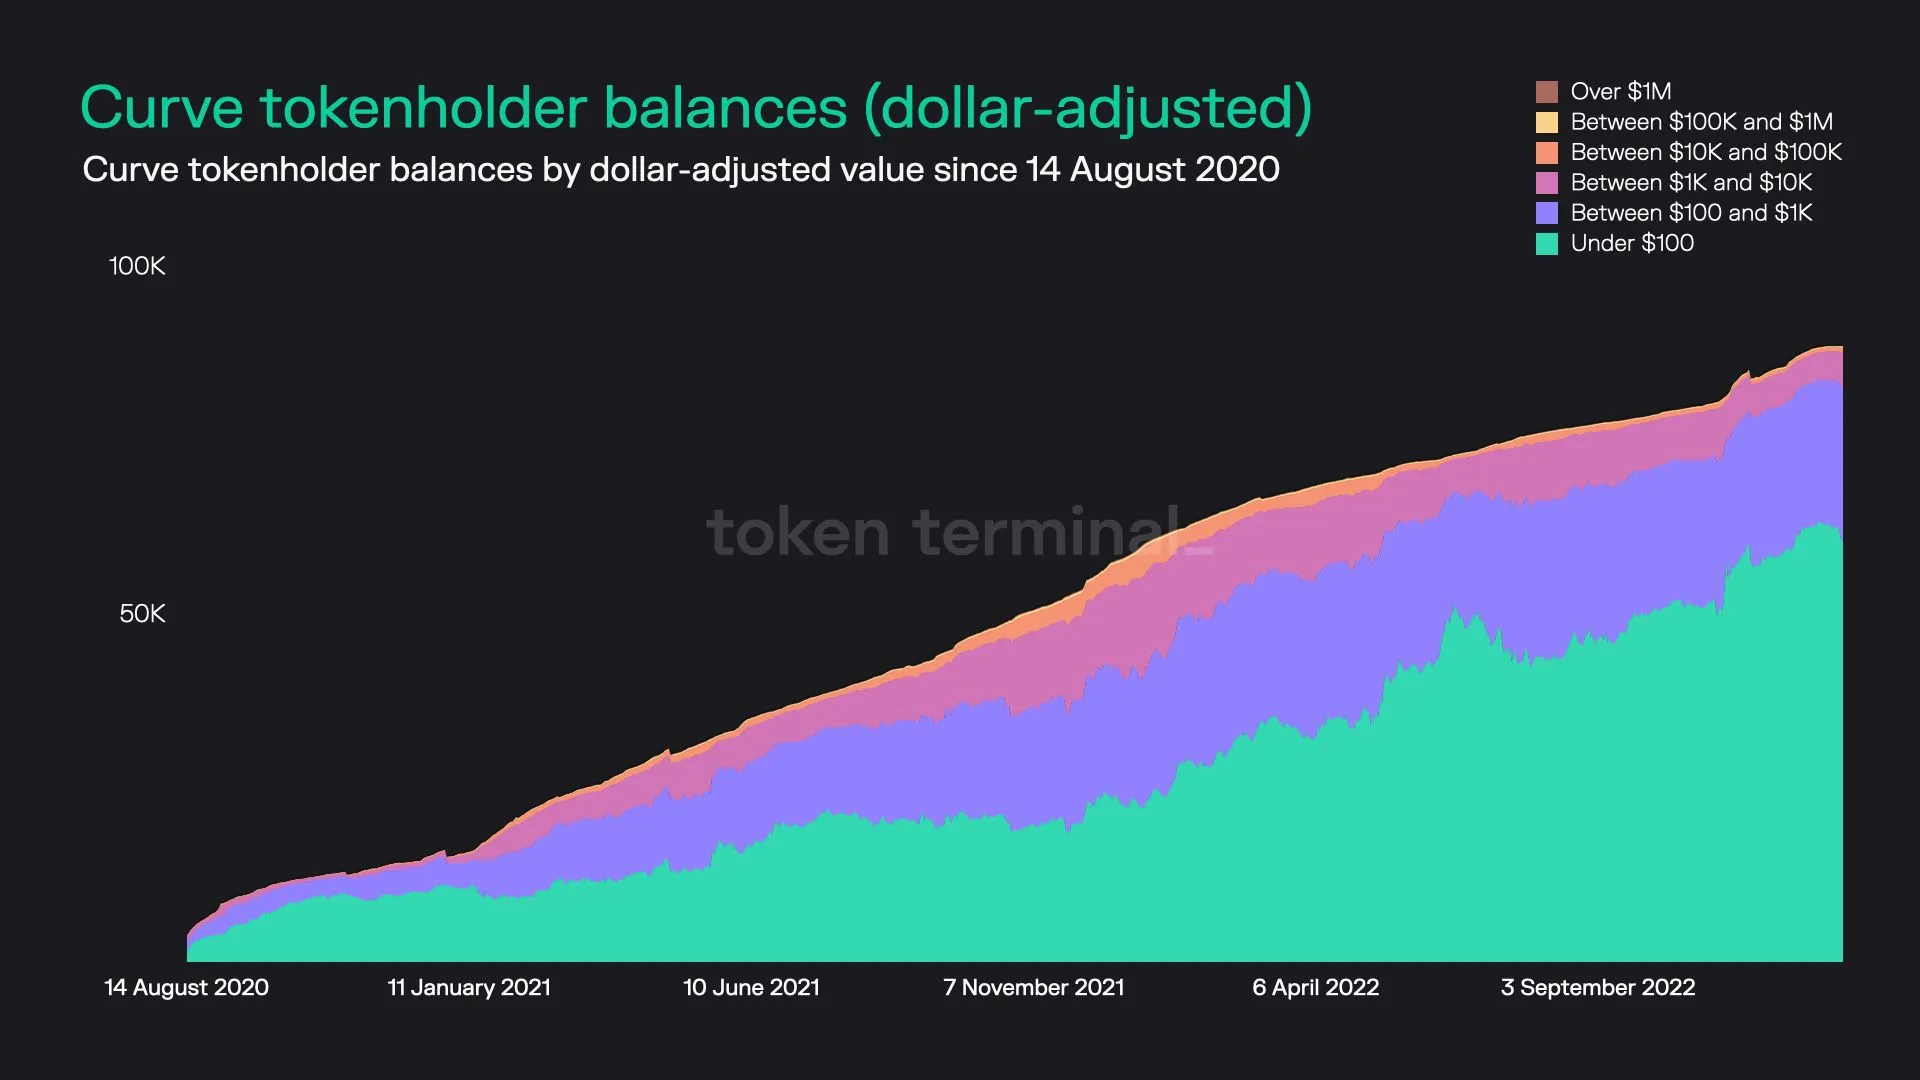
12. Curve (CRV)
Key stats:
- Circulating market cap: $540.6M
- Total number of CRV holders: 89.4K
- Average dollar-value of CRV per tokenholder: $6.0K
- Percentage of CRV tokens held by the top 100 holders: 94.7%
Curve dashboard: https://tokenterminal.com/explorer/projects/curve
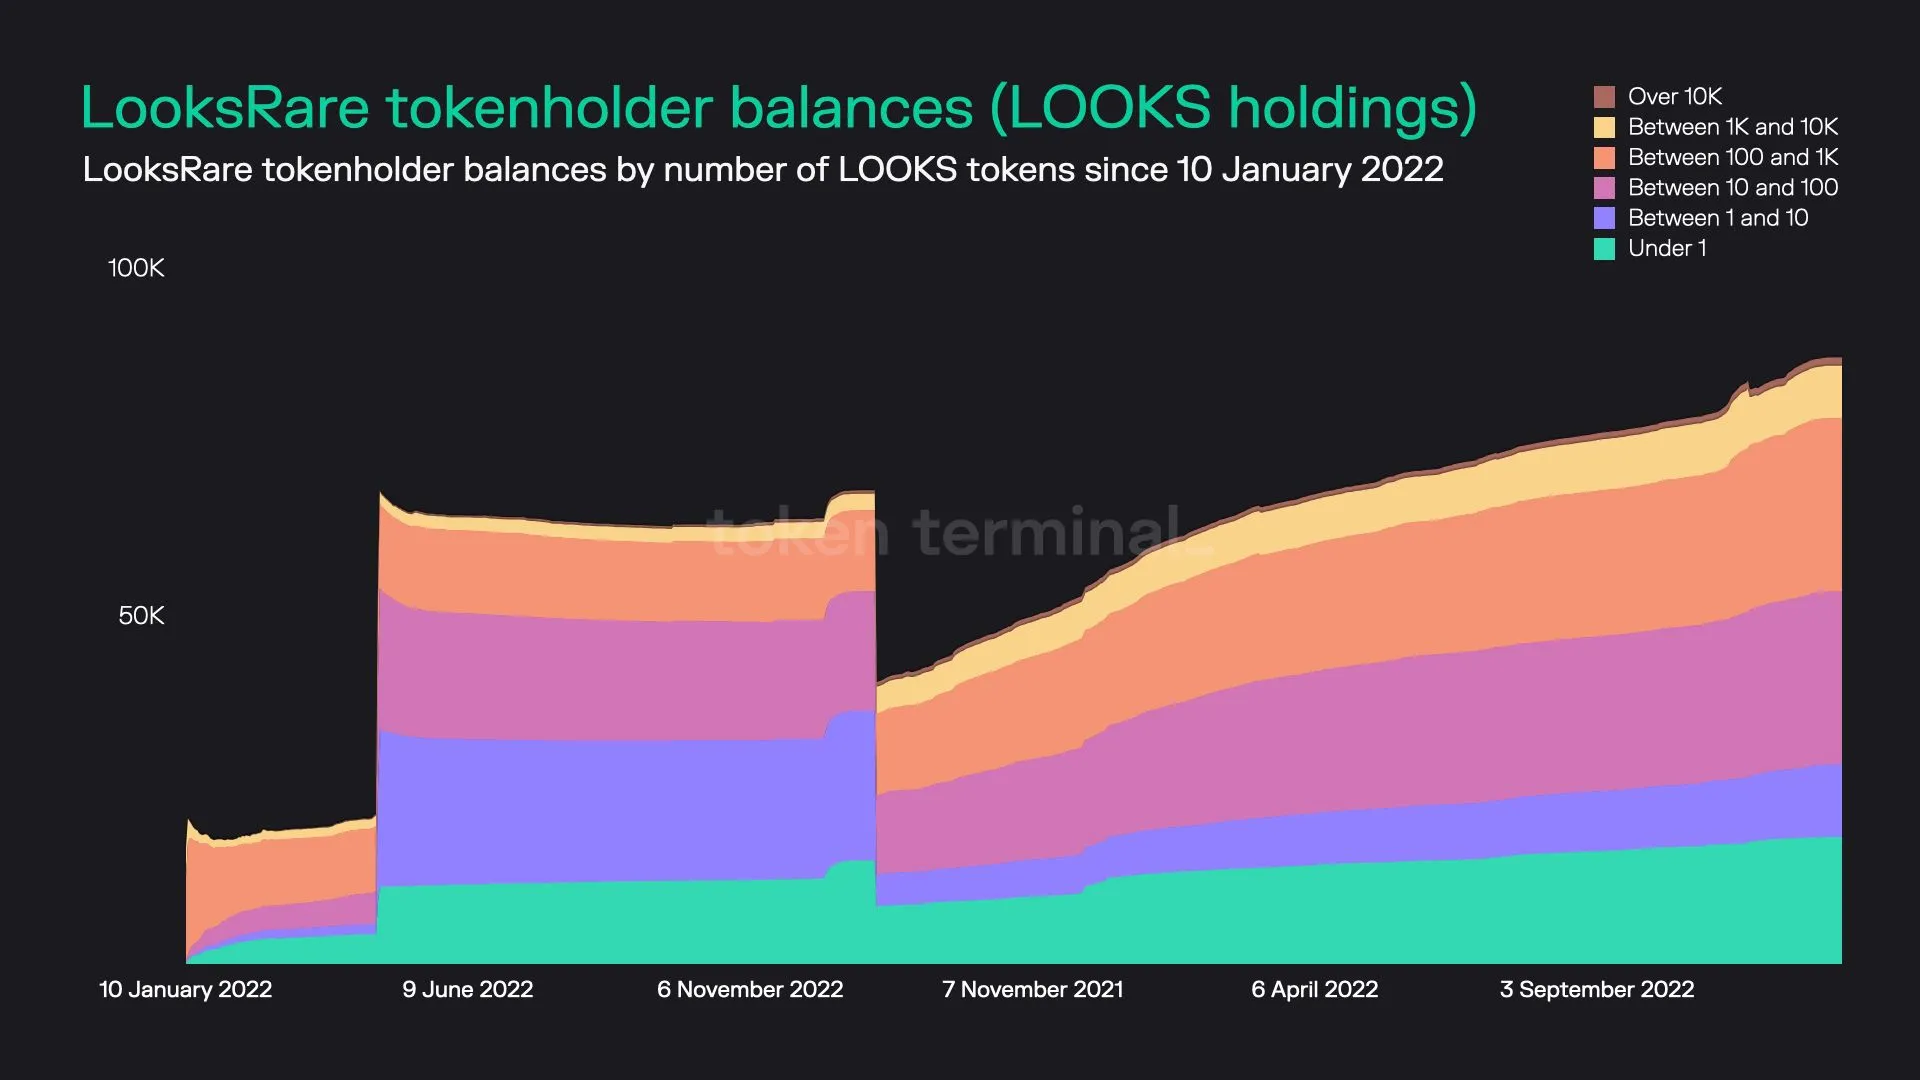
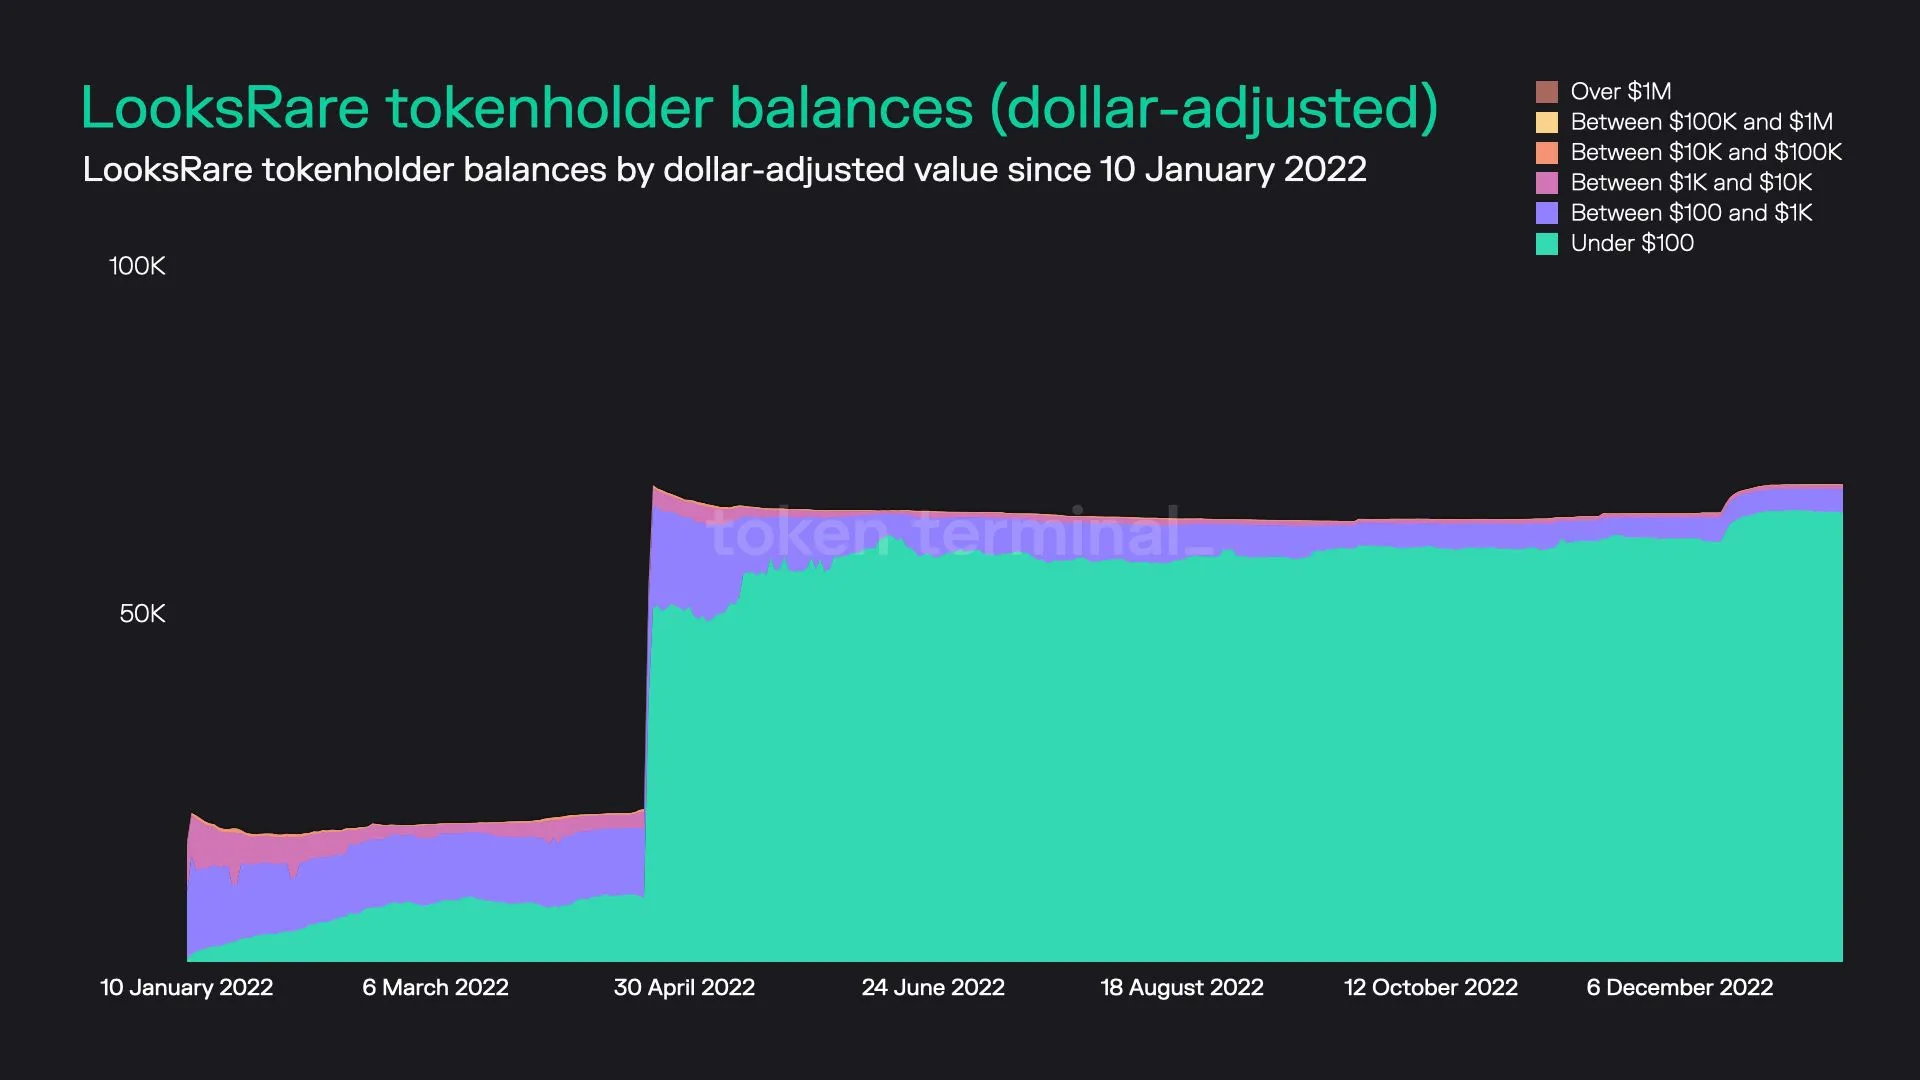
13. LooksRare (LOOKS)
Key stats:
- Circulating market cap: $540.6M
- Total number of LOOKS holders: 89.4K
- Average dollar-value of LOOKS per tokenholder: $6.0K
- Percentage of LOOKS tokens held by the top 100 holders: 97.3%
LooksRare dashboard: https://tokenterminal.com/explorer/projects/looksrare
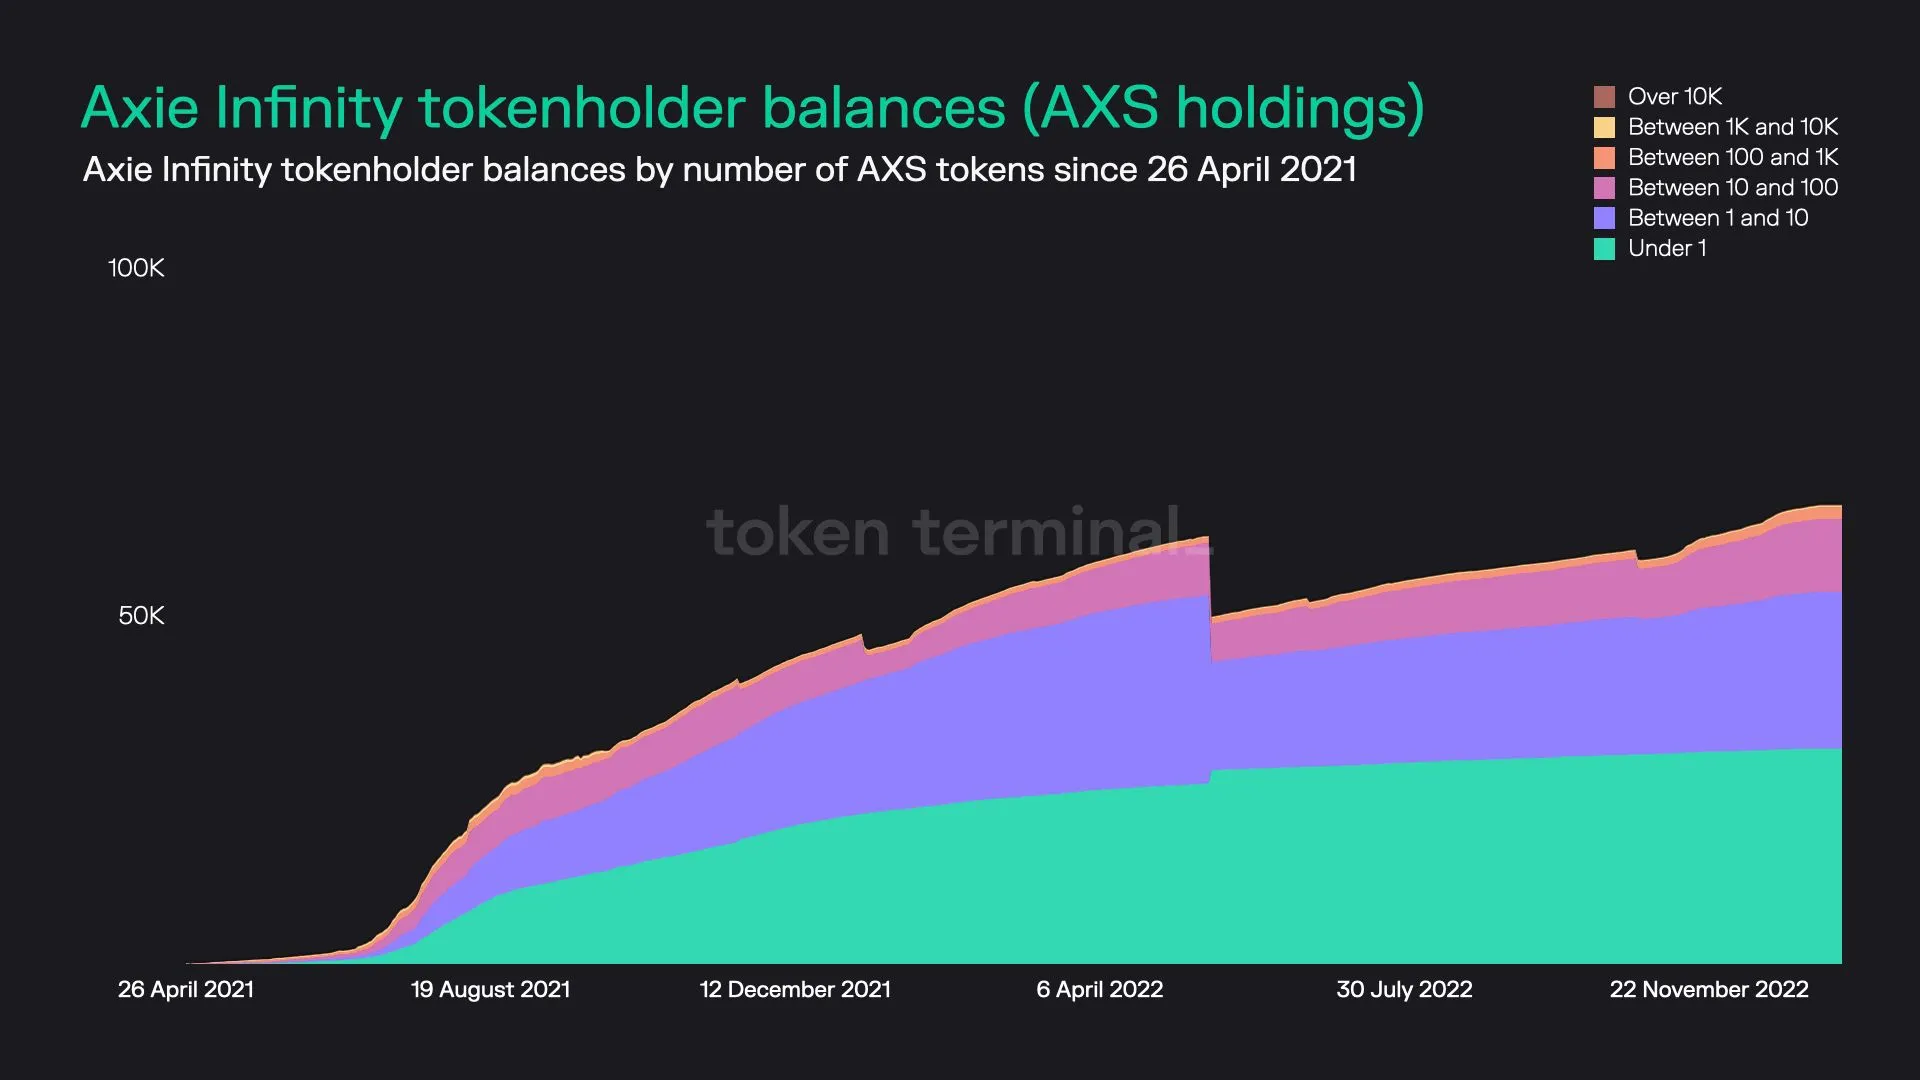
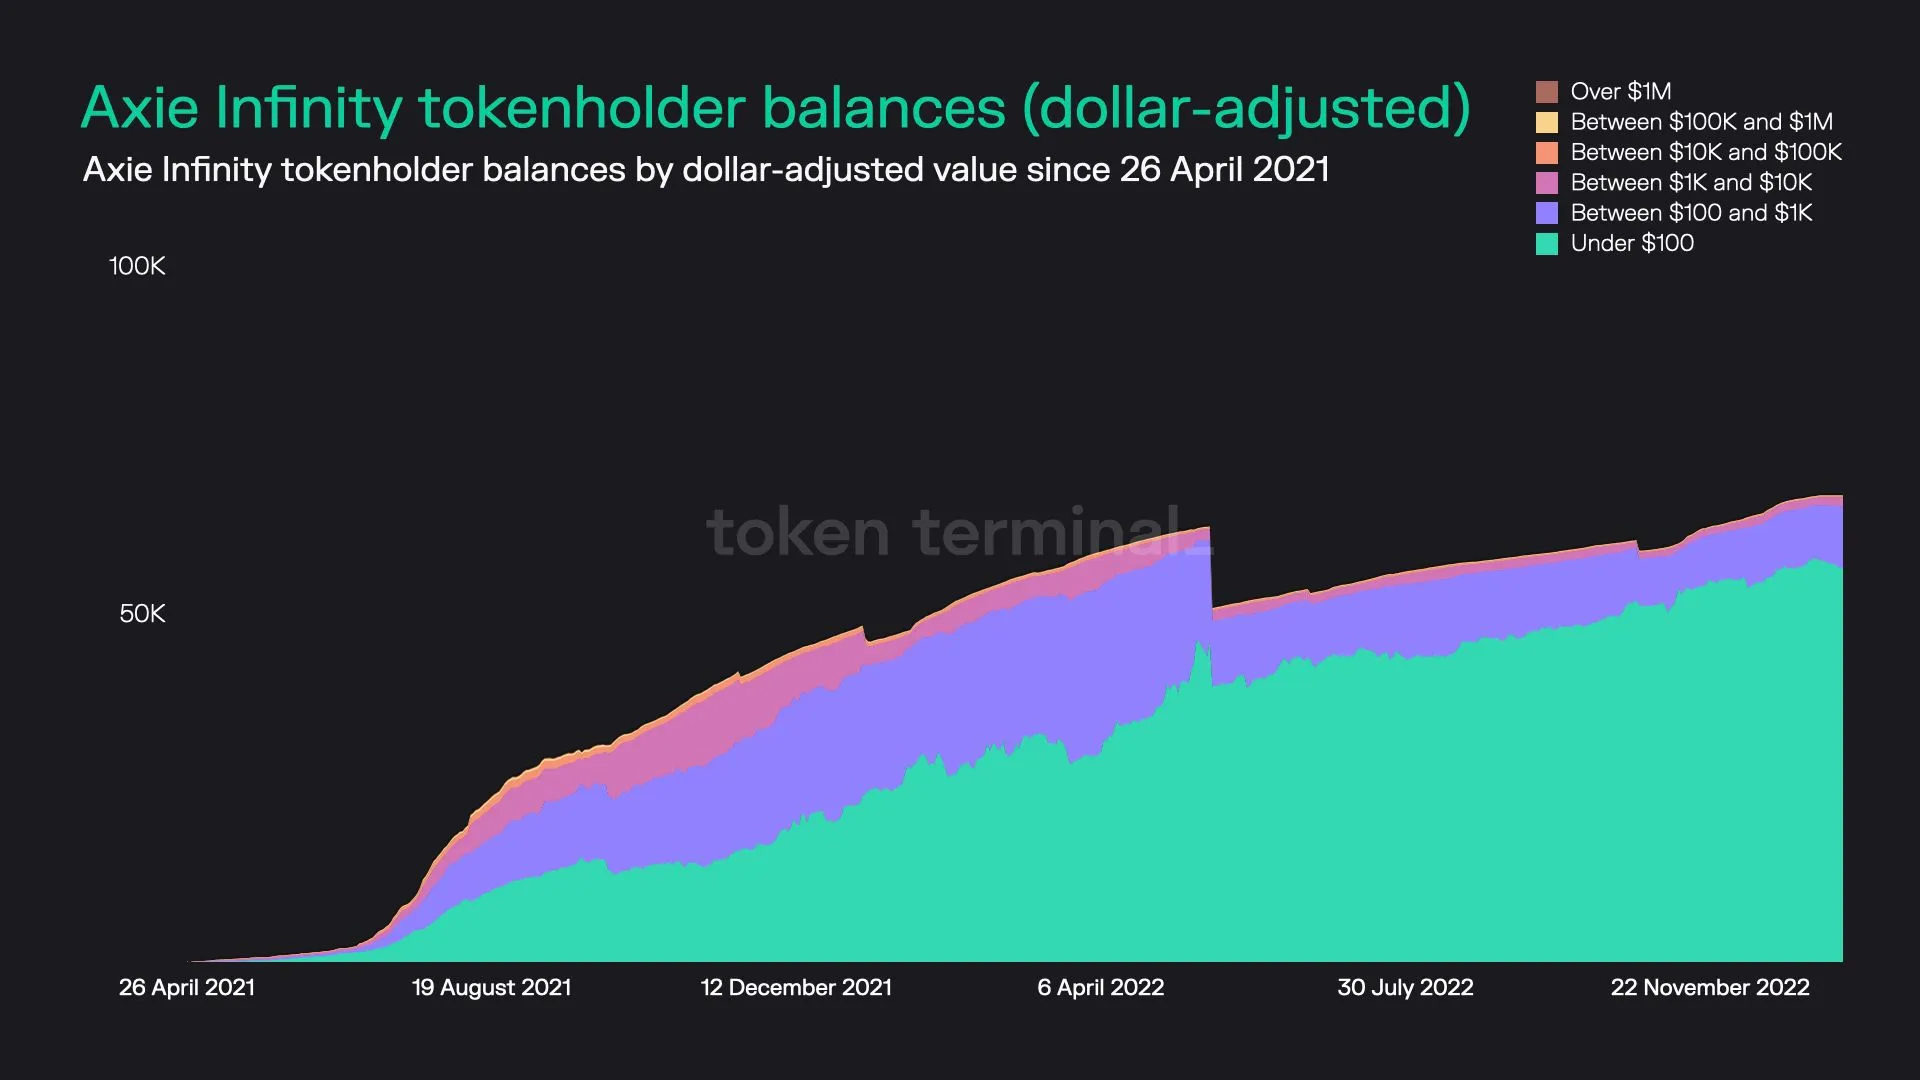
14. Axie Infinity (AXS)
Key stats:
- Circulating market cap: $1.1B
- Total number of AXS holders: 67.9K
- Average dollar-value of AXS per tokenholder: $15.7K
- Percentage of AXS tokens held by the top 100 holders: 99.3%
Axie Infinity dashboard: https://tokenterminal.com/explorer/projects/axie-infinity
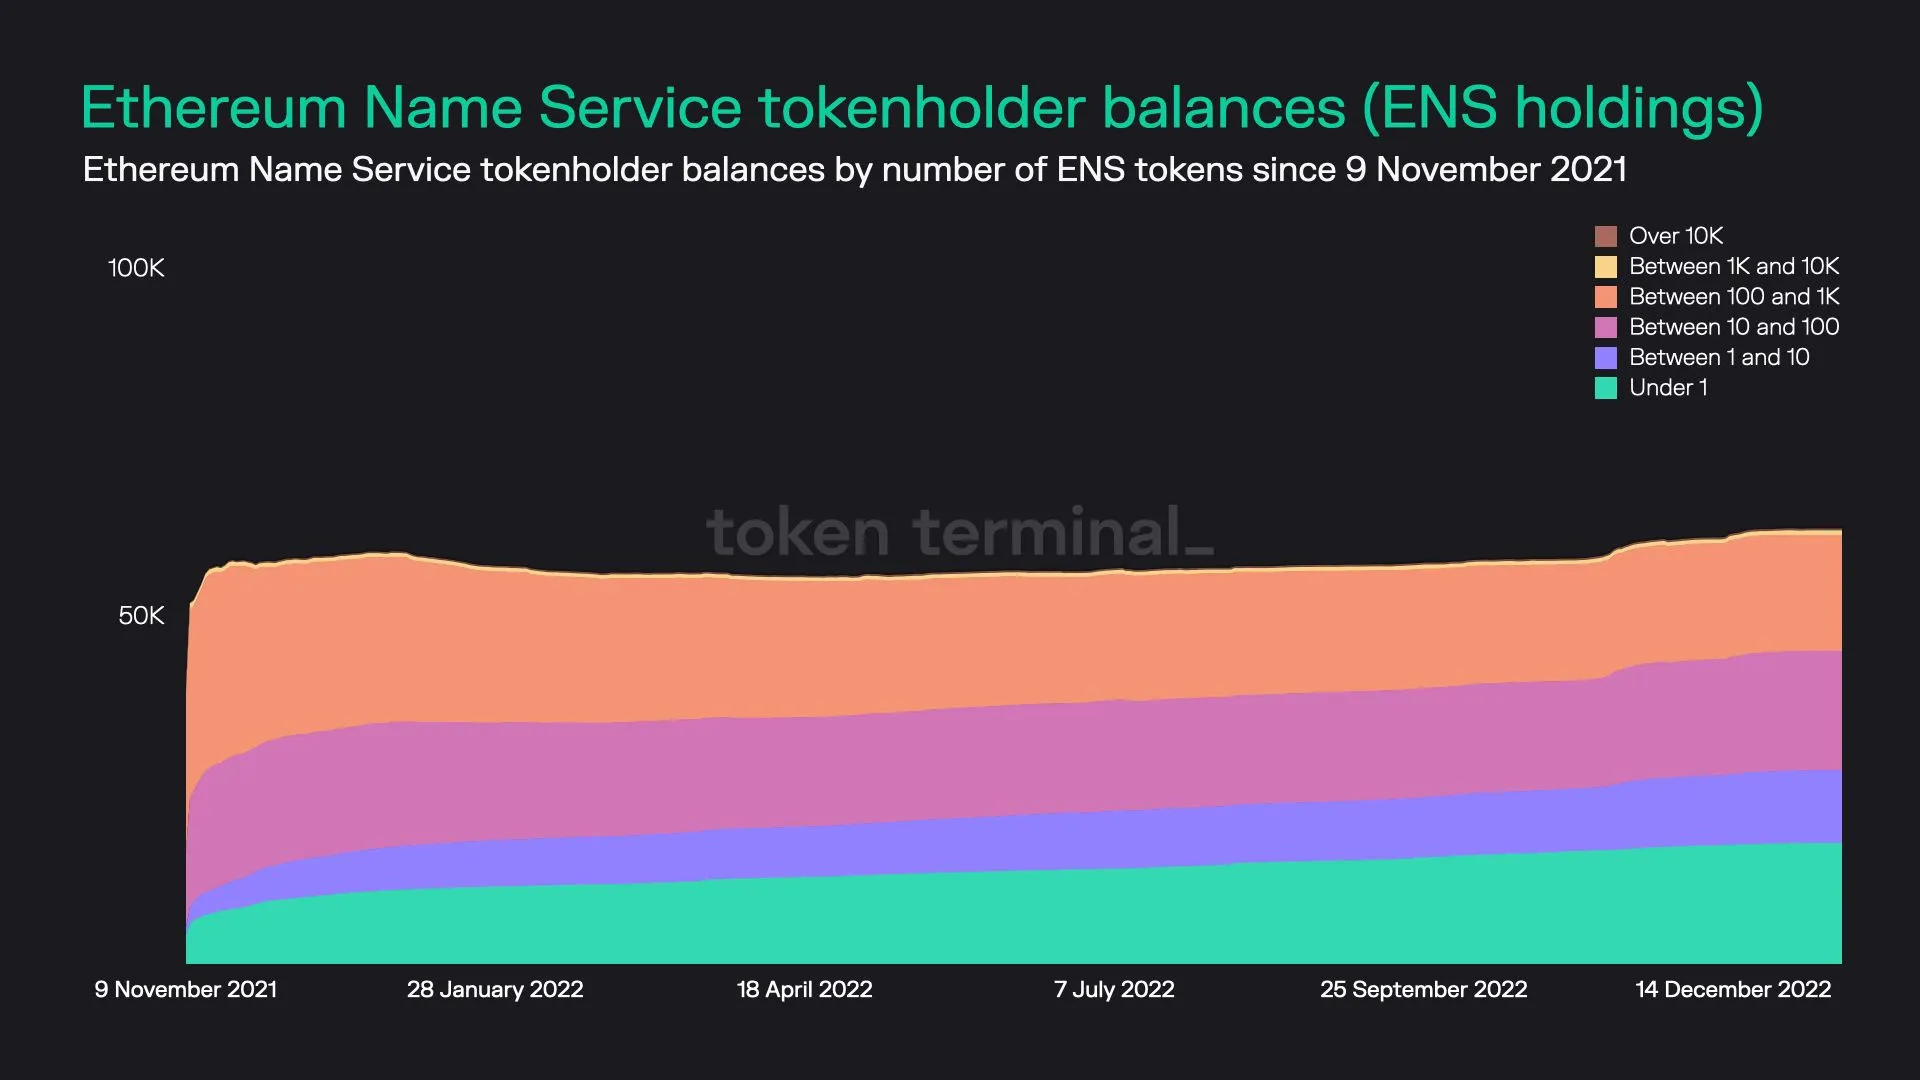
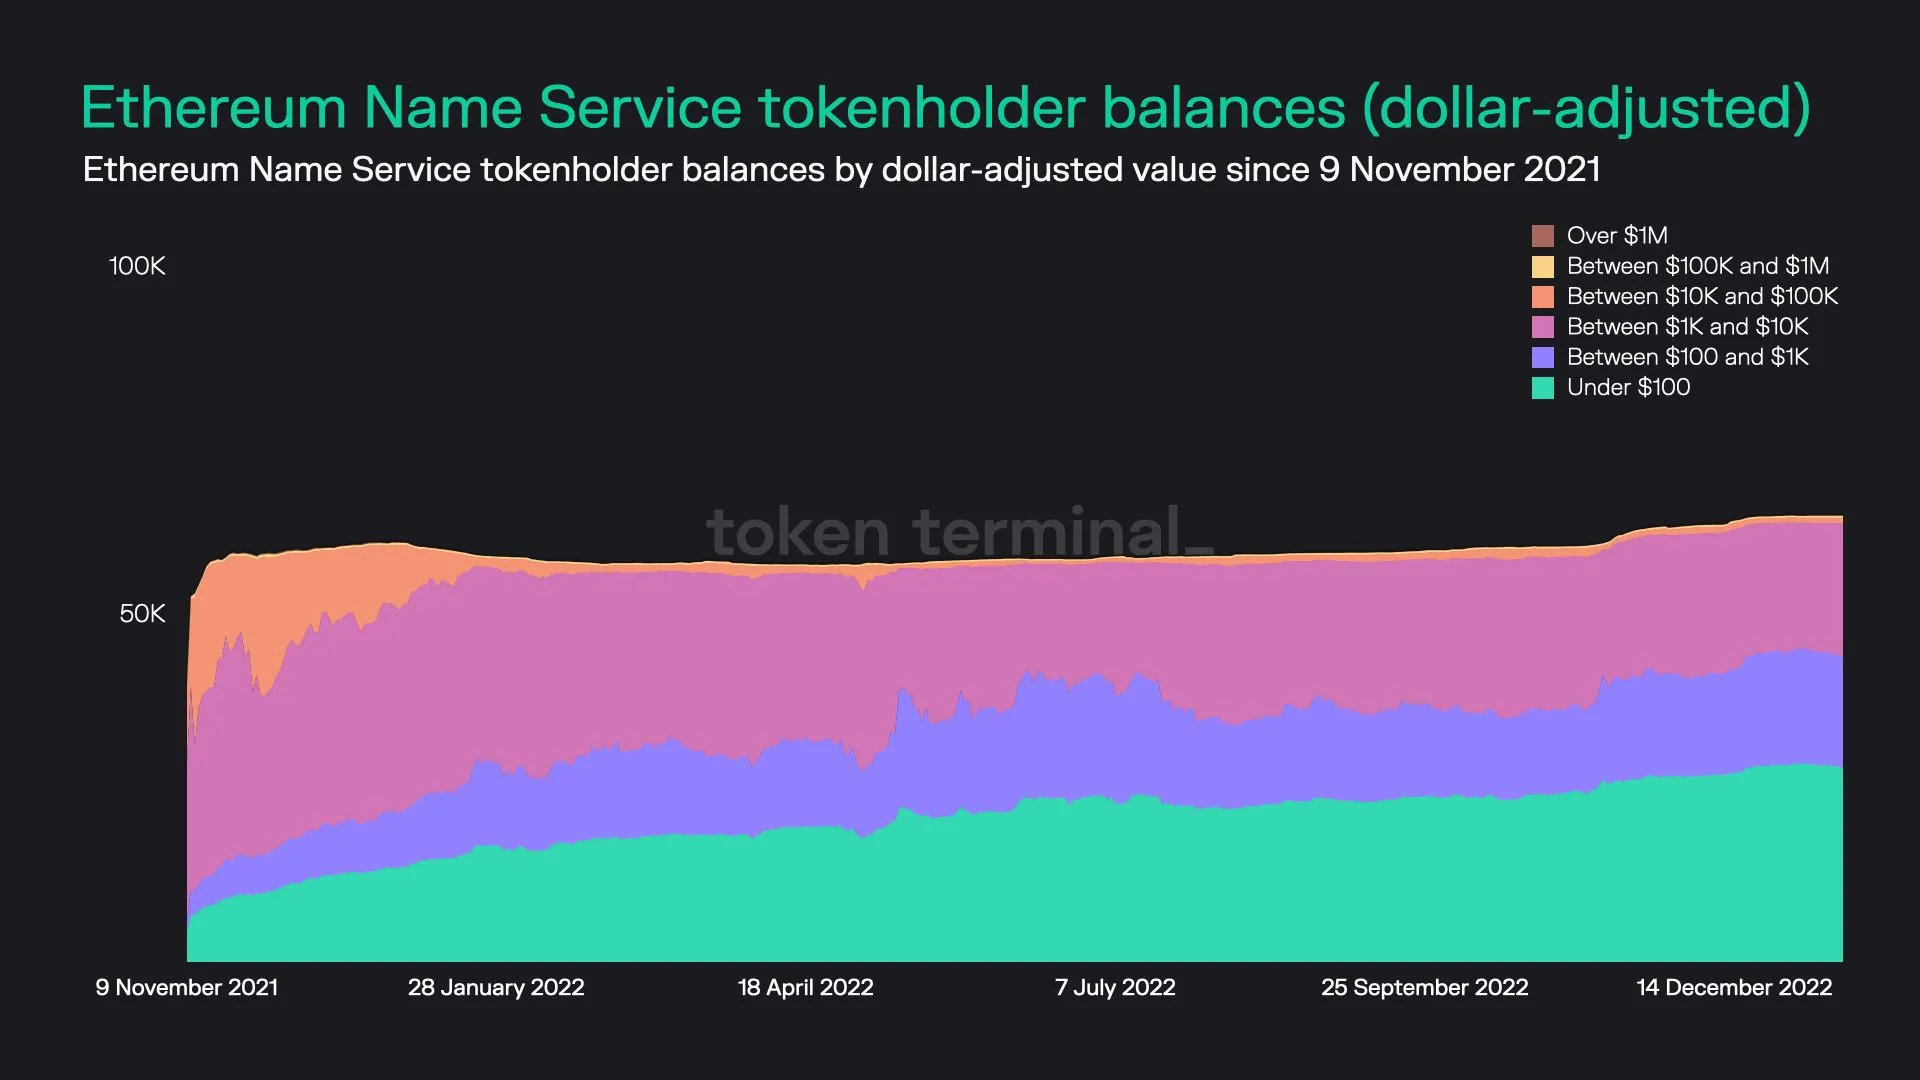
15. Ethereum Name Service (ENS)
Key stats:
- Circulating market cap: $361.0M
- Total number of ENS holders: 64.3K
- Average dollar-value of ENS per tokenholder: $5.6K
- Percentage of ENS tokens held by the top 100 holders: 89.9%
Ethereum Name Service dashboard: https://tokenterminal.com/explorer/projects/ethereum-name-service
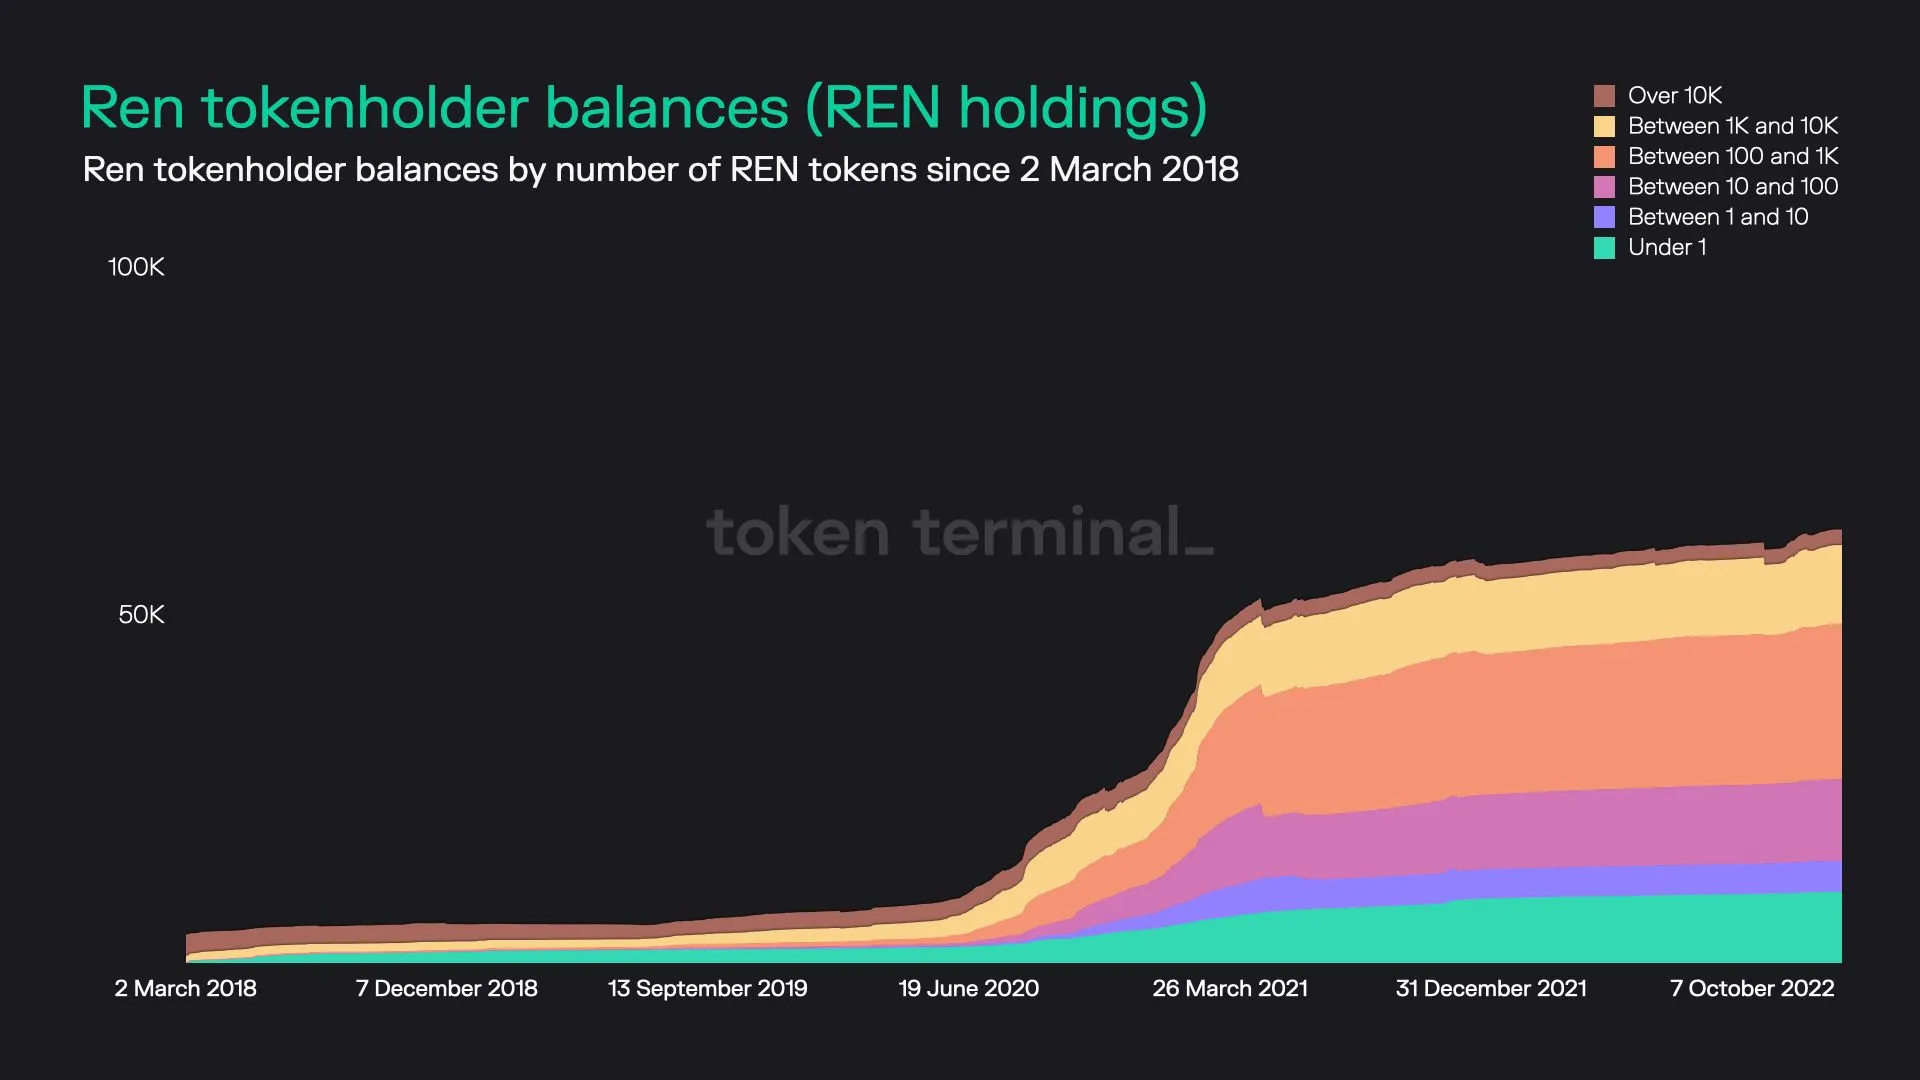
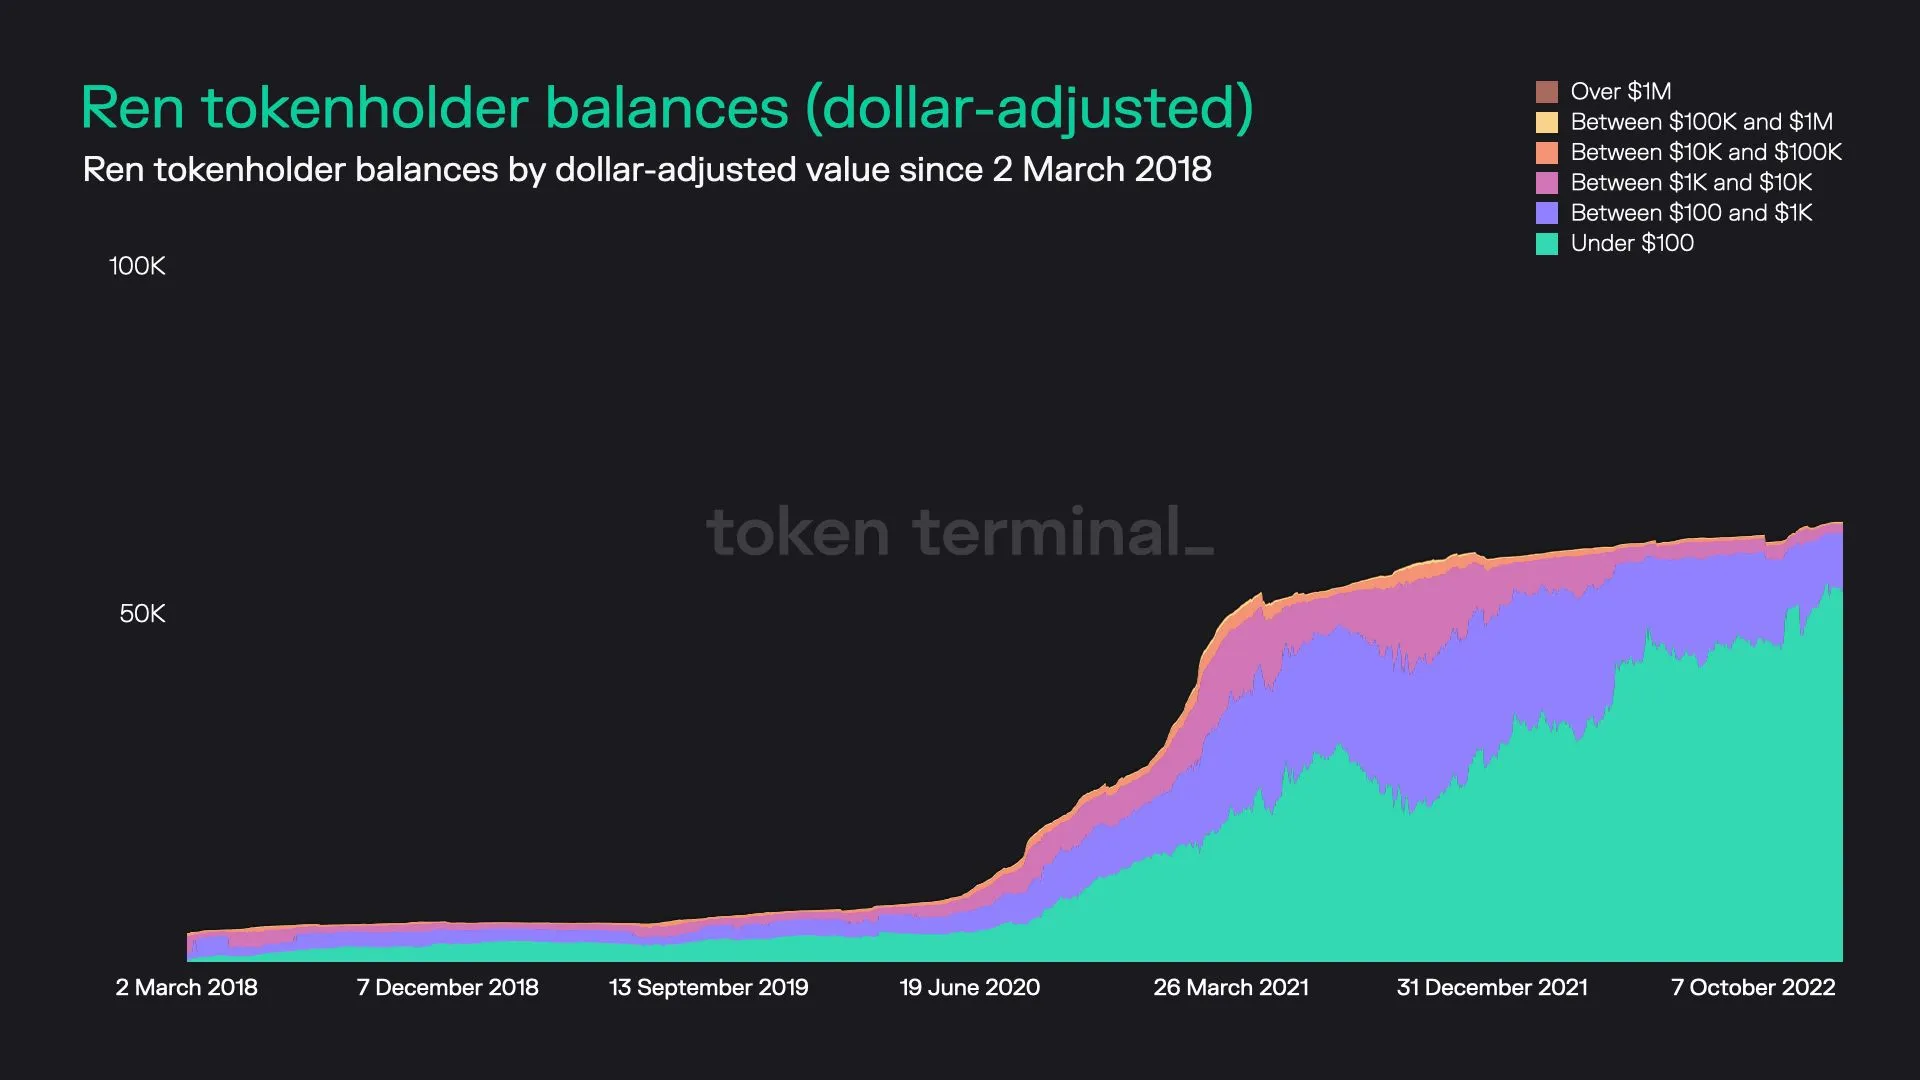
16. Ren (REN)
Key stats:
- Circulating market cap: $82.1M
- Total number of REN holders: 63.3K
- Average dollar-value of REN per tokenholder: $1.3K
- Percentage of REN tokens held by the top 100 holders: 83.9%
Ren dashboard: https://tokenterminal.com/explorer/projects/ren
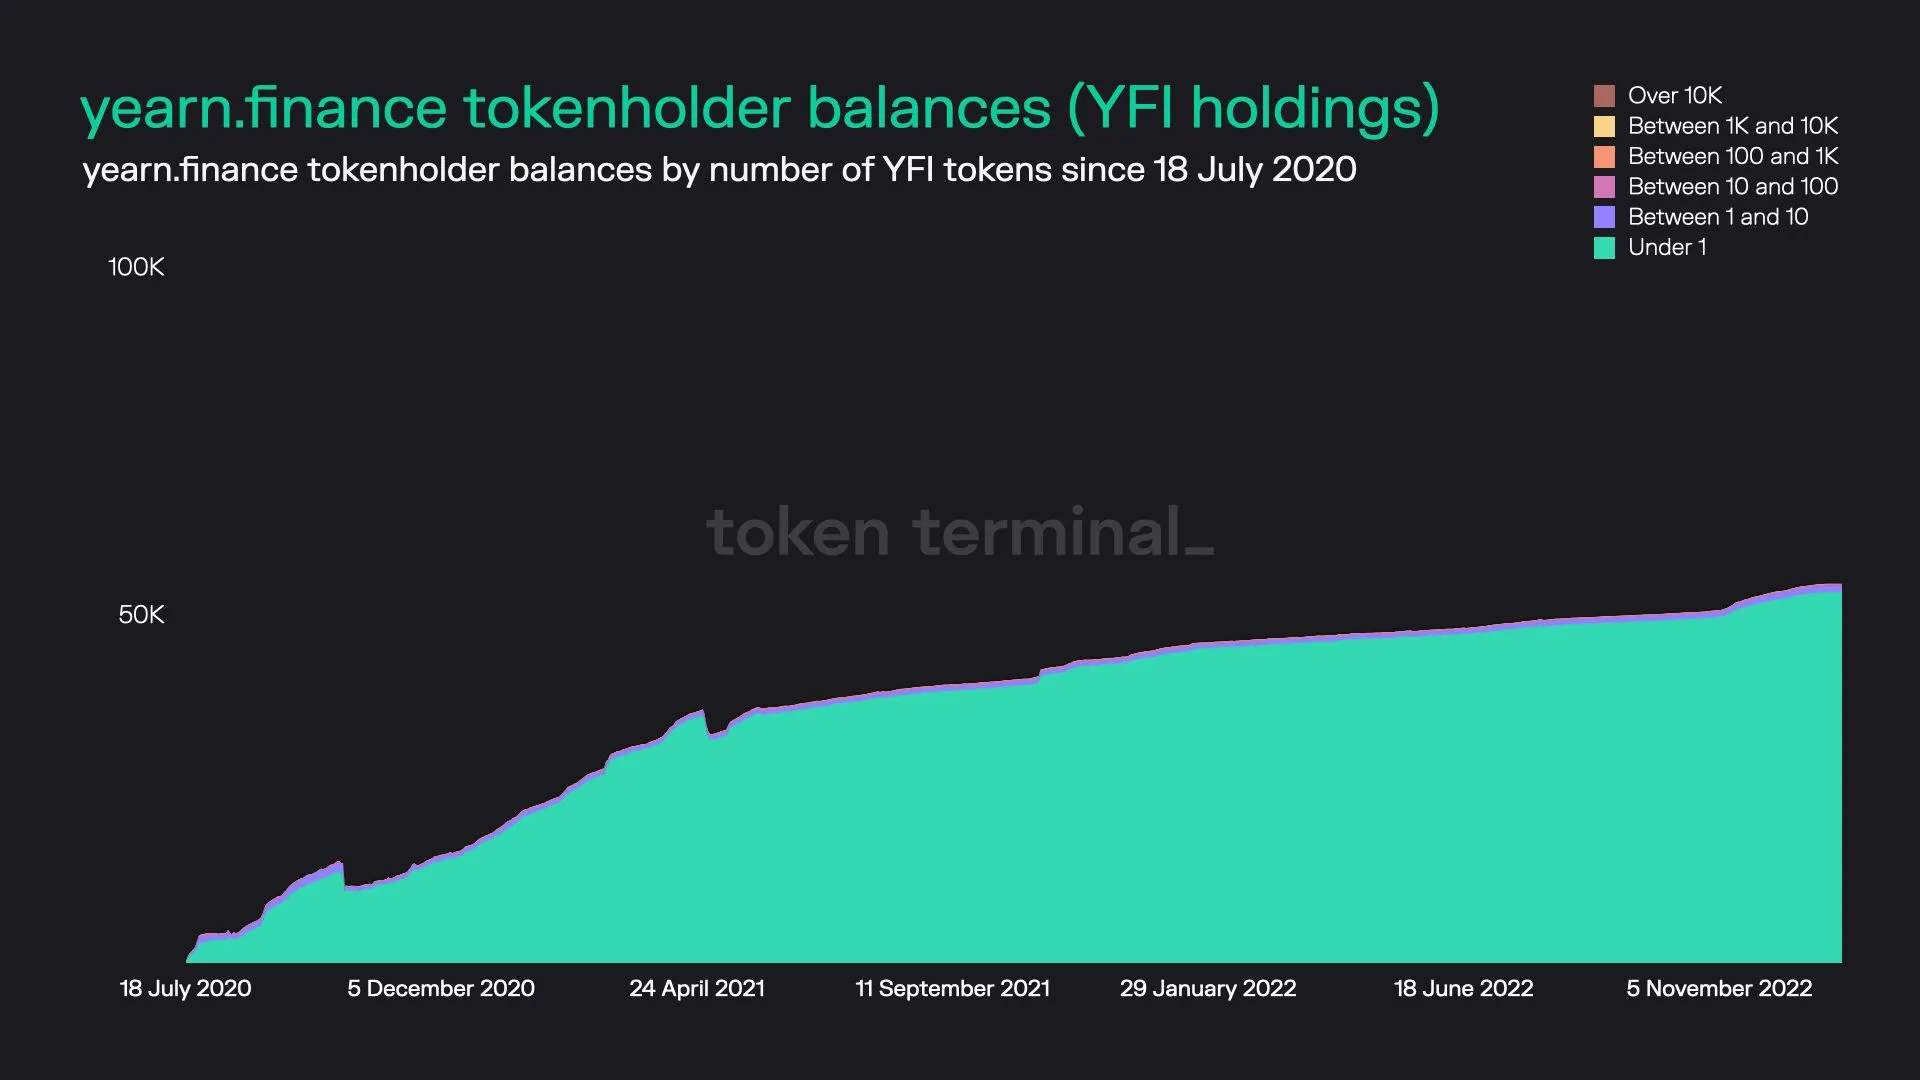
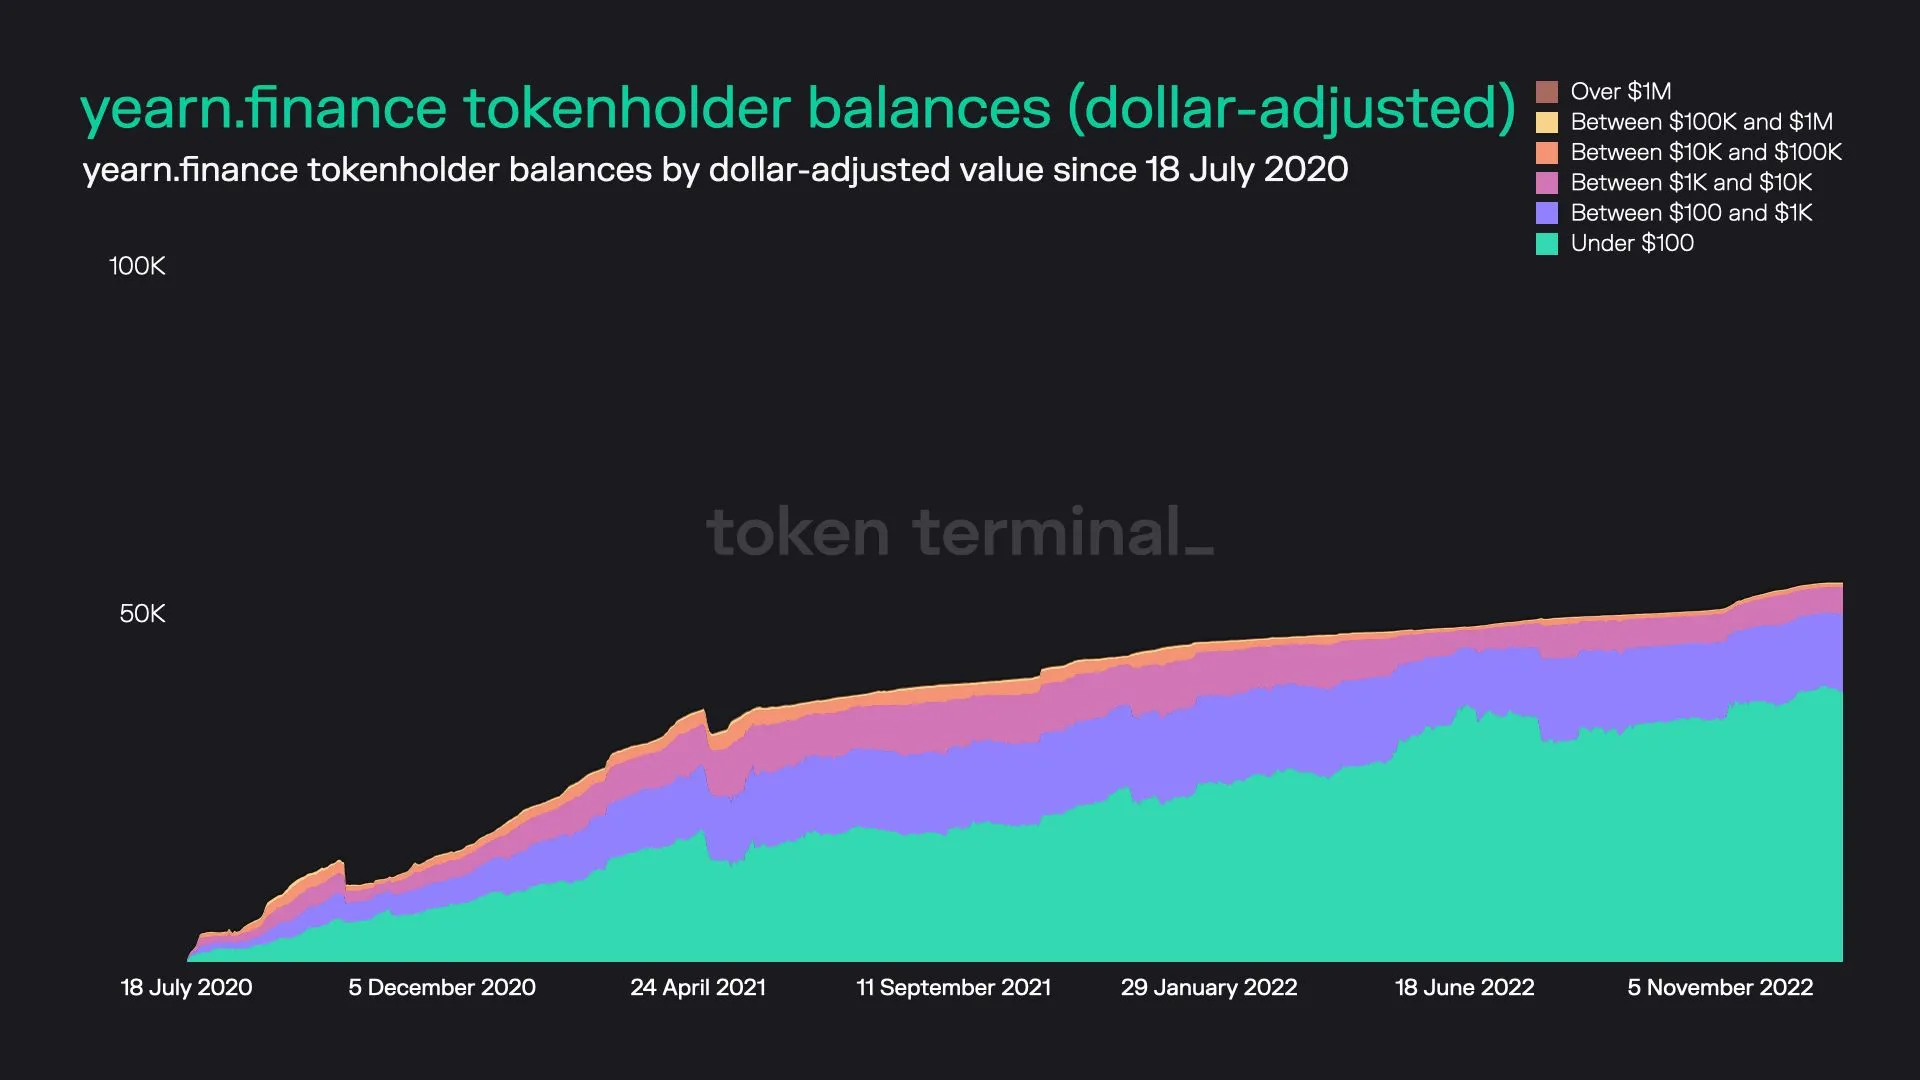
17. yearn.finance (YFI)
Key stats:
- Circulating market cap: $231.9M
- Total number of YFI holders: 54.8K
- Average dollar-value of YFI per tokenholder: $4.2K
- Percentage of YFI tokens held by the top 100 holders: 81.5%
yearn.finance dashboard: https://tokenterminal.com/explorer/projects/yearn-finance
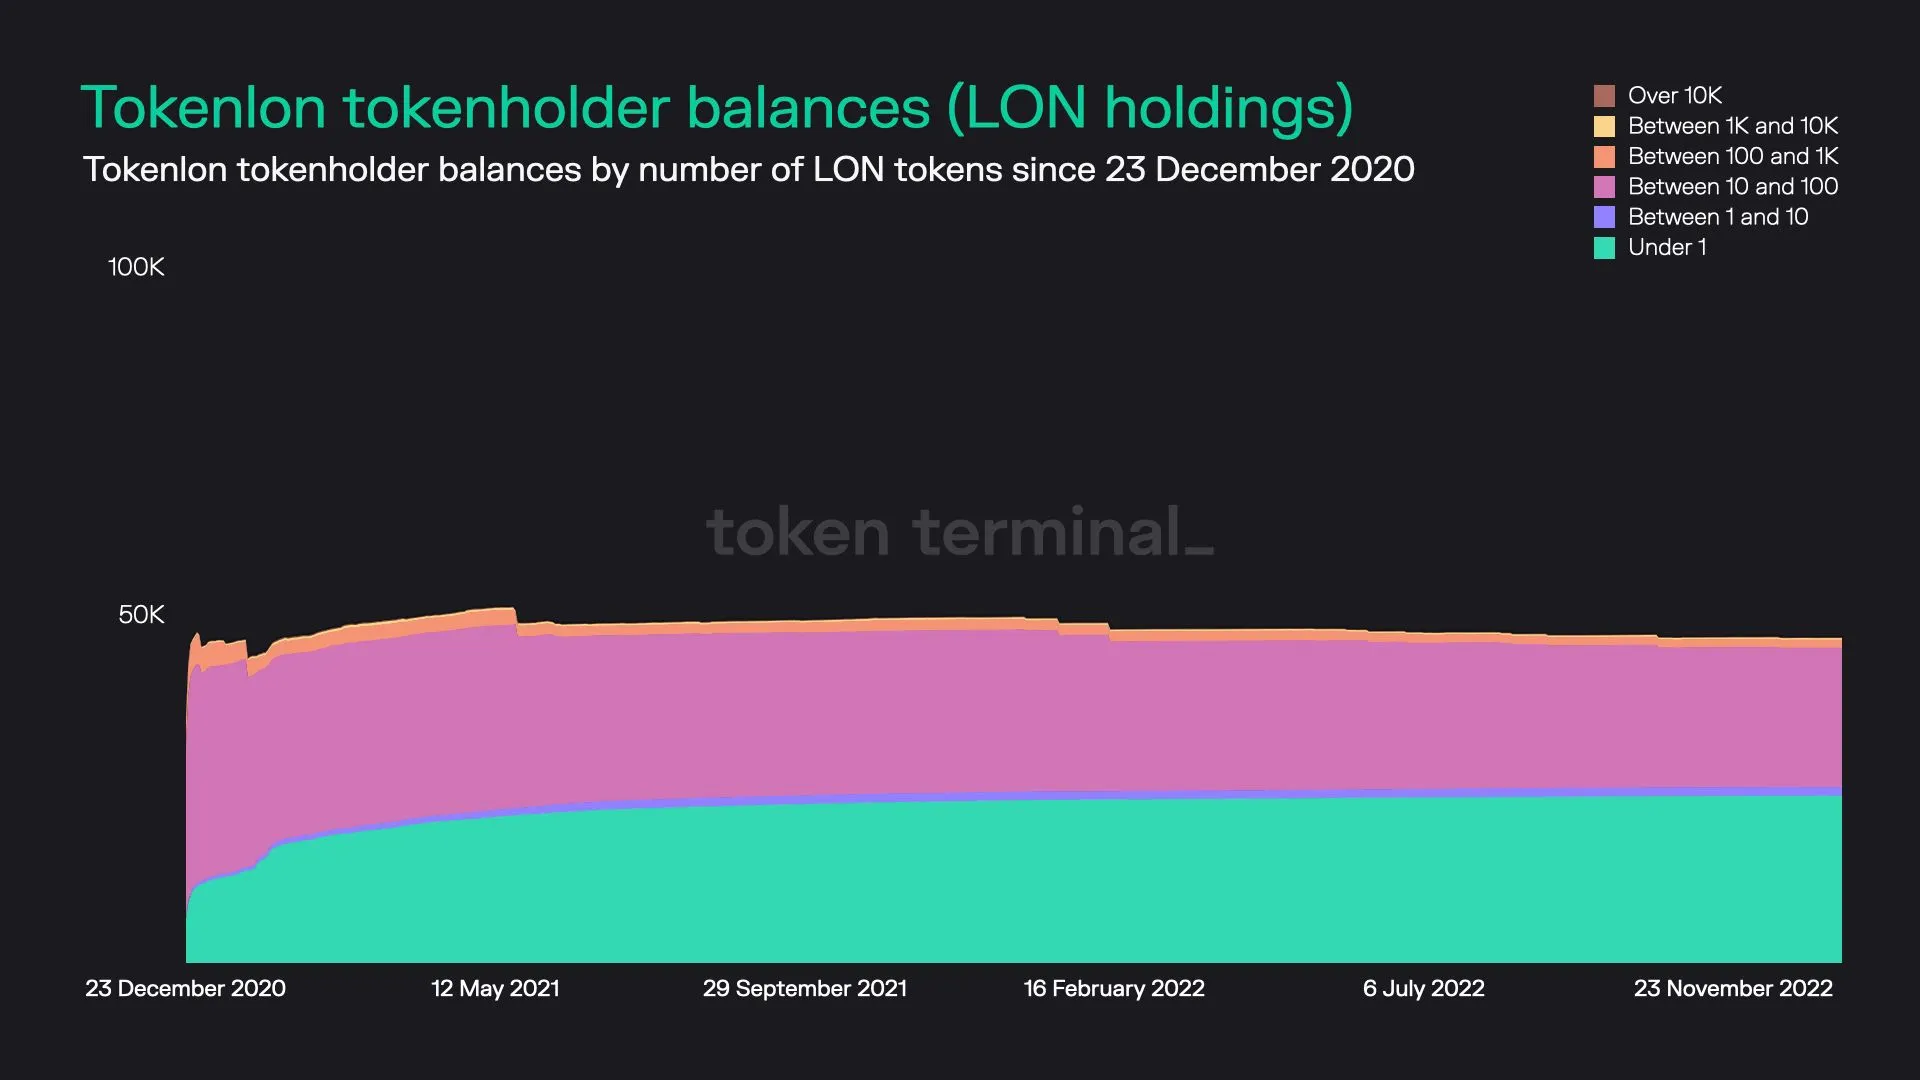
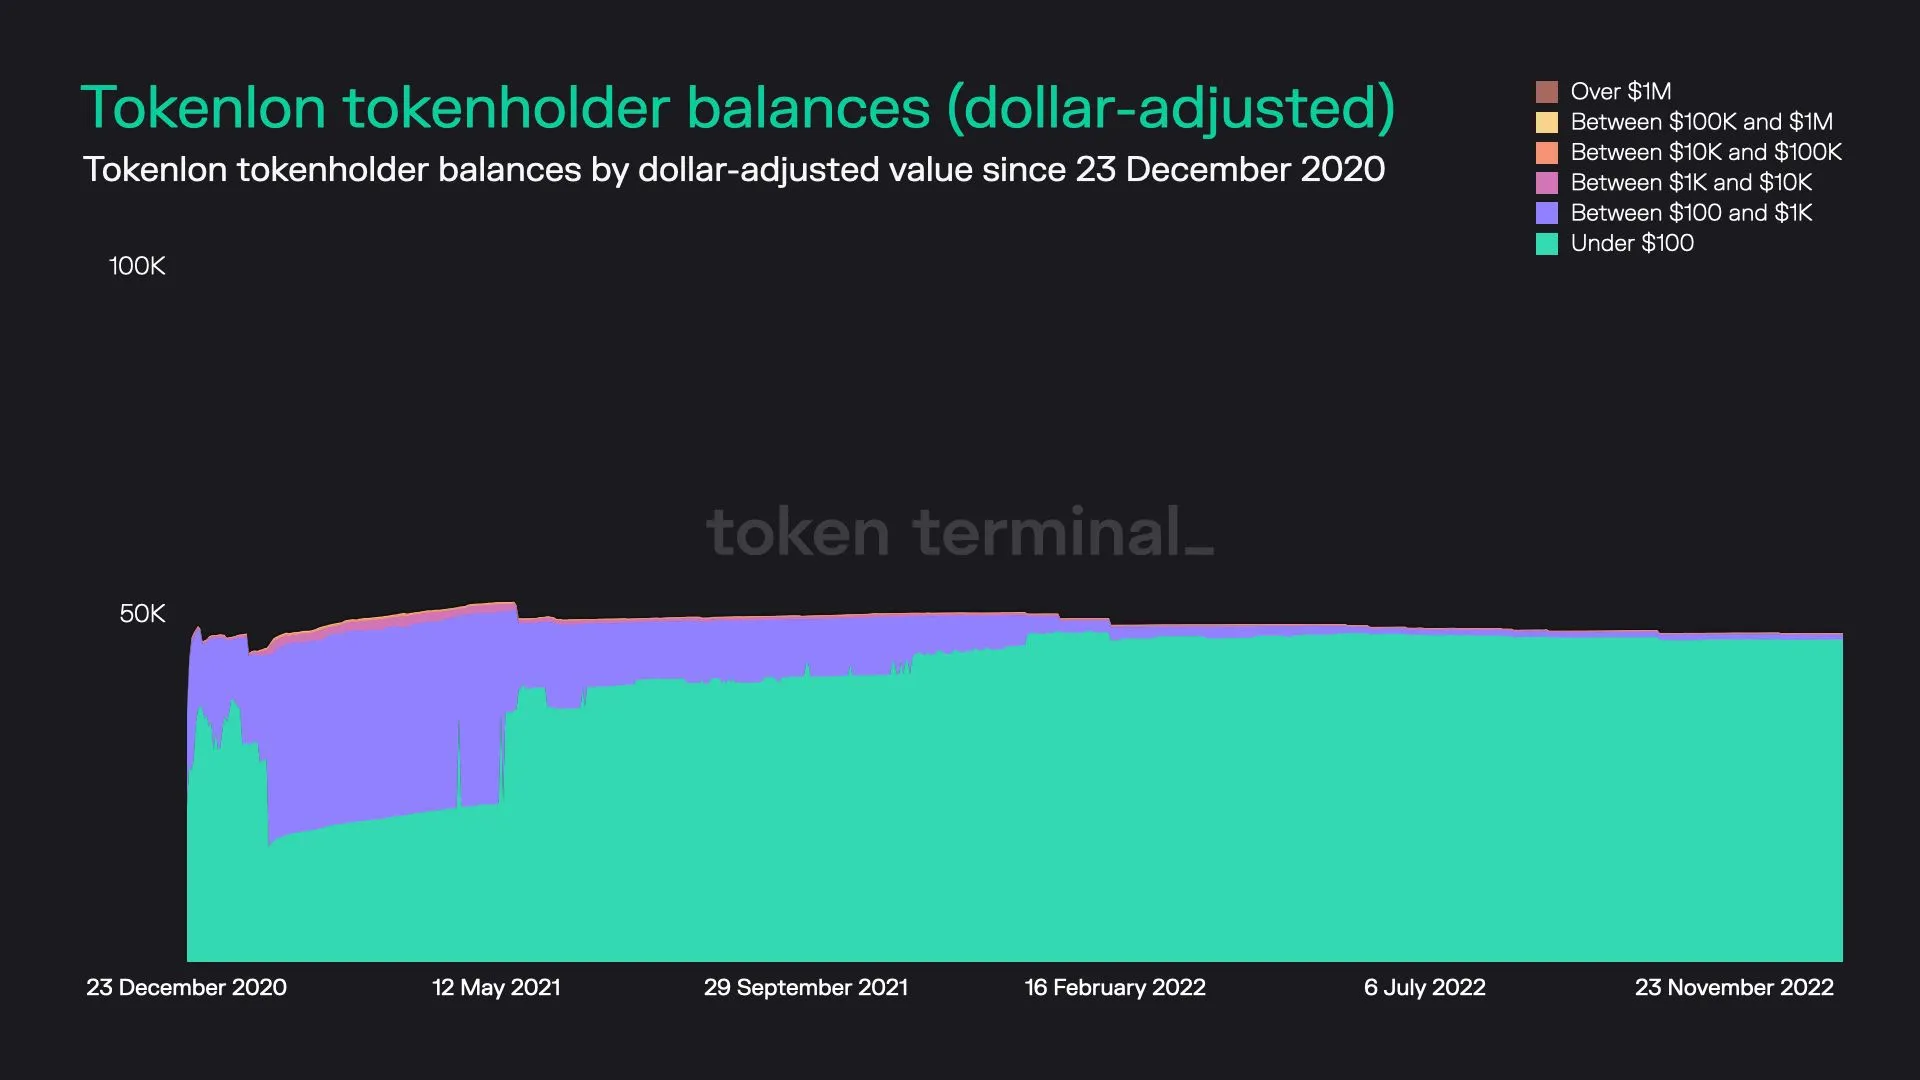
18. Tokenlon (LON)
Key stats:
- Circulating market cap: $15.0M
- Total number of LON holders: 47.3K
- Average dollar-value of LON per tokenholder: $316.6
- Percentage of LON tokens held by the top 100 holders: 98.7%
Tokenlon dashboard: https://tokenterminal.com/explorer/projects/tokenlon
19. Ankr (ANKR)
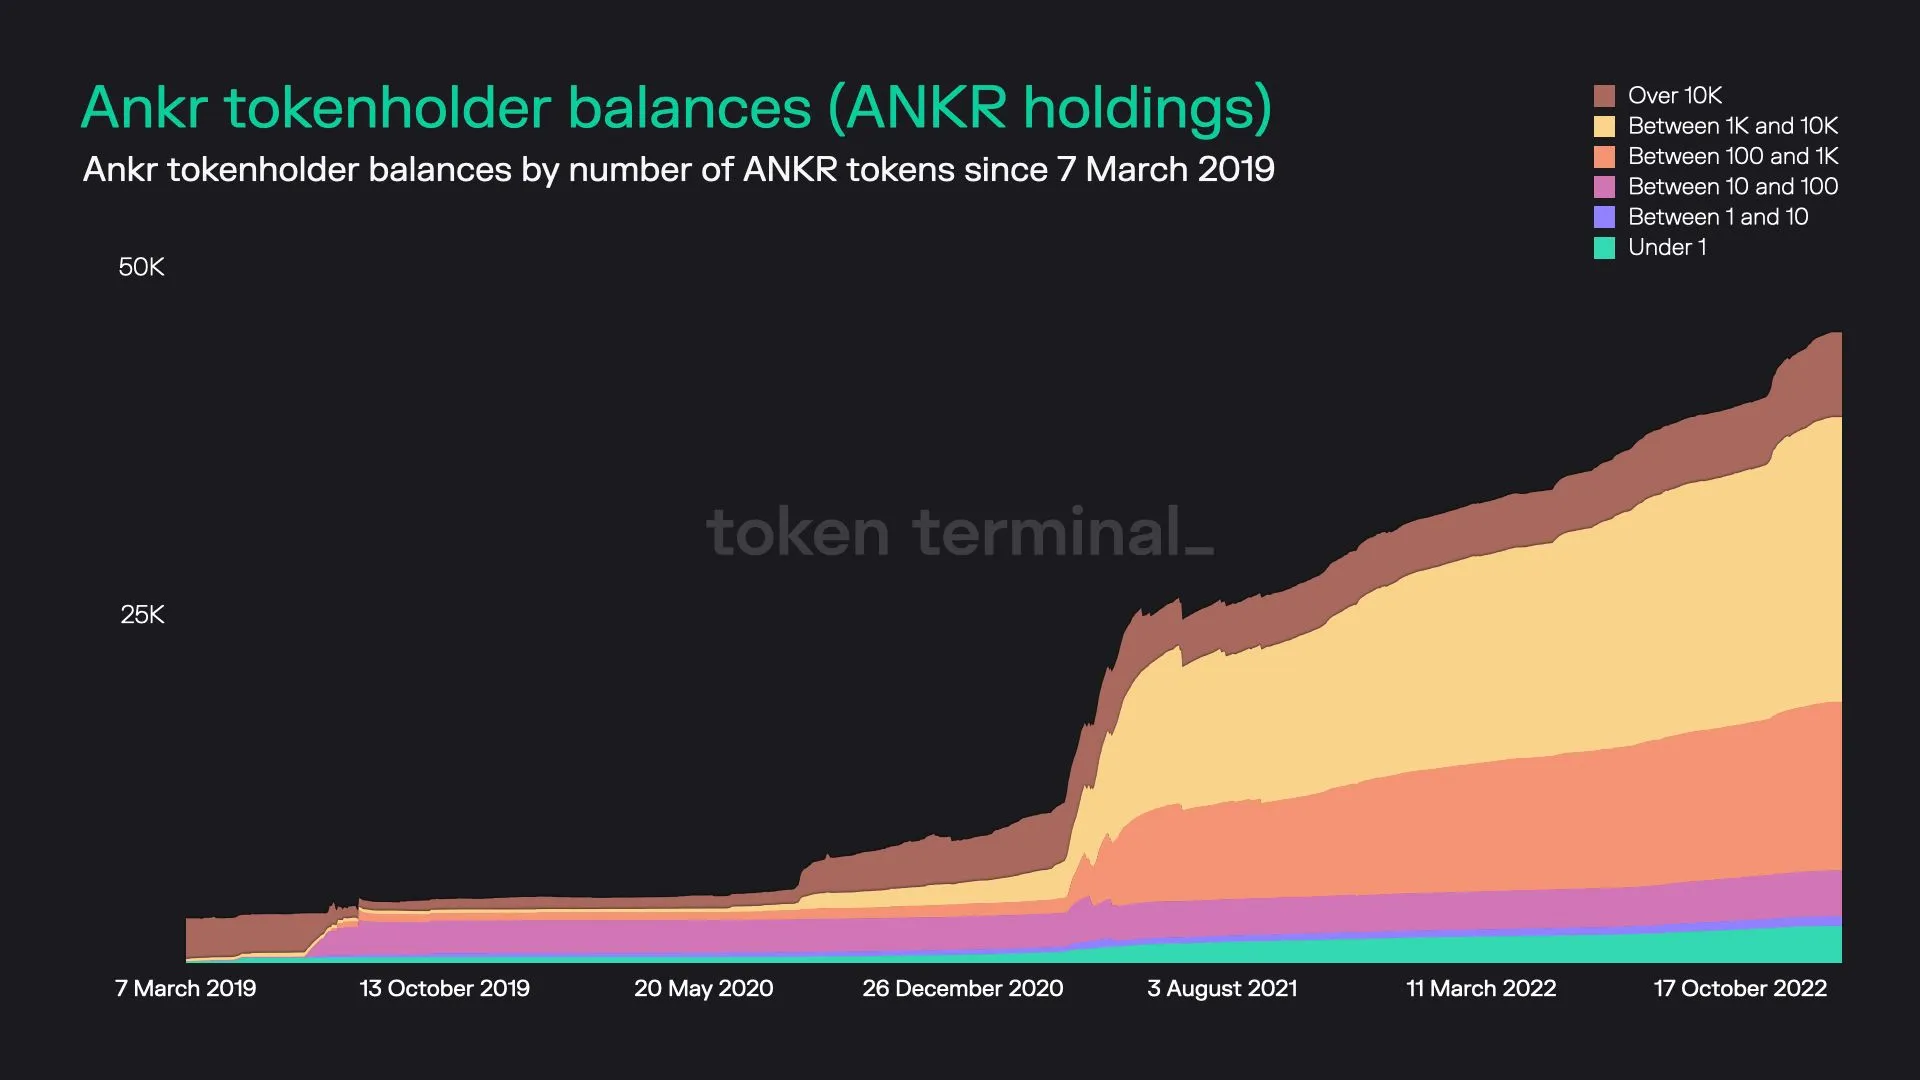
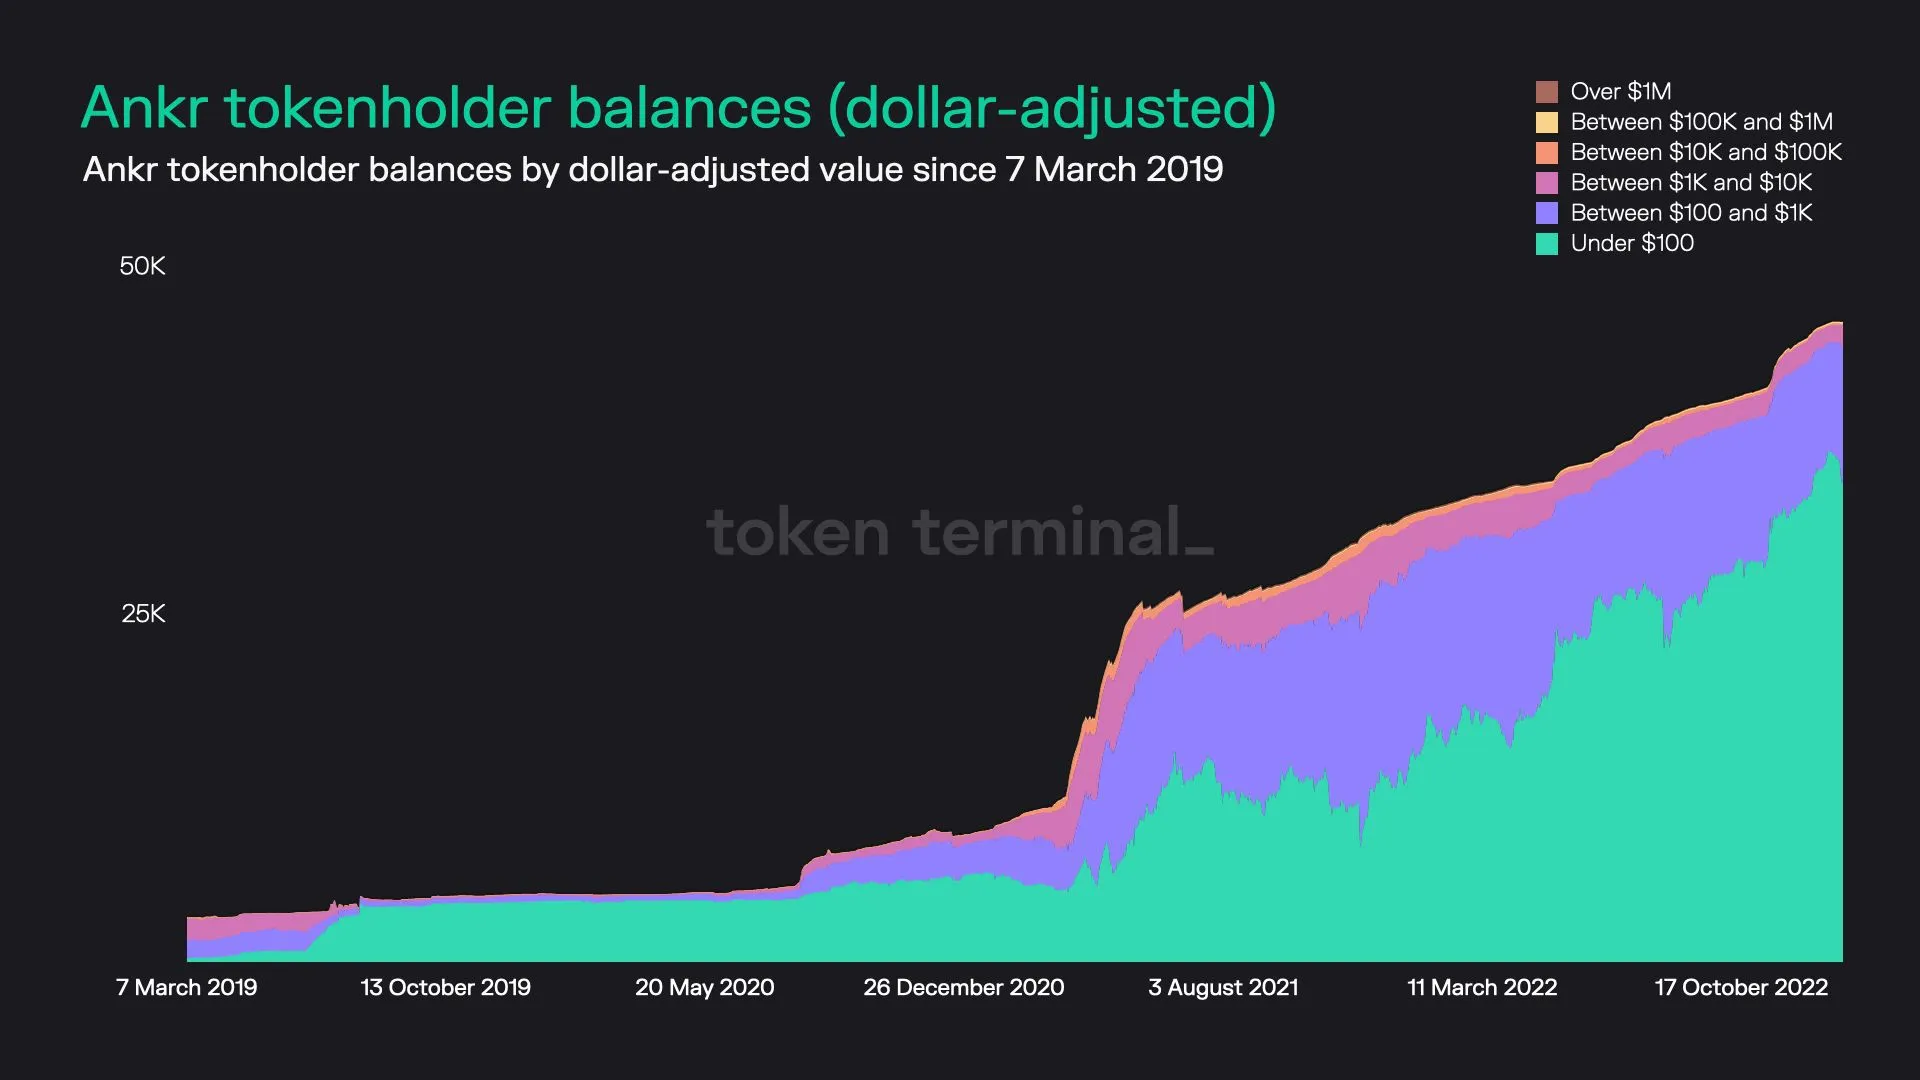
Key stats:
- Circulating market cap: $188.3M
- Total number of ANKR holders: 46.5K
- Average dollar-value of ANKR per tokenholder: $4.0K
- Percentage of ANKR tokens held by the top 100 holders: 90.4%
Ankr dashboard: https://tokenterminal.com/explorer/projects/ankr
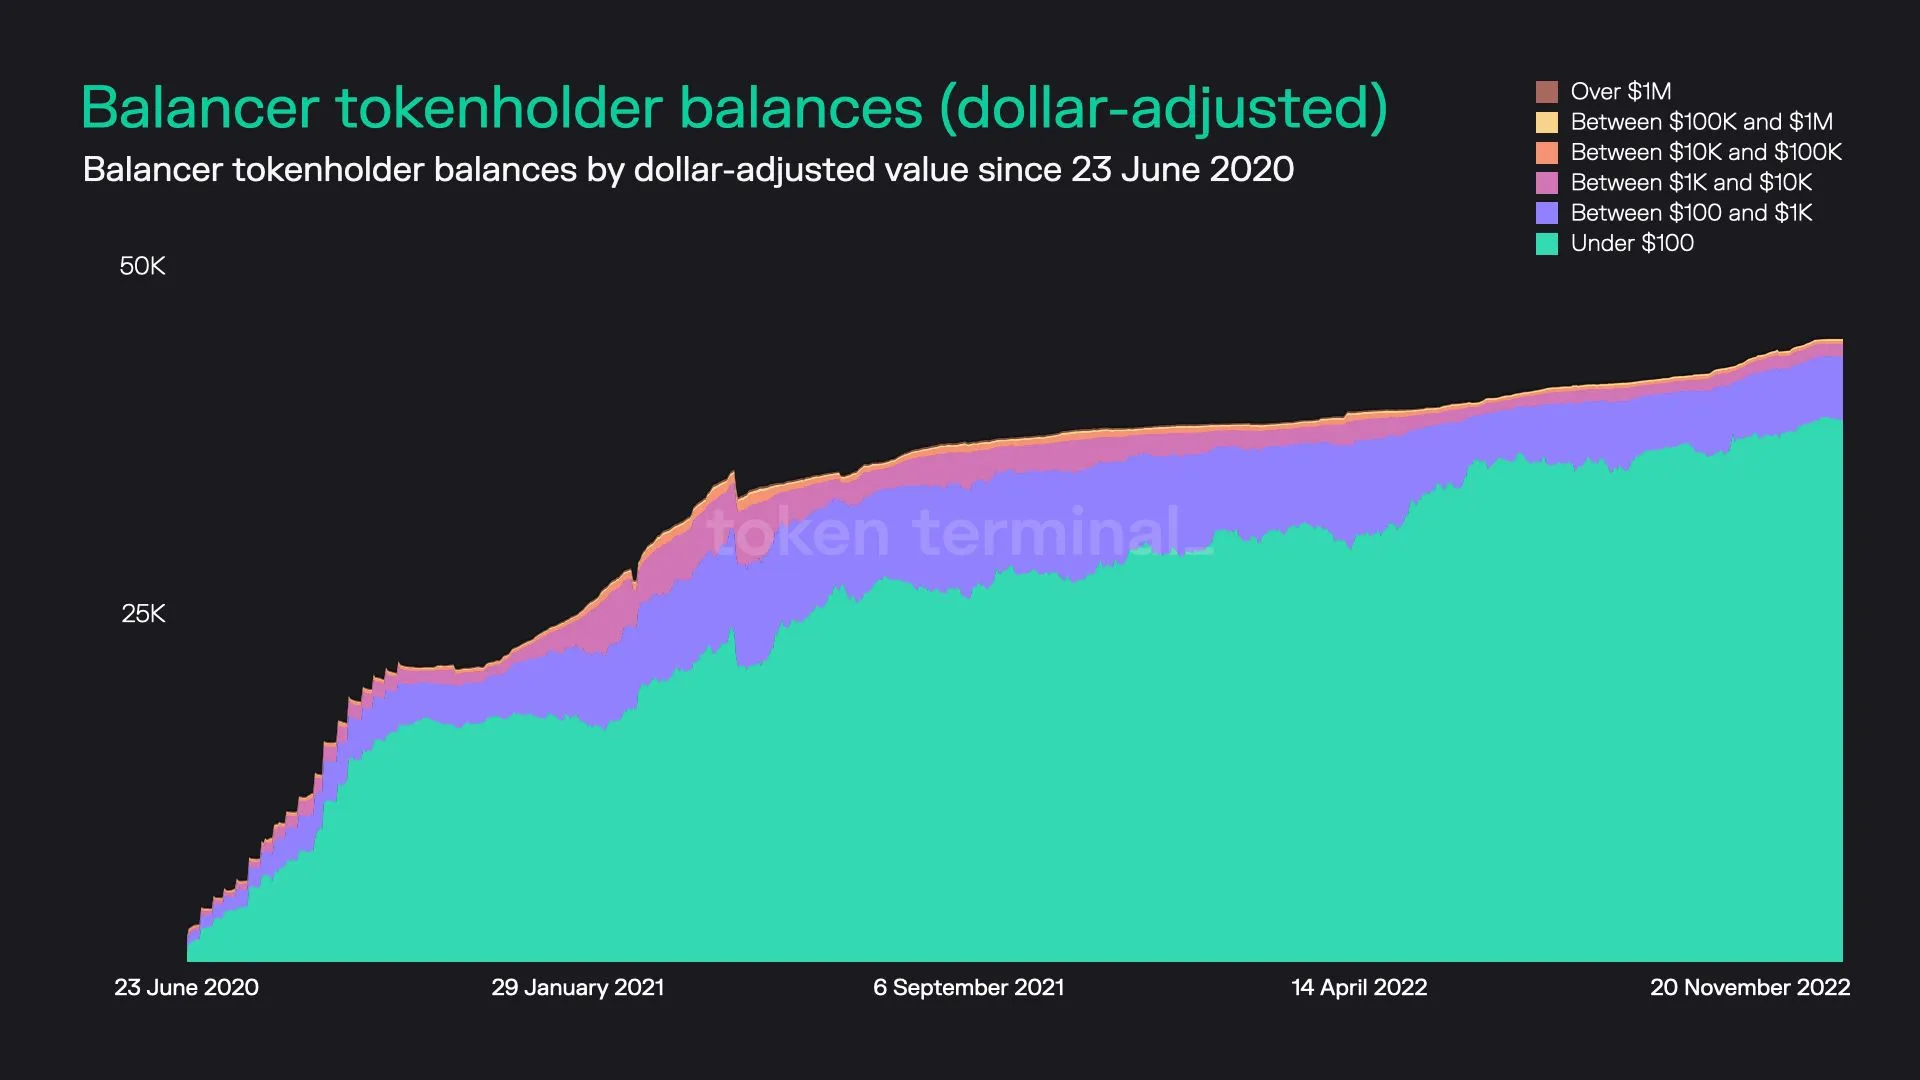
20. Balancer (BAL)
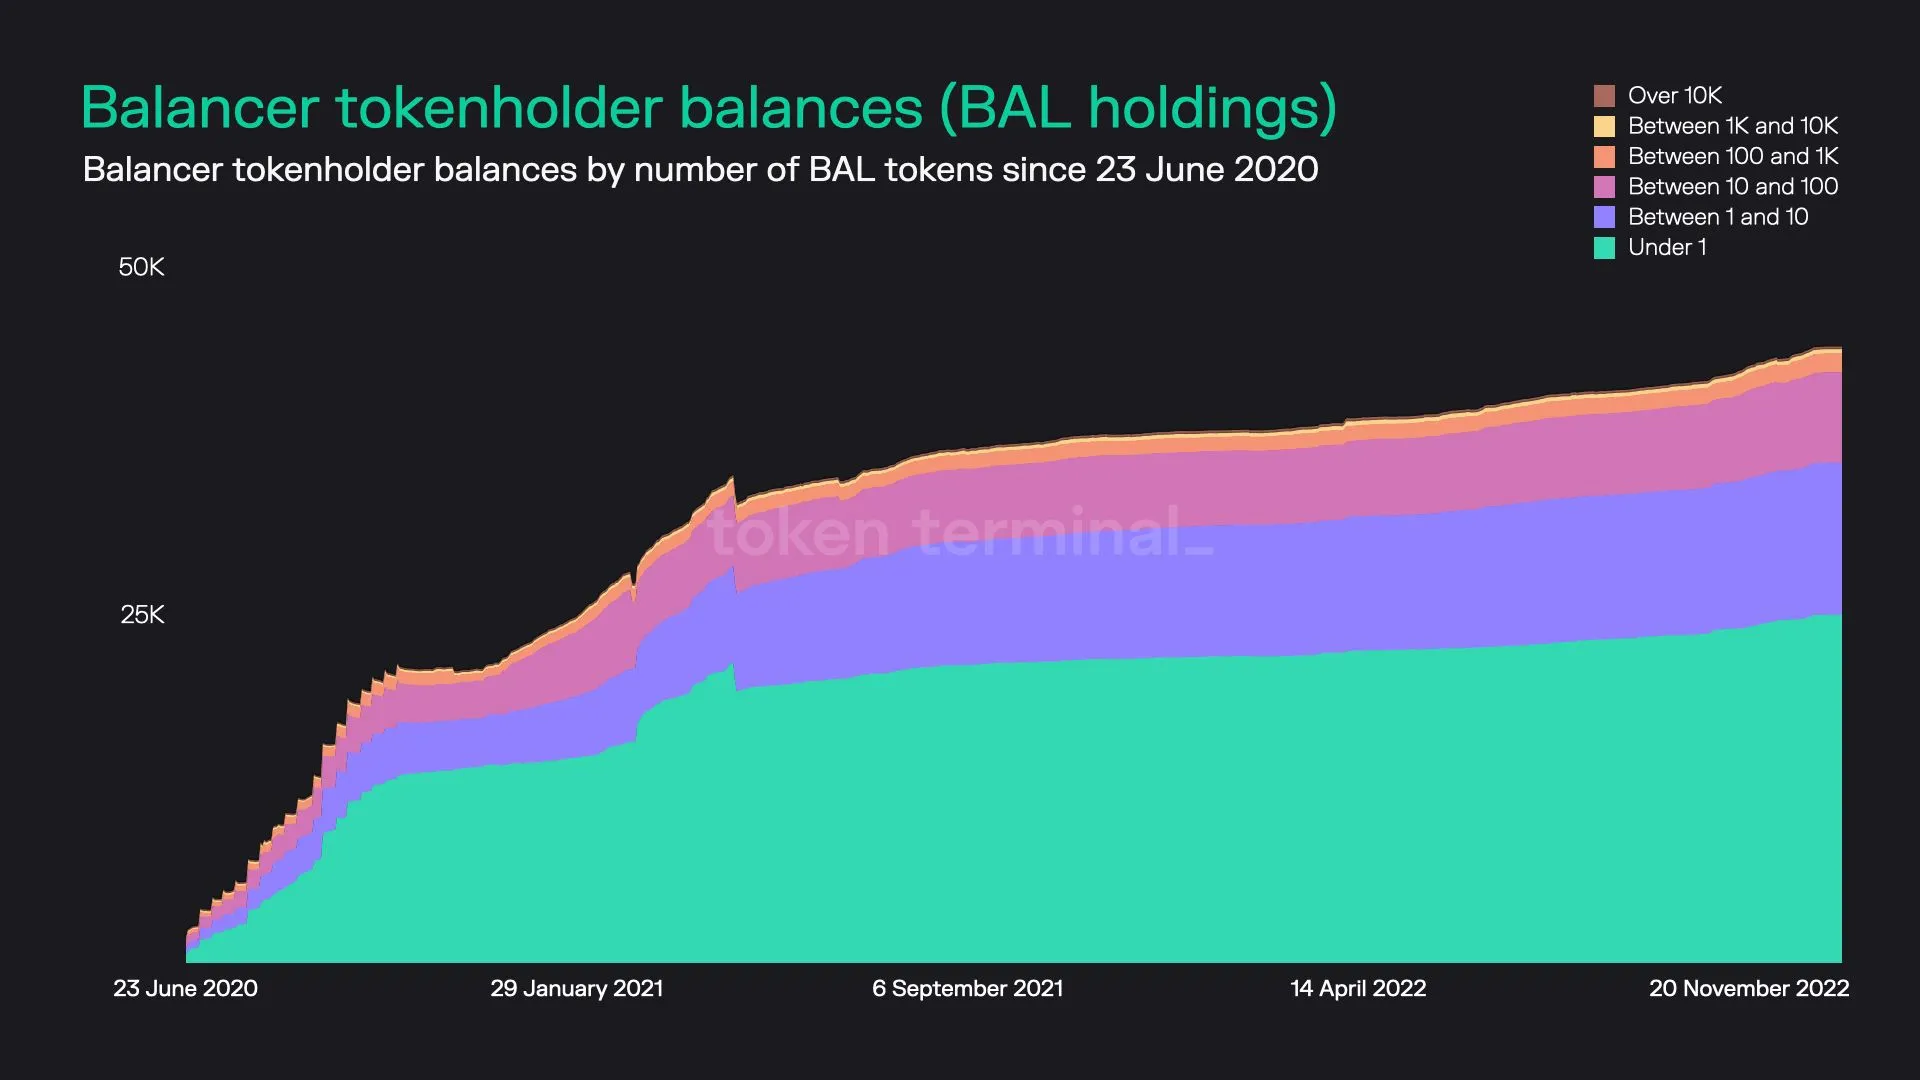
Key stats:
- Circulating market cap: $255.2M
- Total number of BAL holders: 44.9K
- Average dollar-value of BAL per tokenholder: $5.7K
- Percentage of BAL tokens held by the top 100 holders: 93.3%
Balancer dashboard: https://tokenterminal.com/explorer/projects/balancer
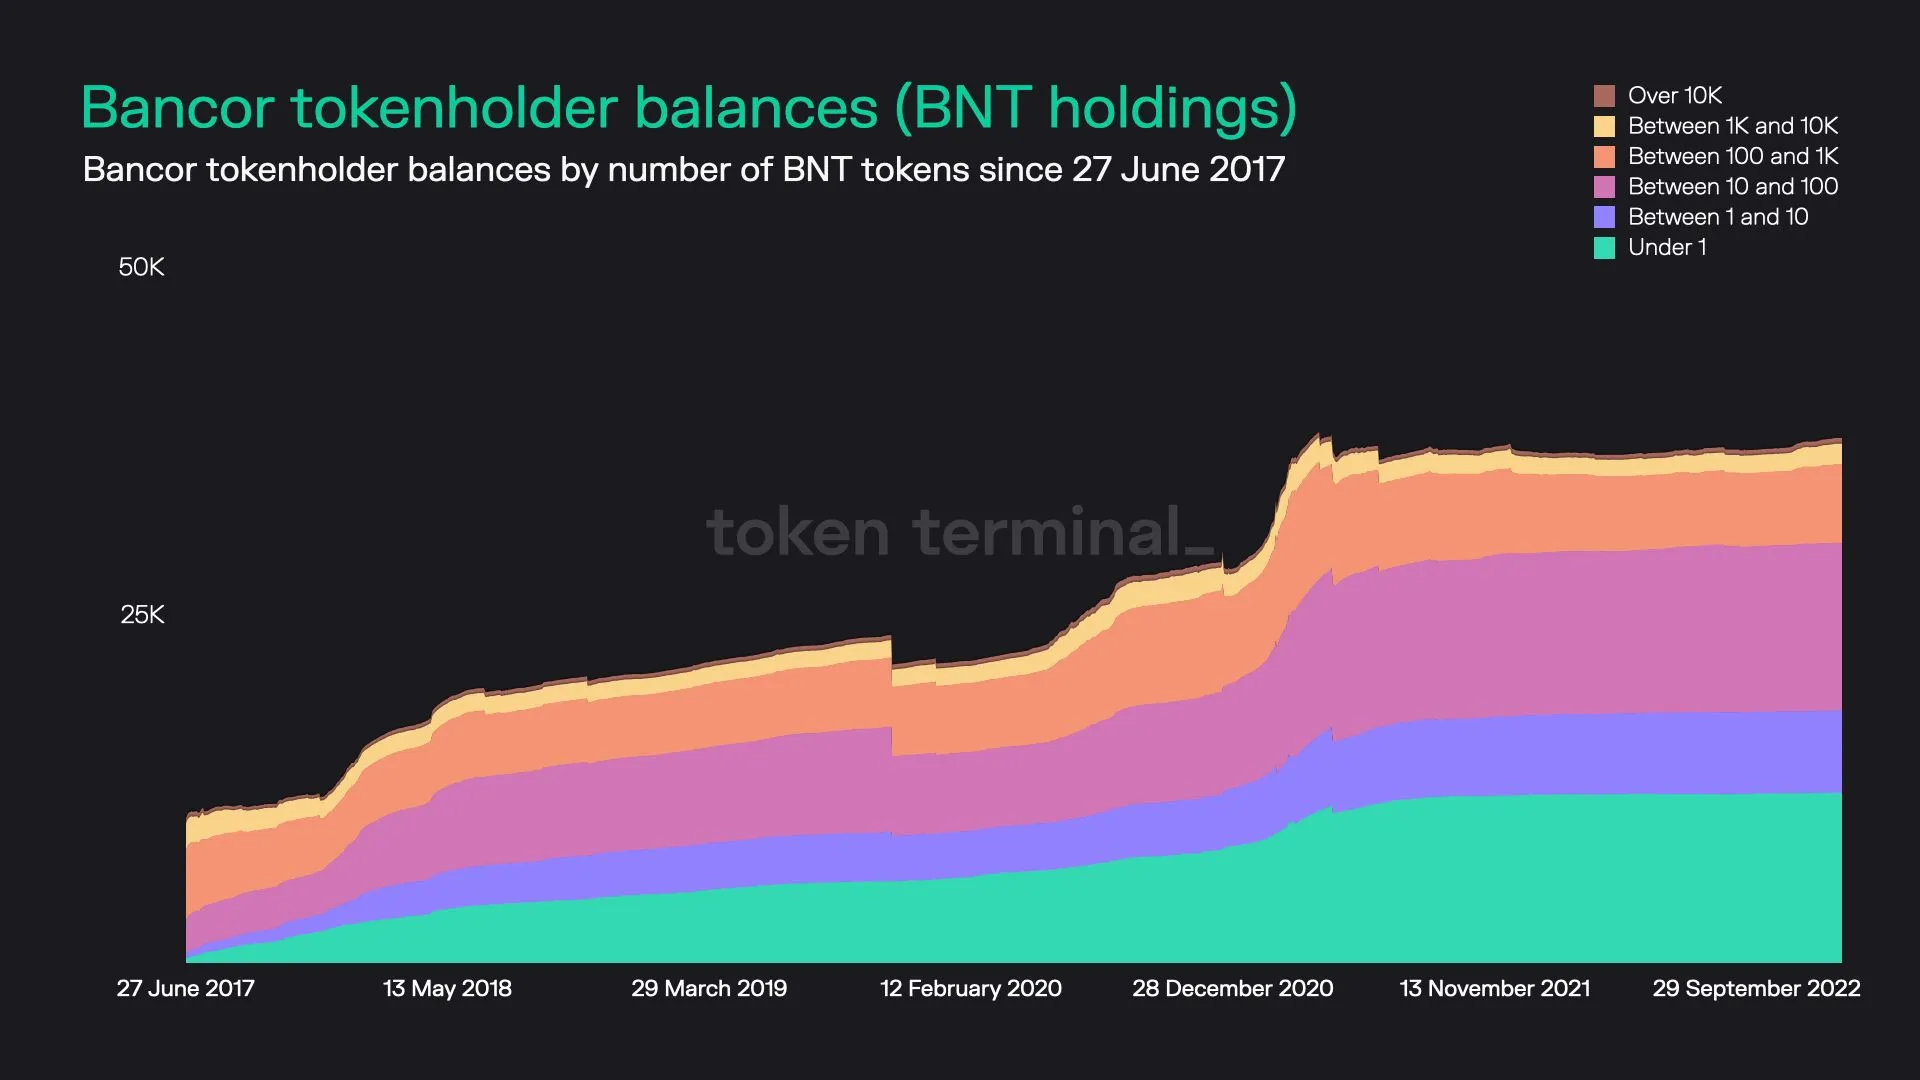
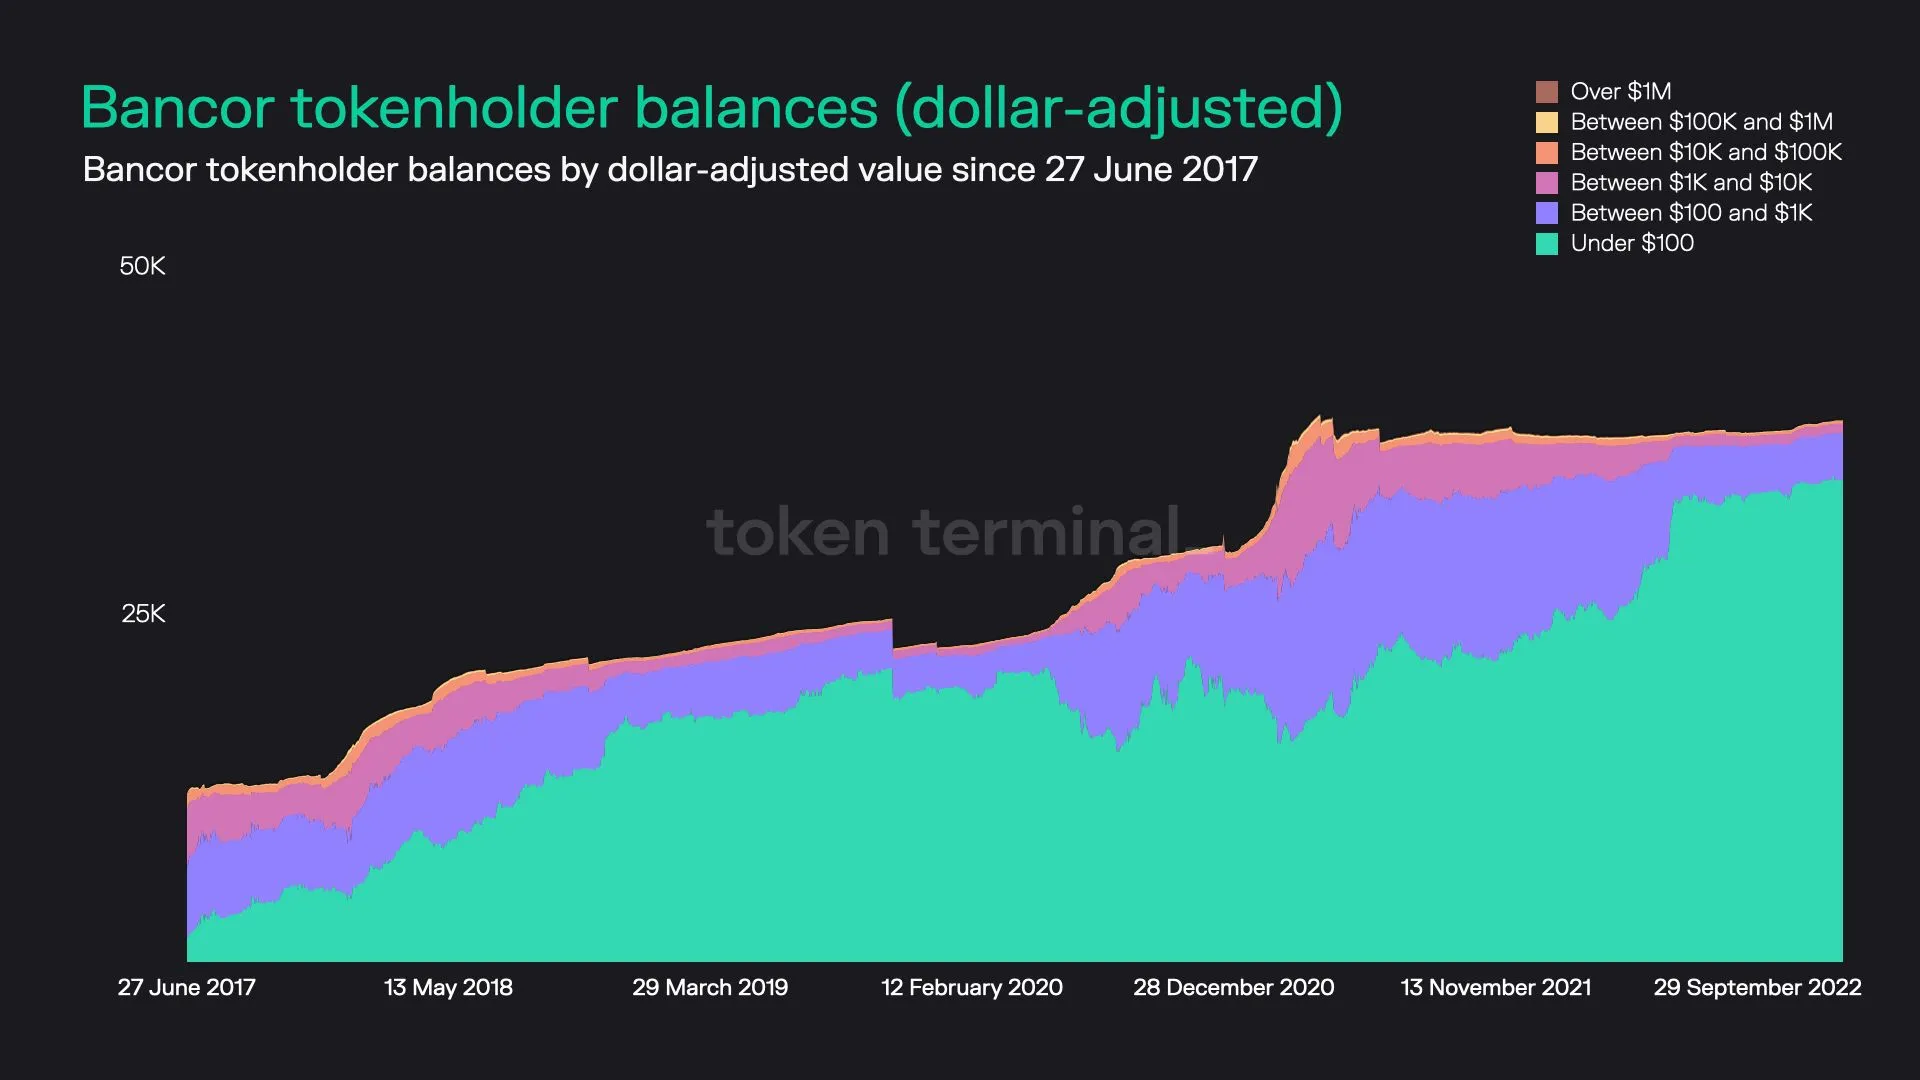
21. Bancor (BNT)
Key stats:
- Circulating market cap: $65.8M
- Total number of BNT holders: 39.0K
- Average dollar-value of BNT per tokenholder: $1.7K
- Percentage of BNT tokens held by the top 100 holders: 90.3%
Bancor dashboard: https://tokenterminal.com/explorer/projects/bancor
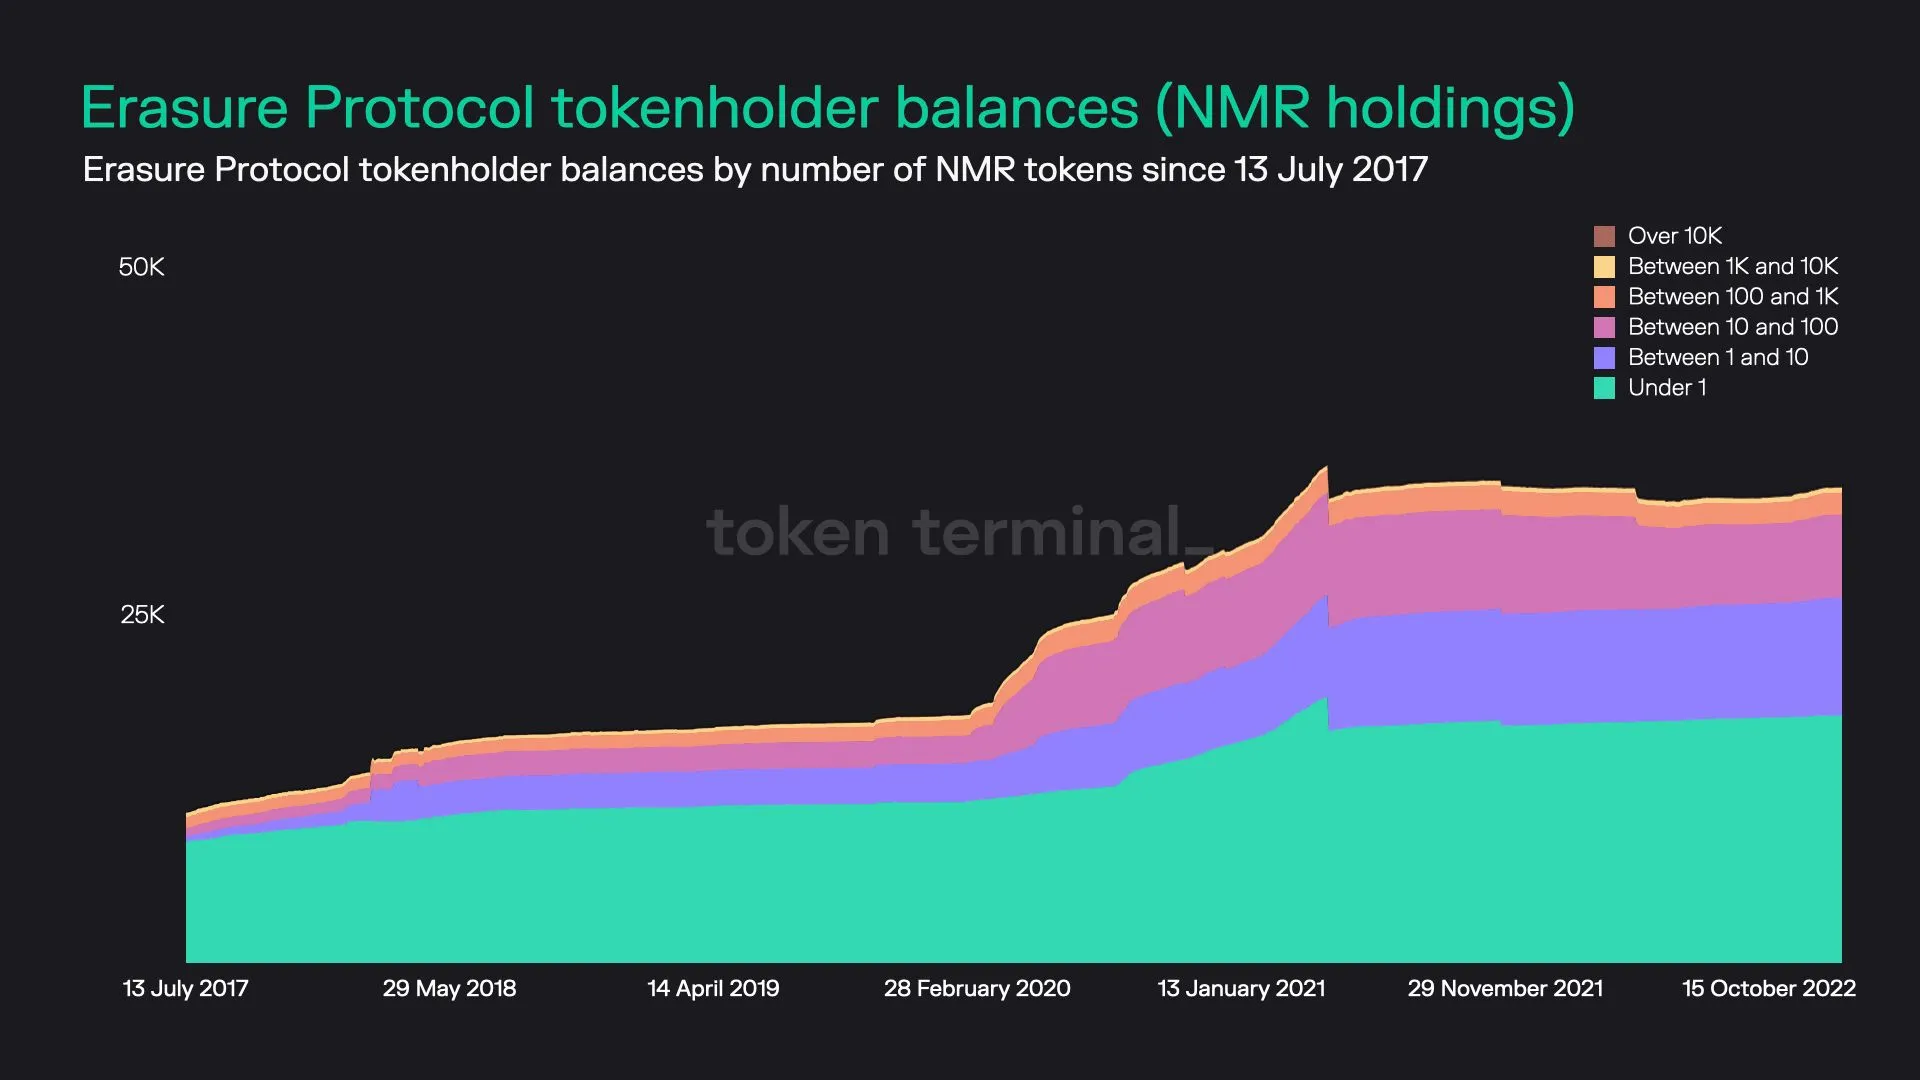
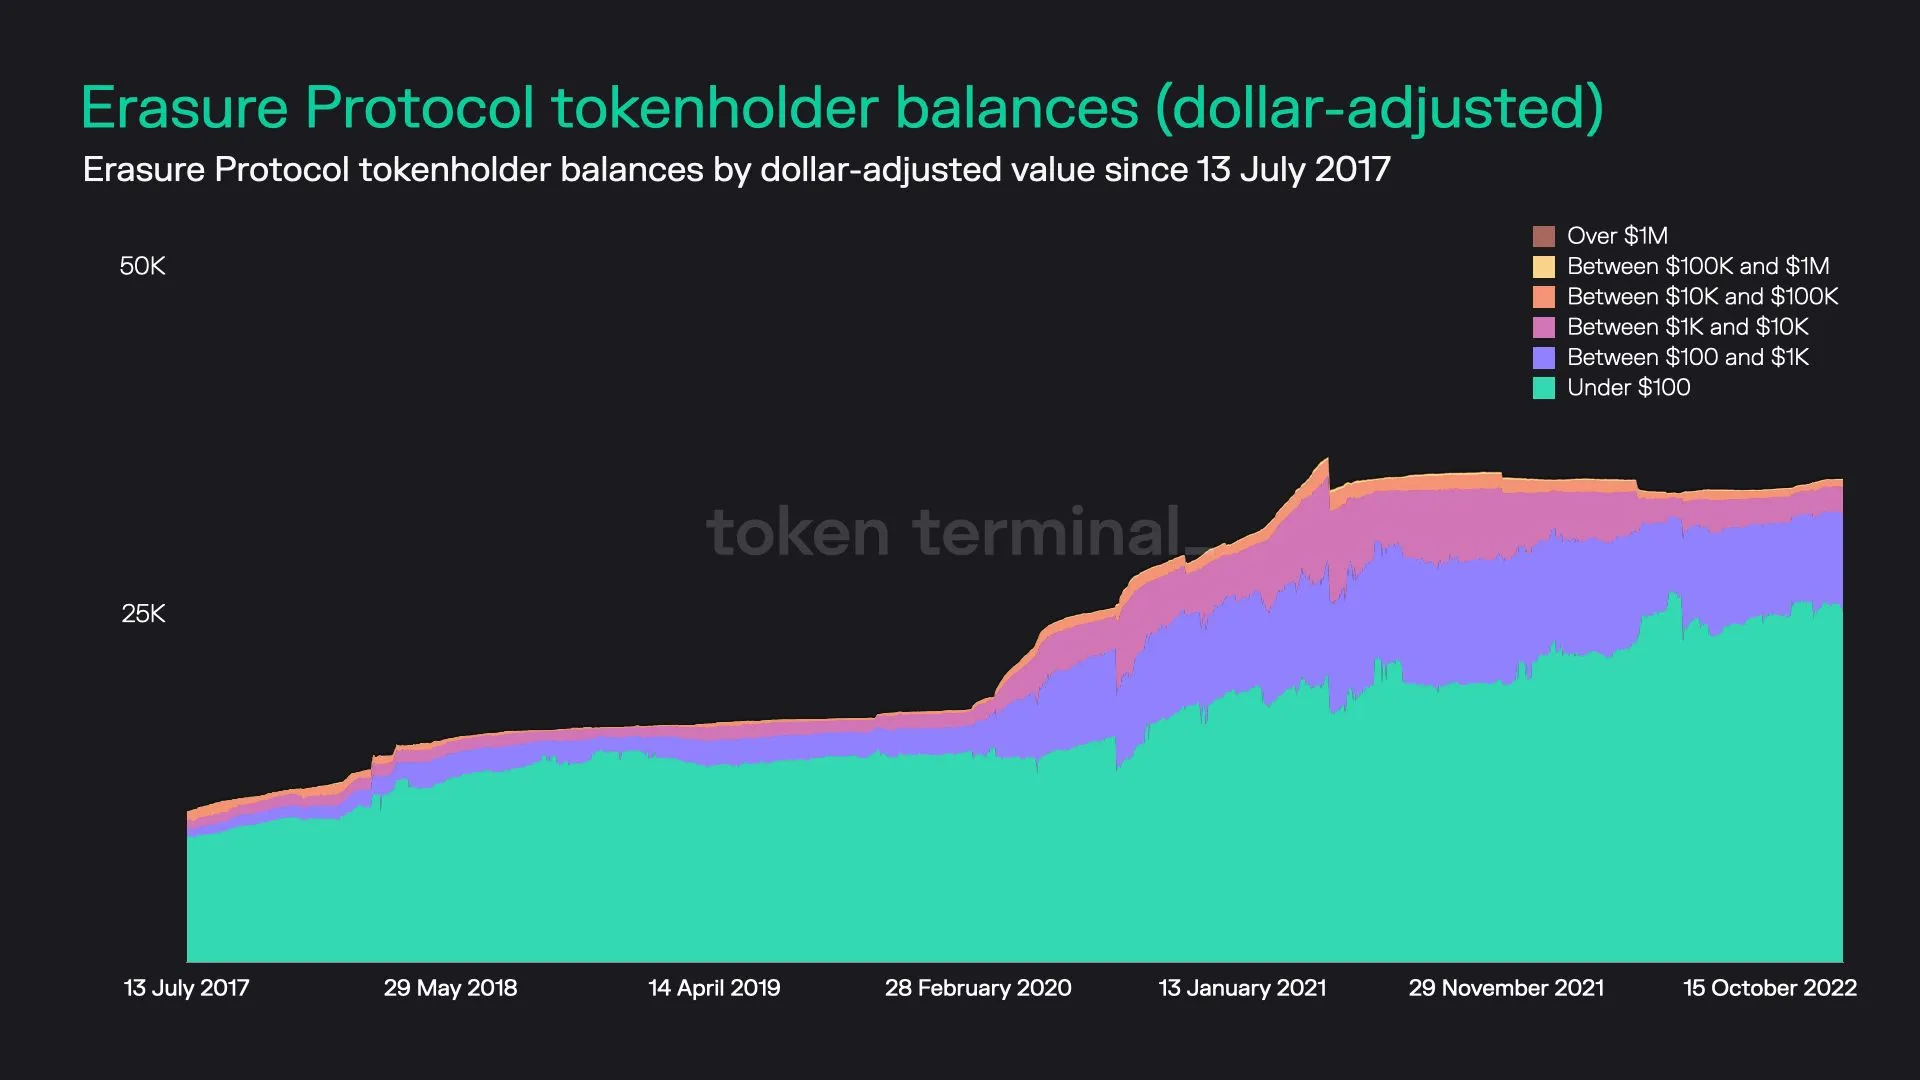
22. Erasure Protocol (NMR)
Key stats:
- Circulating market cap: $100.0M
- Total number of NMR holders: 34.8K
- Average dollar-value of NMR per tokenholder: $2.9K
- Percentage of NMR tokens held by the top 100 holders: 87.7%
Erasure Protocol dashboard: https://tokenterminal.com/explorer/projects/erasure-protocol
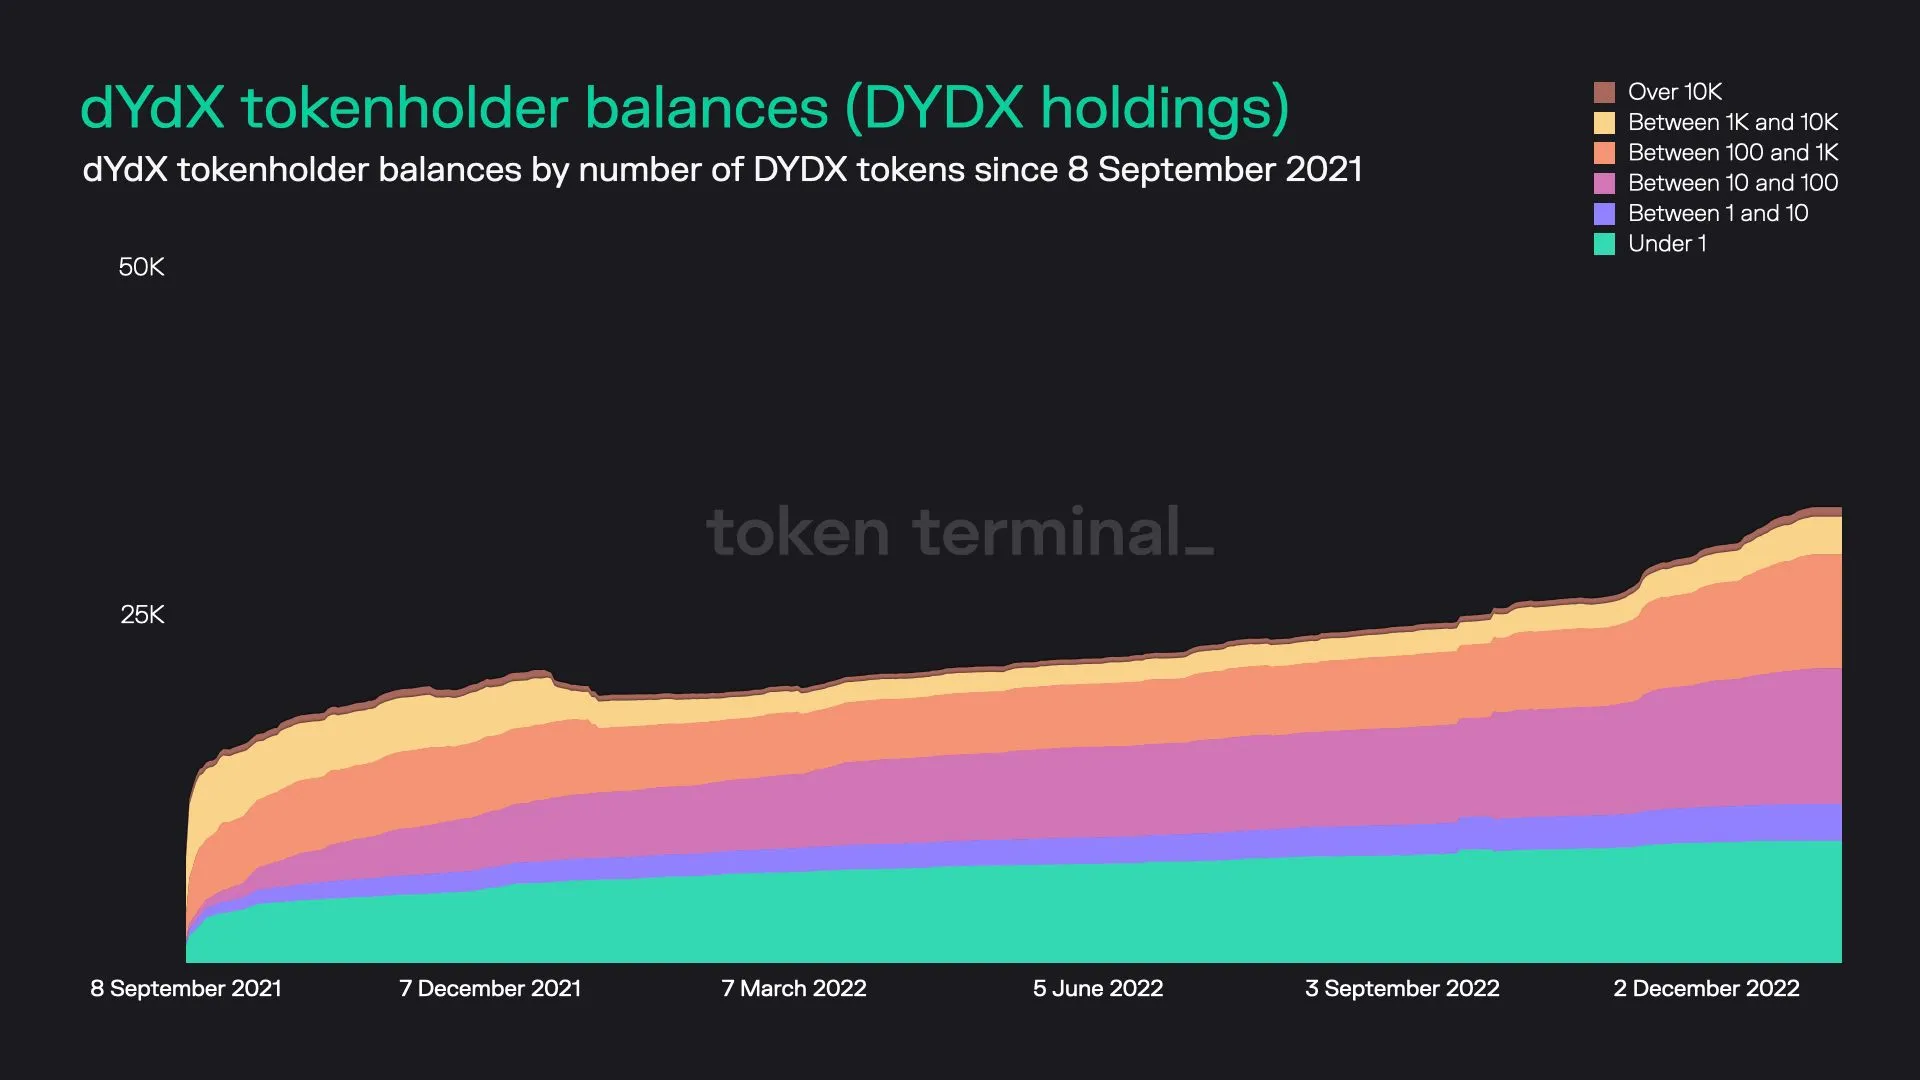
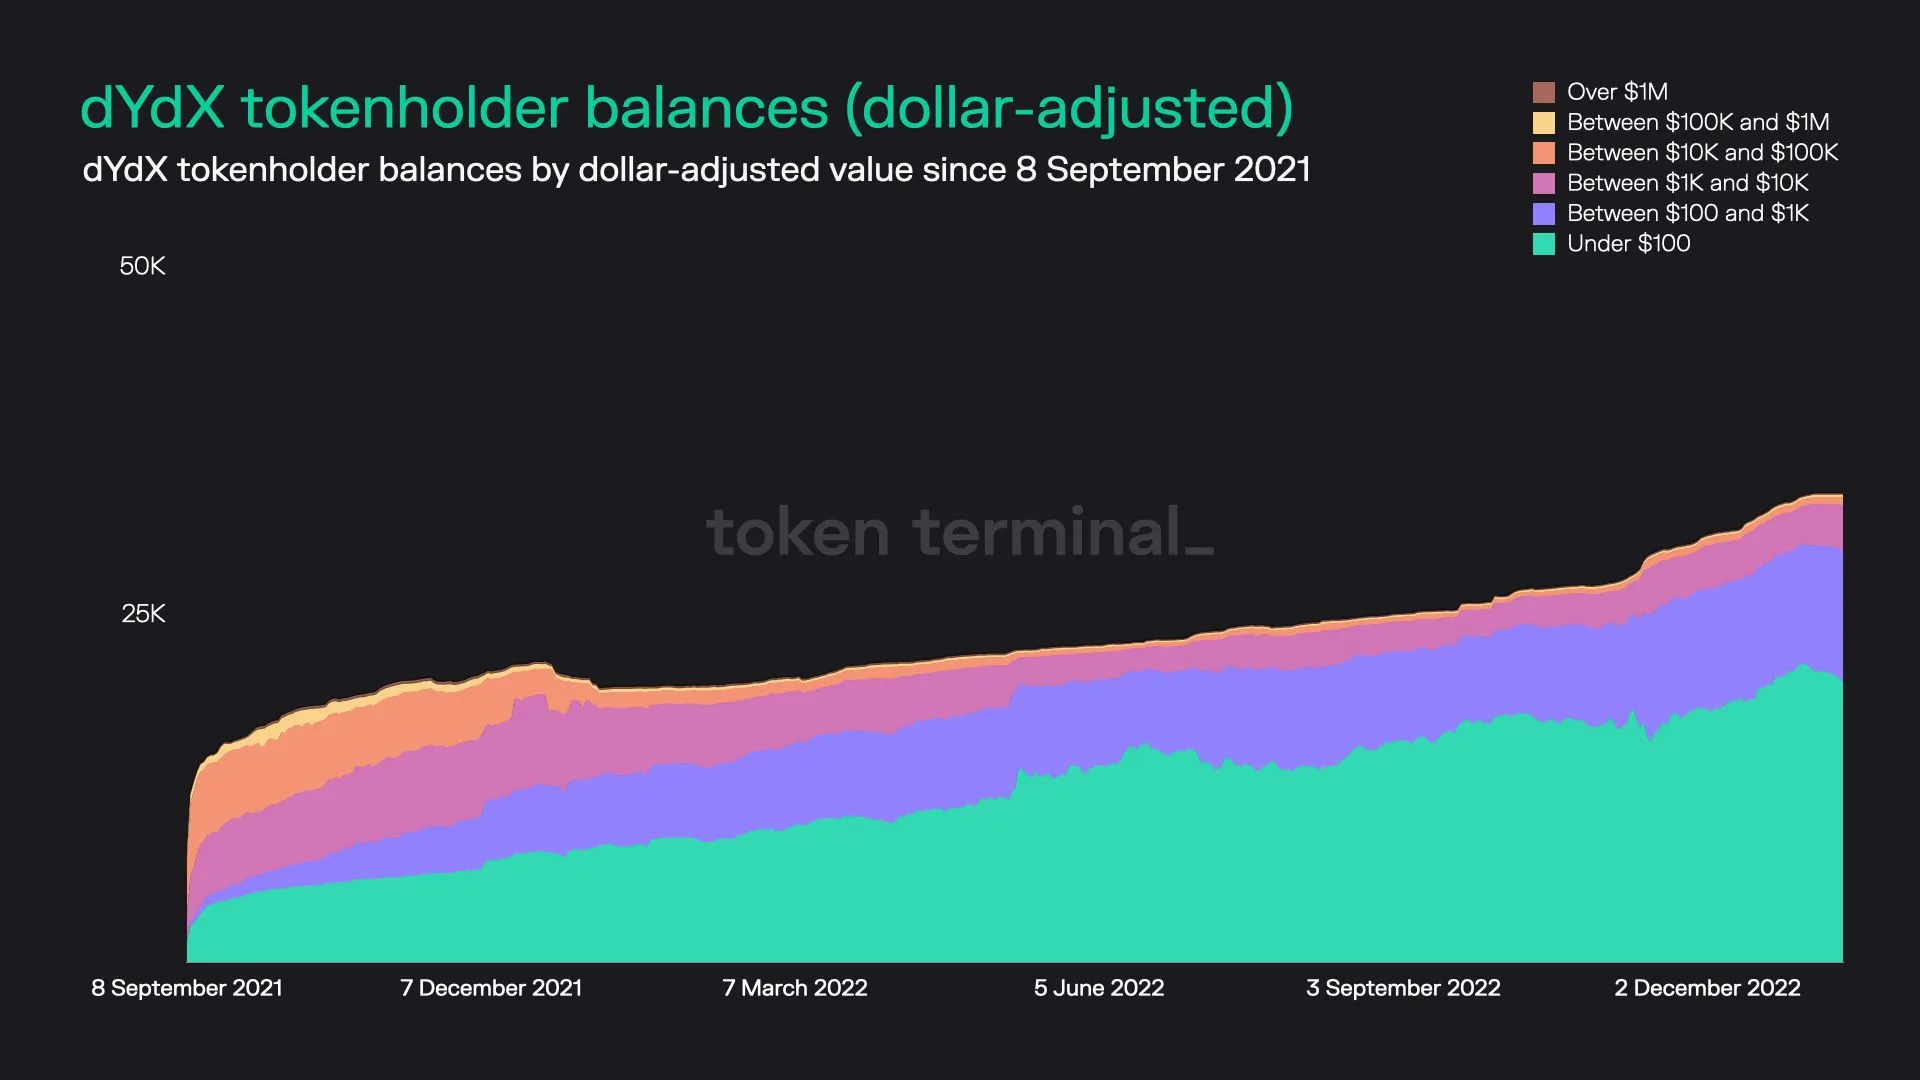
23. dYdX (DYDX)
Key stats:
- Circulating market cap: $213.0M
- Total number of DYDX holders: 34.4K
- Average dollar-value of DYDX per tokenholder: $6.2K
- Percentage of DYDX tokens held by the top 100 holders: 94.2%
dYdX dashboard: https://tokenterminal.com/explorer/projects/dydx
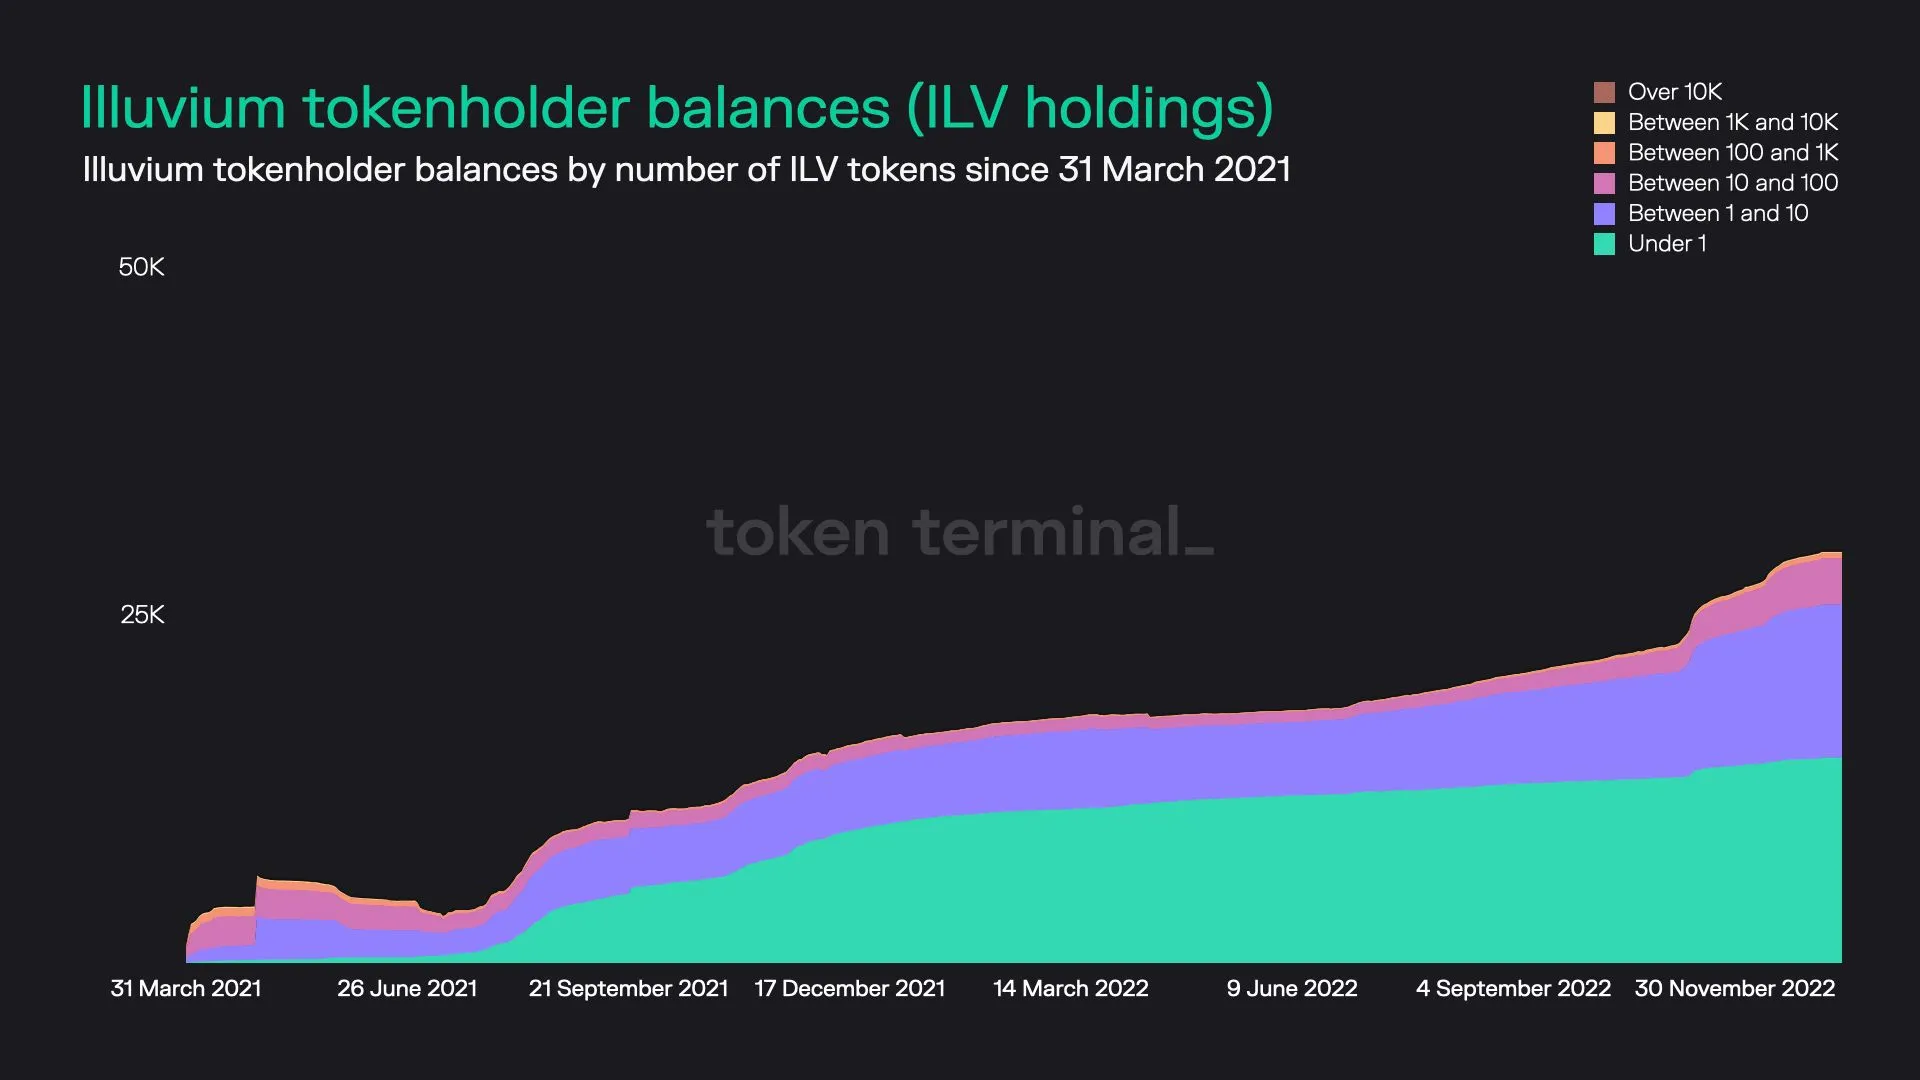
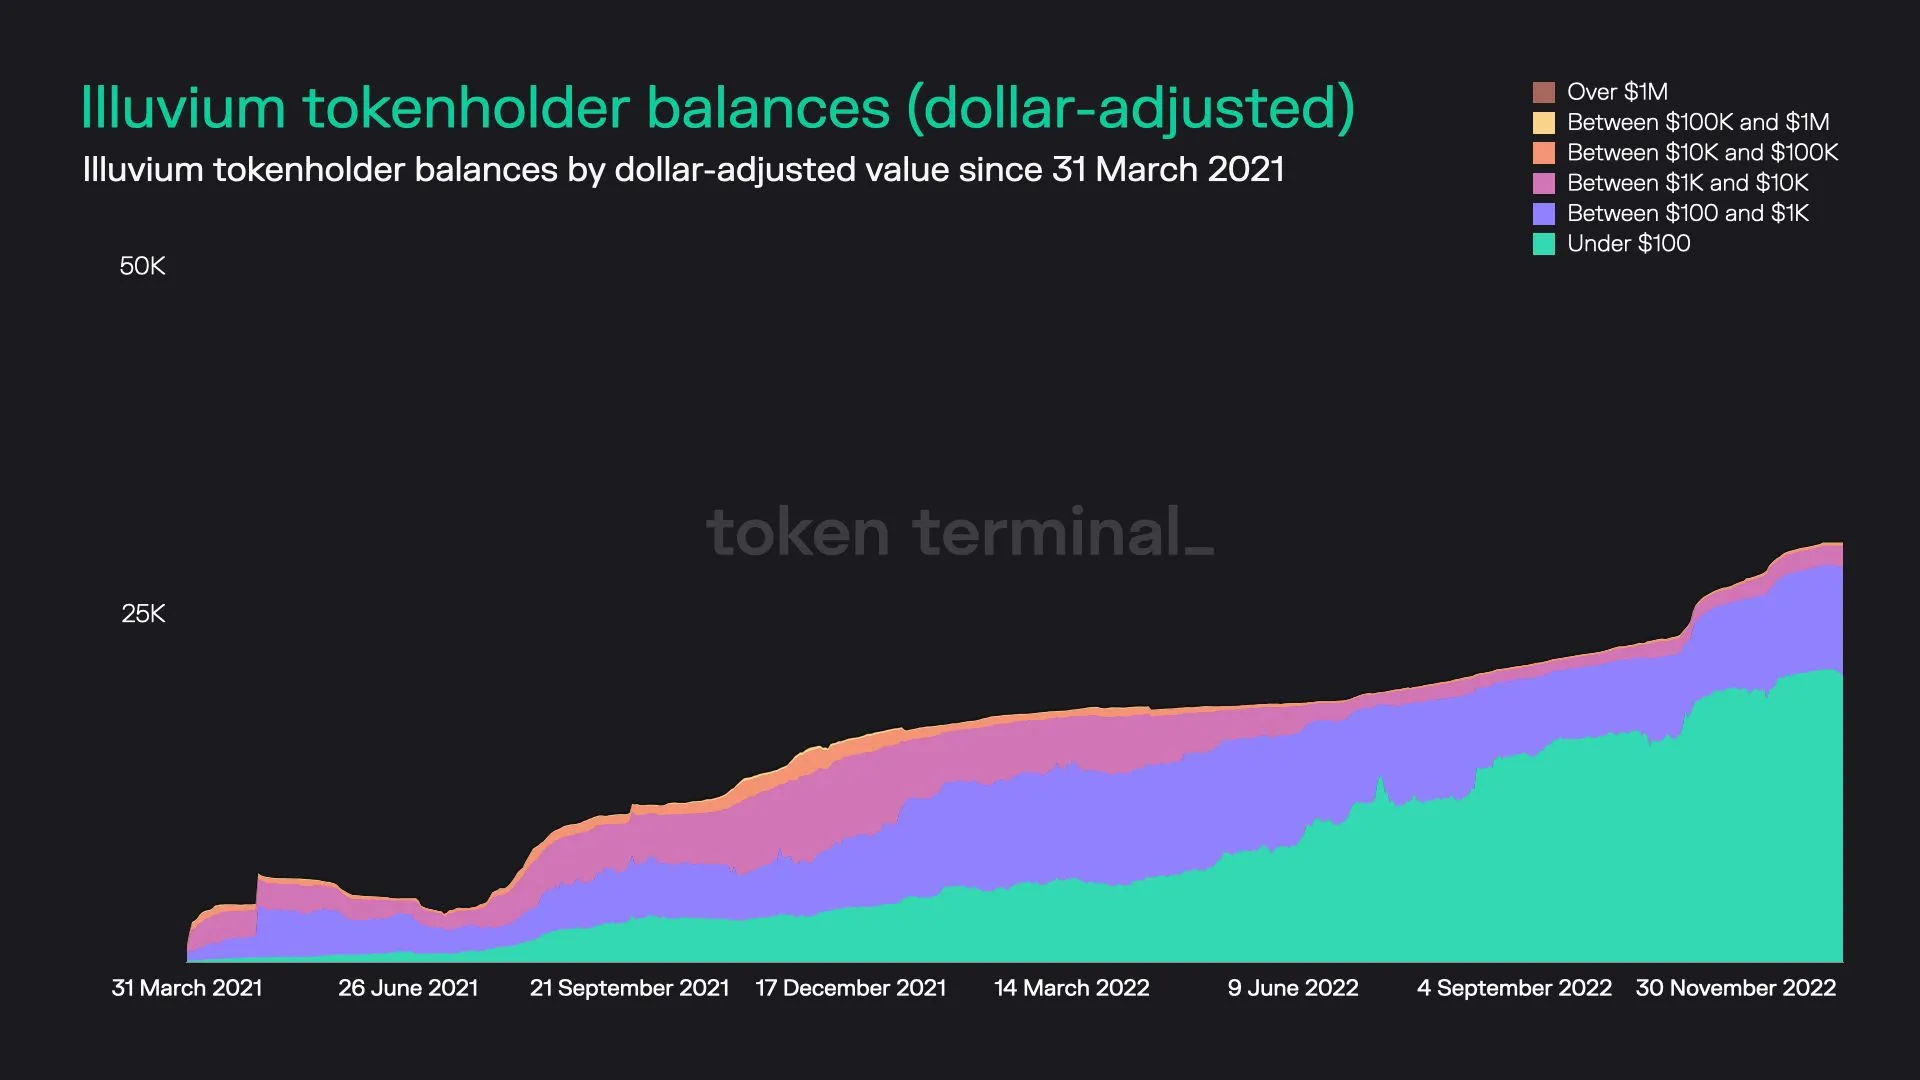
24. Illuvium (ILV)
Key stats:
- Circulating market cap: $105.8M
- Total number of ILV holders: 31.1K
- Average dollar-value of ILV per tokenholder: $3.4K
- Percentage of ILV tokens held by the top 100 holders: 96.8%
Illuvium dashboard: https://tokenterminal.com/explorer/projects/illuvium
25. abracadabra.money (SPELL)
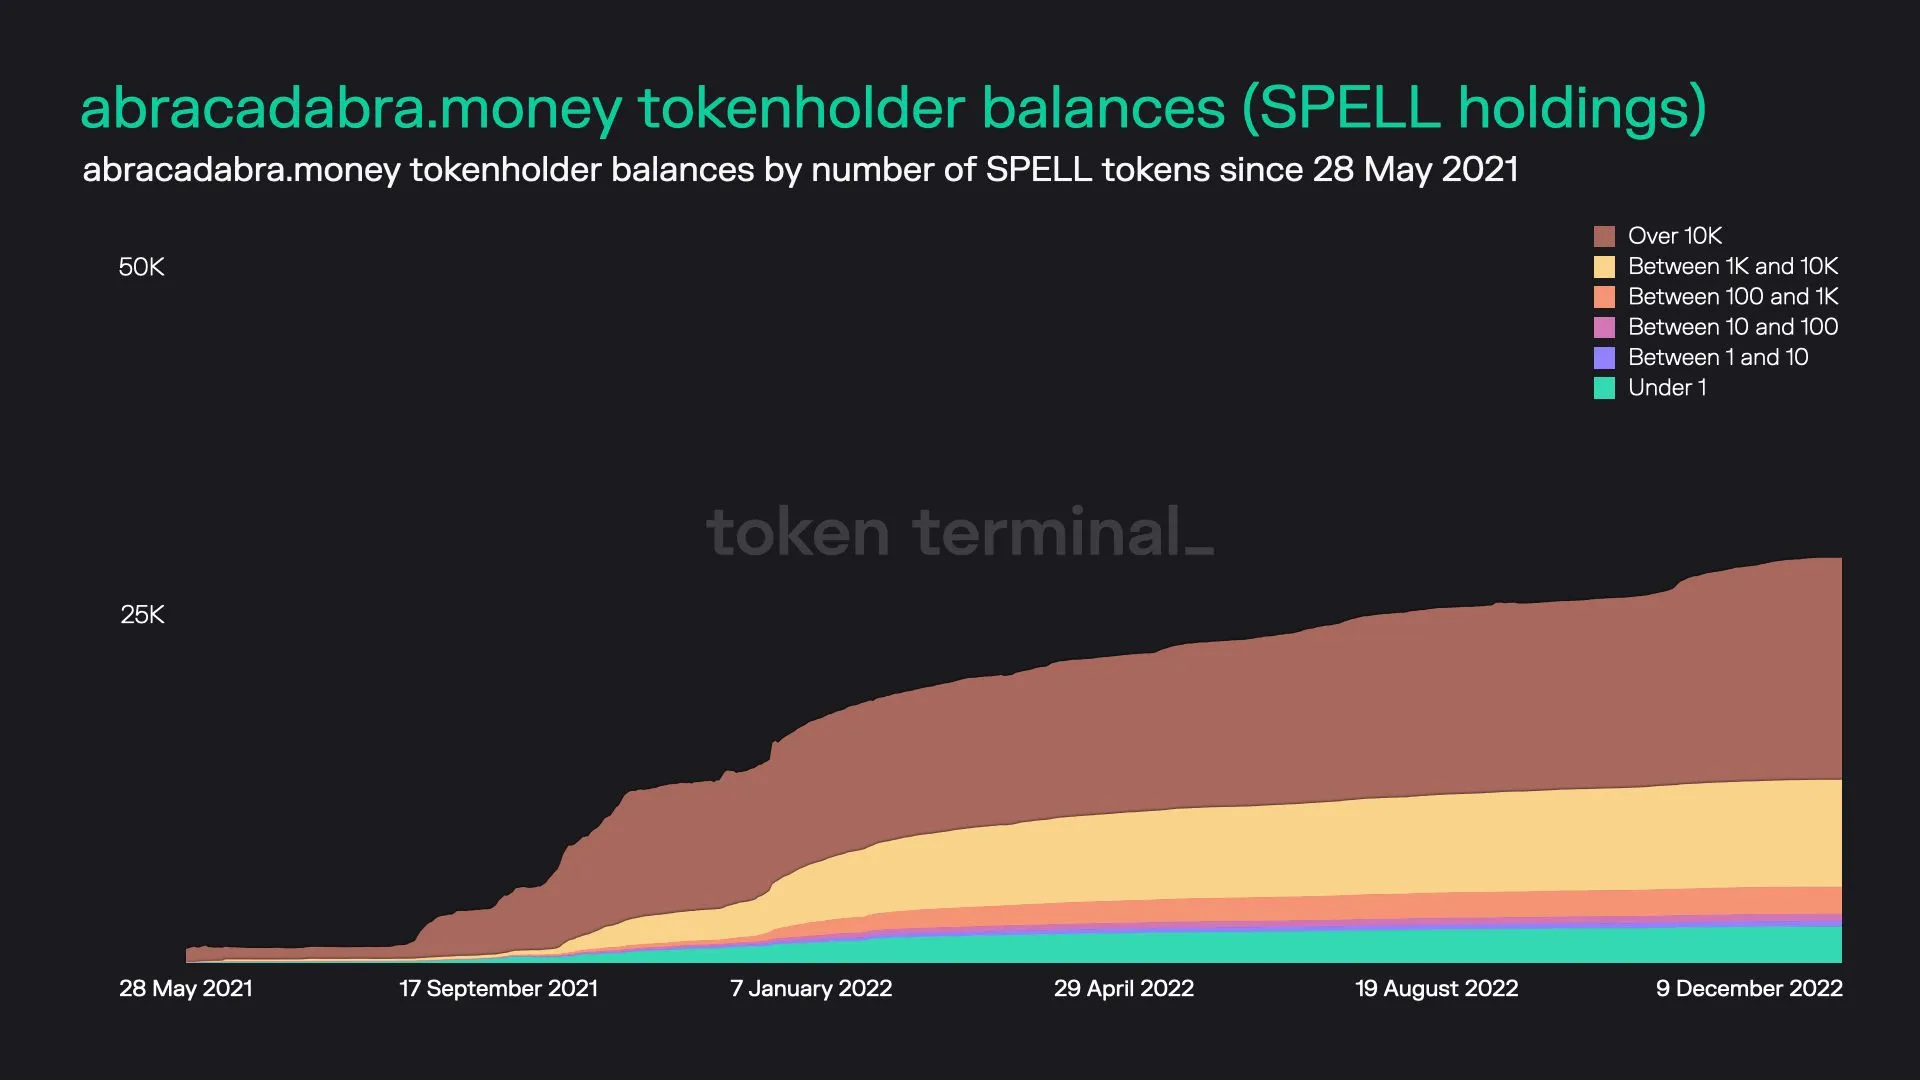
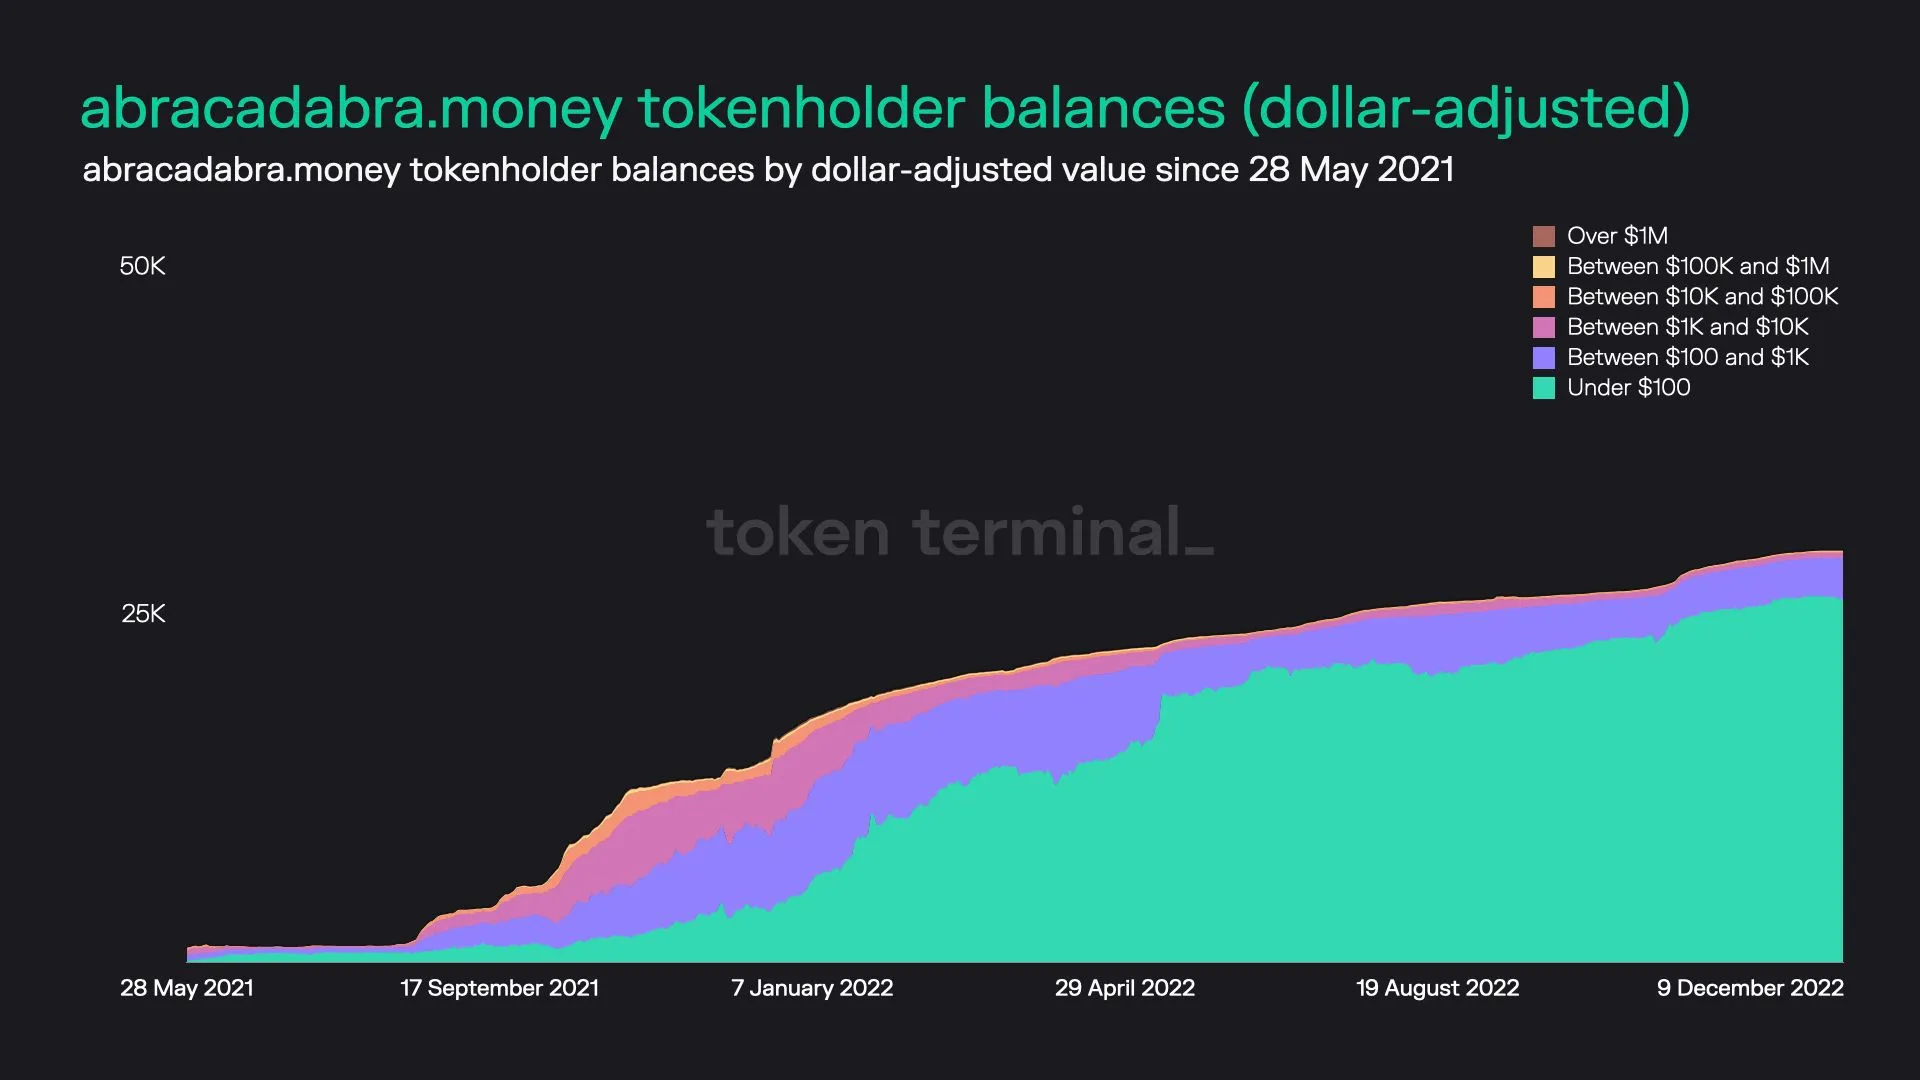
Key stats:
- Circulating market cap: $78.7M
- Total number of SPELL holders: 29.8K
- Average dollar-value of SPELL per tokenholder: $2.6K
- Percentage of SPELL tokens held by the top 100 holders: 98.5%
abracadabra.money dashboard: https://tokenterminal.com/explorer/projects/abracadabra-money
***
- Methodology:
This data only takes into account token holdings/balances on Ethereum Mainnet. Tokens that are bridged to other chains are counted under the bridge contract address used to perform the bridging. - Note that the 'top 100 holders' statistic often includes the project's treasury and vesting addresses, which are now accounted for as 1 tokenholder each. The reason we've included them here is because the funds locked up in those addresses are often under the control of the project's largest tokenholders.
Tokenholders dashboard: https://tokenterminal.com/explorer/metrics/tokenholders
Thank you for reading! All of the data presented in this article can be found for free on Token Terminal.
The authors of this content, or members, affiliates, or stakeholders of Token Terminal may be participating or are invested in protocols or tokens mentioned herein. The foregoing statement acts as a disclosure of potential conflicts of interest and is not a recommendation to purchase or invest in any token or participate in any protocol. Token Terminal does not recommend any particular course of action in relation to any token or protocol. The content herein is meant purely for educational and informational purposes only, and should not be relied upon as financial, investment, legal, tax or any other professional or other advice. None of the content and information herein is presented to induce or to attempt to induce any reader or other person to buy, sell or hold any token or participate in any protocol or enter into, or offer to enter into, any agreement for or with a view to buying or selling any token or participating in any protocol. Statements made herein (including statements of opinion, if any) are wholly generic and not tailored to take into account the personal needs and unique circumstances of any reader or any other person. Readers are strongly urged to exercise caution and have regard to their own personal needs and circumstances before making any decision to buy or sell any token or participate in any protocol. Observations and views expressed herein may be changed by Token Terminal at any time without notice. Token Terminal accepts no liability whatsoever for any losses or liabilities arising from the use of or reliance on any of this content.
Stay in the loop
Join our mailing list to get the latest insights!
Continue reading
Ecosystem metrics by metric type
The best chains build a mutually beneficial flywheel between the platform & its app ecosystem
The Fundamentals of Tron
A data-driven look into Tron’s onchain financials & alternative KPIs.
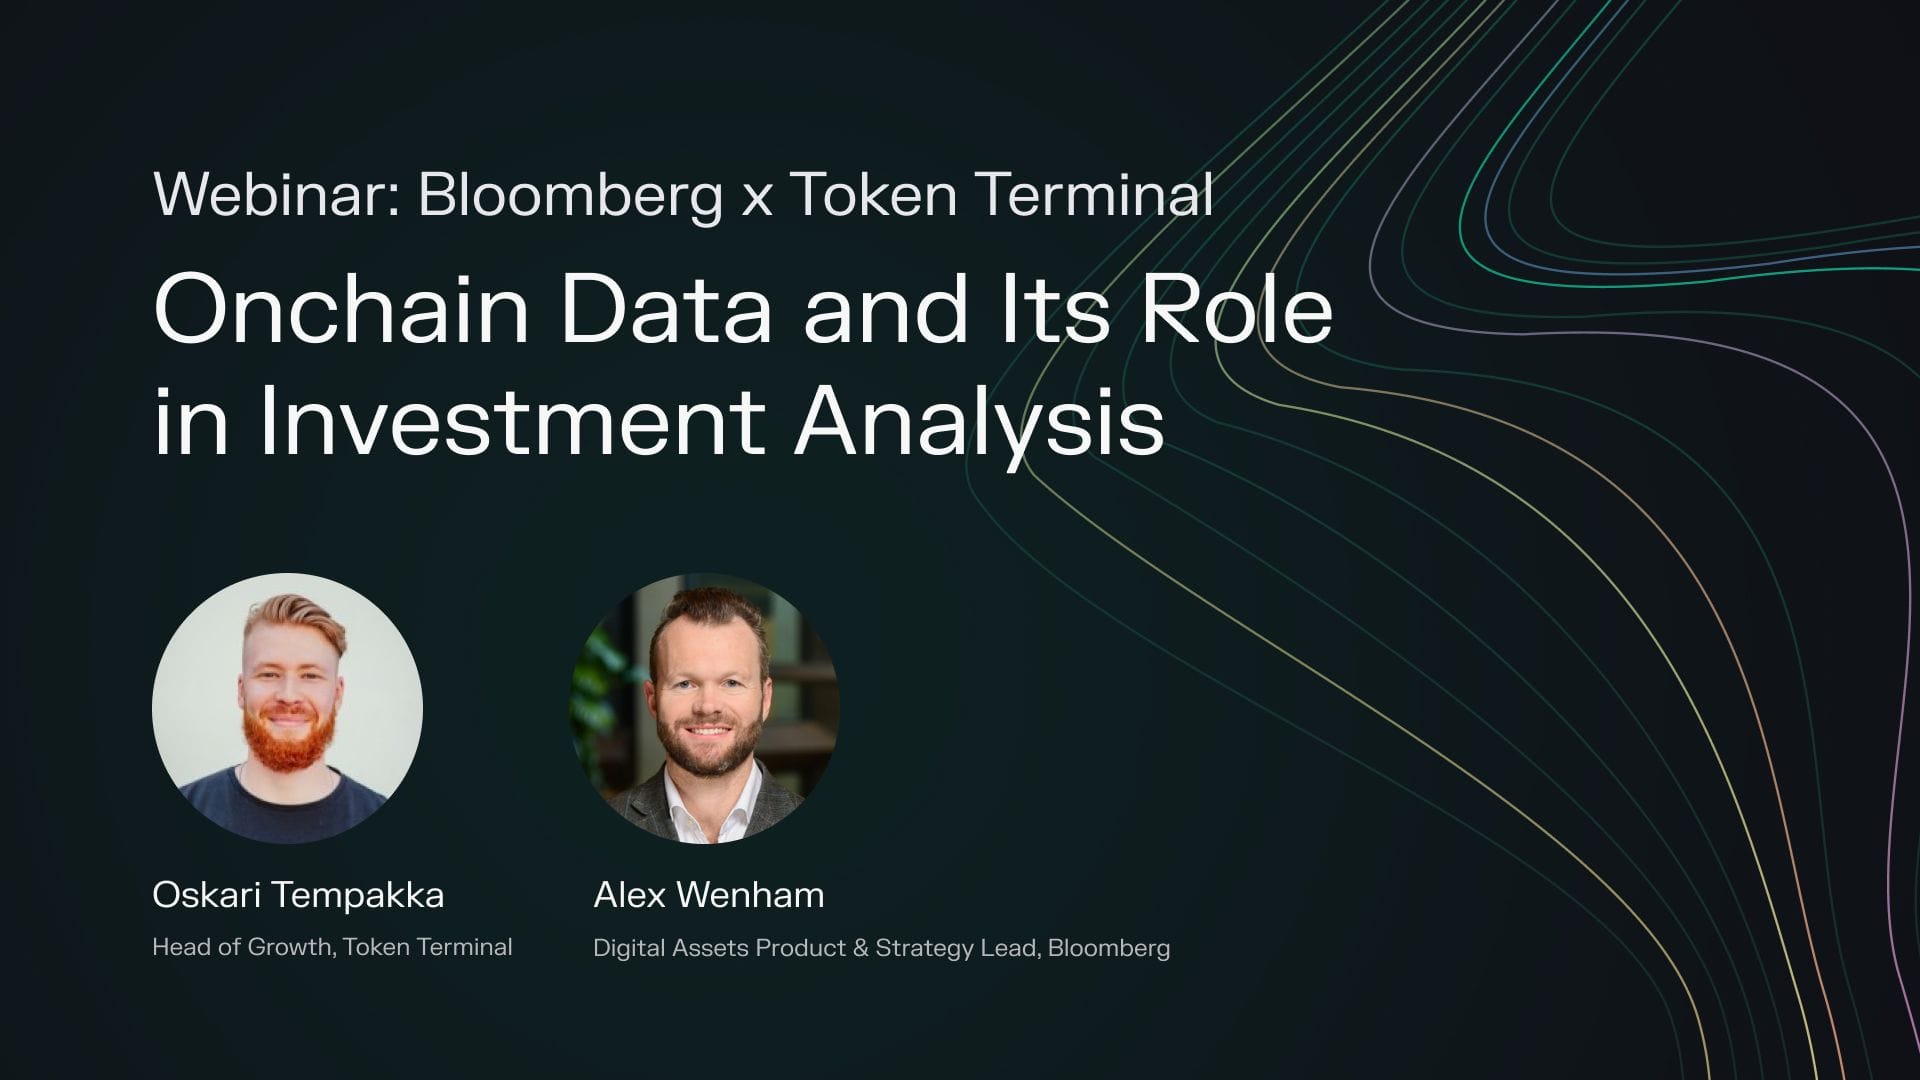
Bloomberg x Token Terminal: Onchain Data and Its Role in Investment Analysis
Tune in as Token Terminal and Bloomberg explore the relatively uncharted territory of onchain data. The team will talk about the sources and interpretation of this emerging form of financial data, it's unique characteristics, and how it fits into investor analysis.