We’re launching our new market sector pages to bring you a deeper level of data access in our public data platform. With these update market sectors pages, you can easily explore projects within a market sector, see trends for any metric across any market sector, and even see what activity is happening by chain within a market sector.
What’s New?
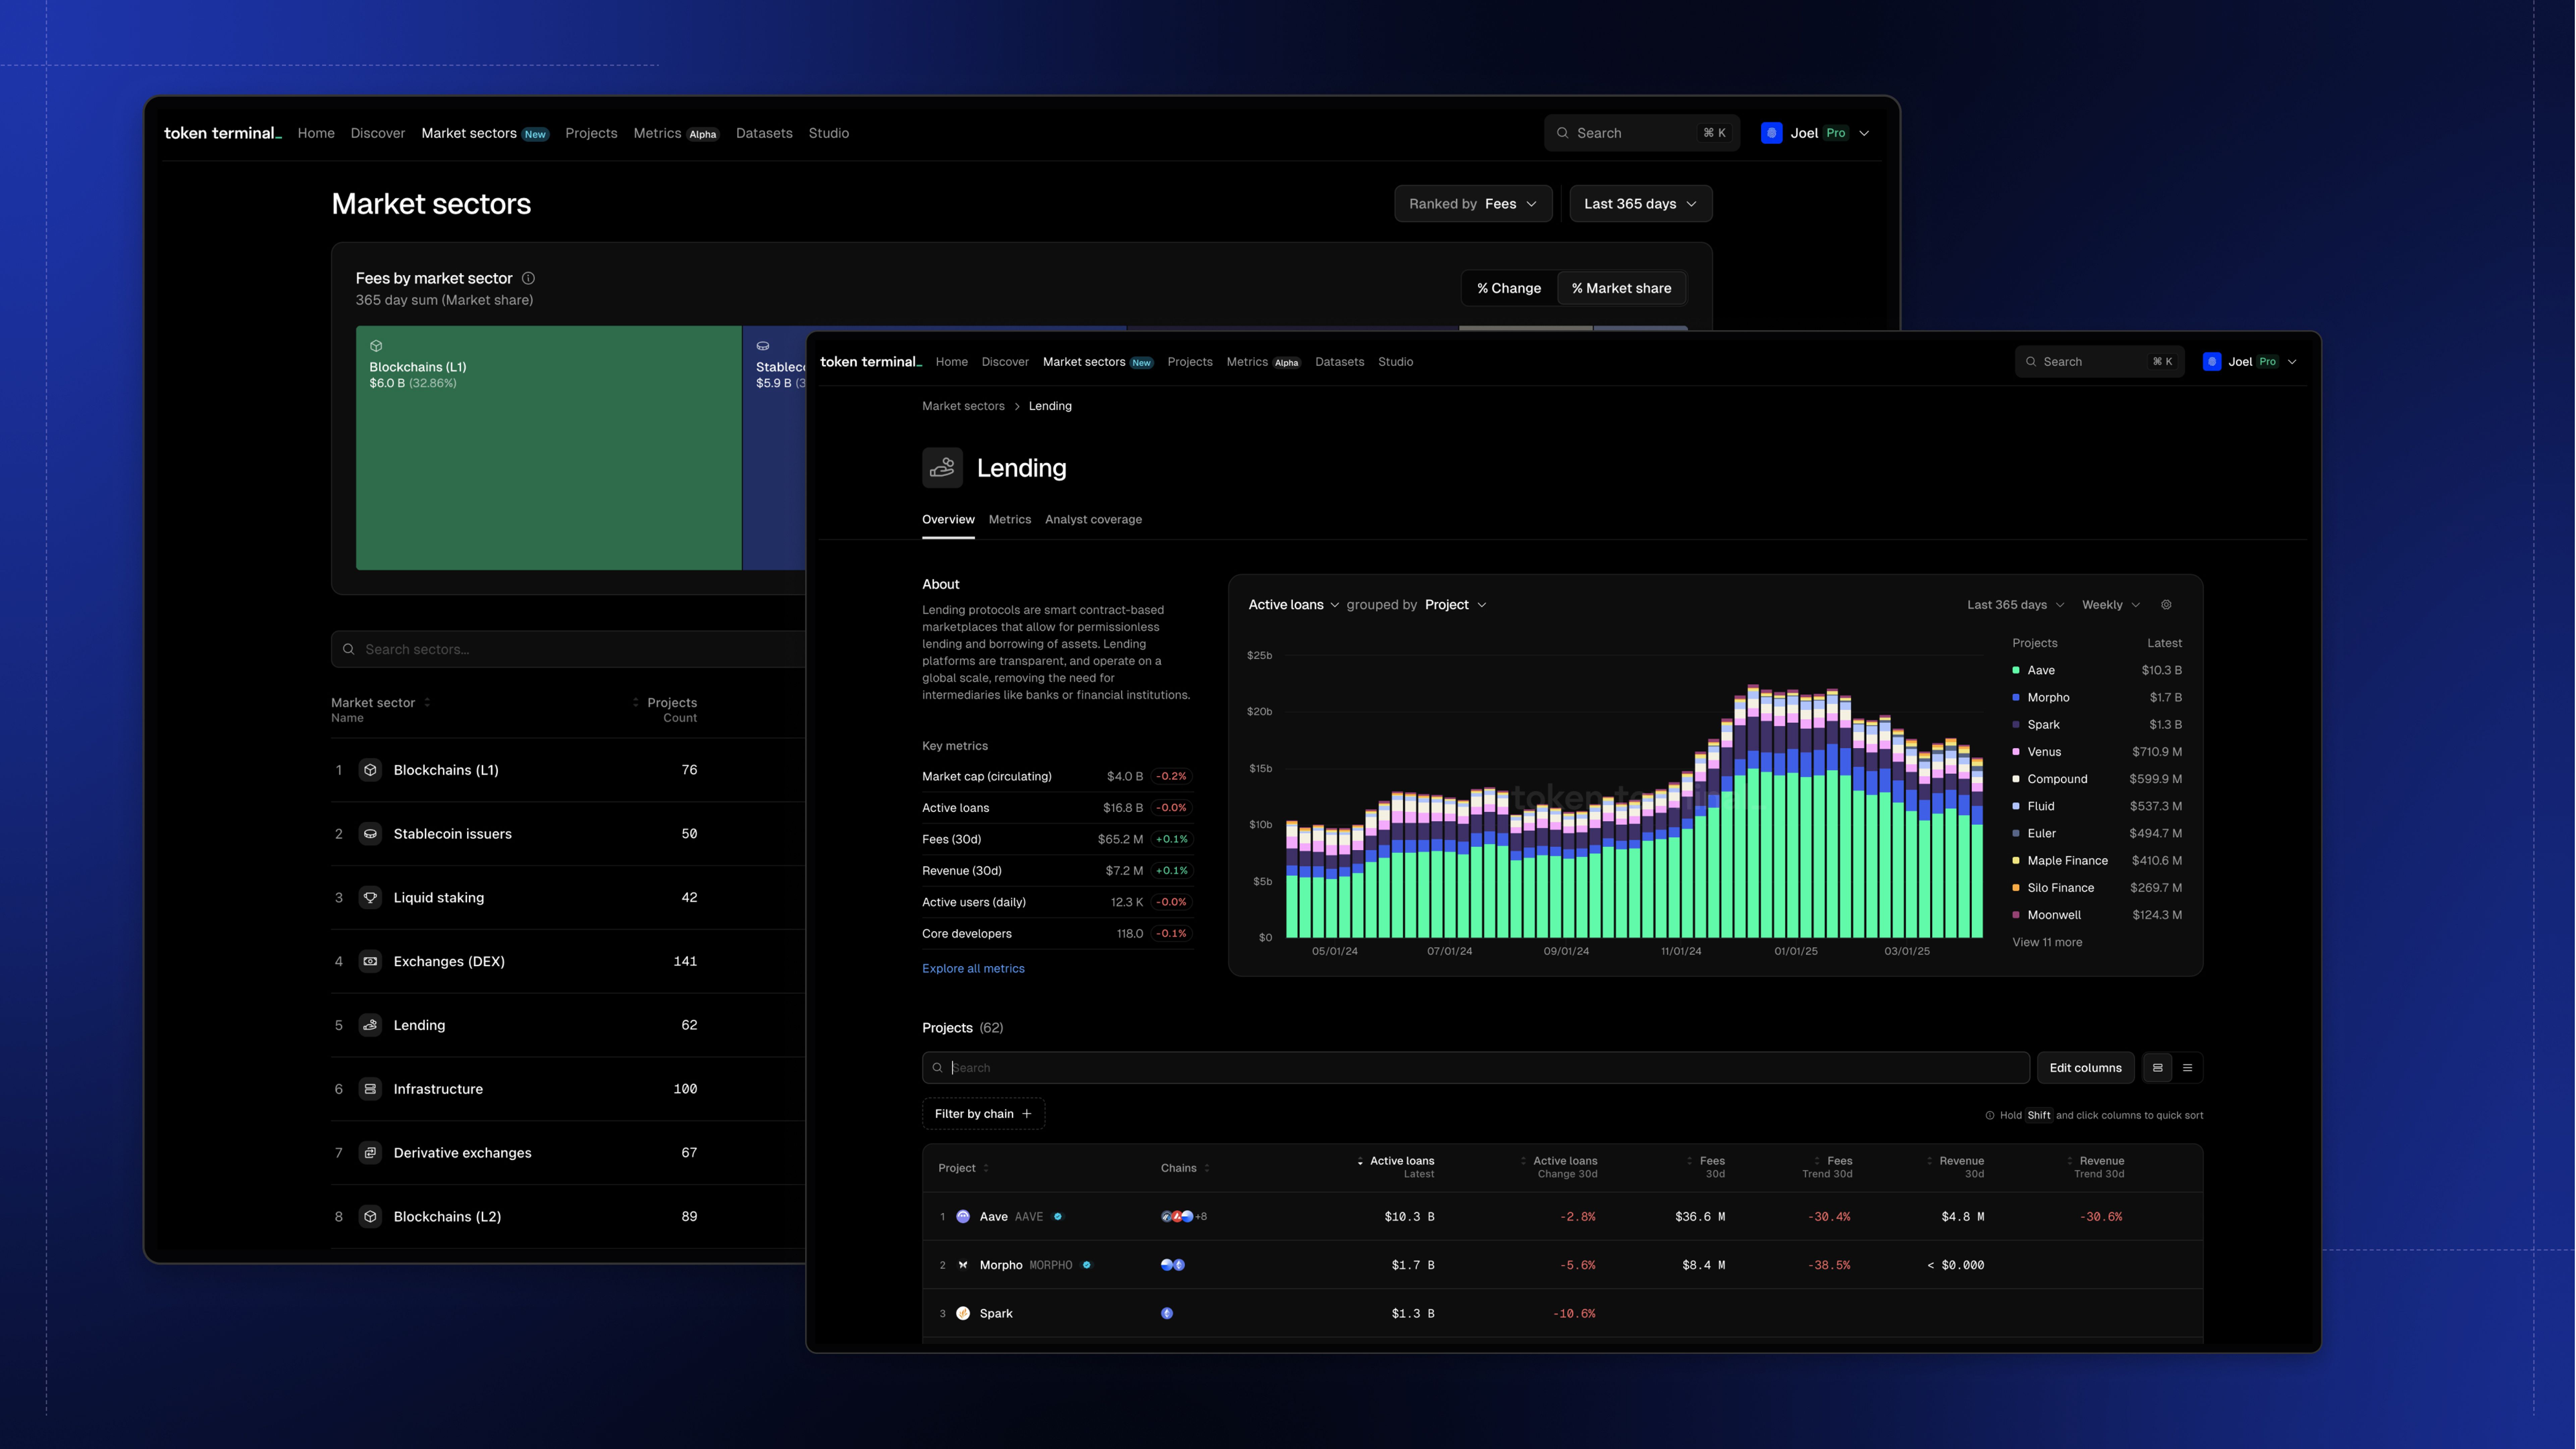
Updated market sectors page: With the new market sectors overview page, you can easily browse all of the market sectors on Token Terminal, seeing a quick count of projects as well as a quick comparison of any of the standardized metrics on Token Terminal. Zoom out or in to see long term or recent trends in standardized metrics like fees, total value locked, and more. Use our new market sector map to understand which market sectors stand out on any given metric, including their change over any interval of time.
New metric-dense market sector pages: With our updated market sector pages, you can now easily see which projects Token Terminal tracks in that market sector. Quickly see a breakdown of the top ten projects by any of our standardized metrics, and easily switch between viewing data by project or by chain.
Explore any metric in detail: For any metric, you can easily see the trend across the top projects by viewing the detailed metric page for just that market sector. Explore active loans for lending protocols or capital deployed in RWA issuers. See bridge deposits for L2 chains or trading volume of DEX platforms. Understand which projects and products are seeing the most growth with our new growth rate charts.
New Depth for Market Sectors on Token Terminal
As a data platform, we’re continually working on improving the ease and depth of access to the petabytes of standardized, onchain data that we’re tracking across hundreds of chains. Here’s how the new Market Sectors section of our app makes our data even easier to use:
Easily explore top protocols and dapps in any sector
- For any market sector, explore an easy to use table that lists out all of the included projects. When looking at any metric for that market sector, the tables are automatically sorted by the aggregate metric value to make it easy to see which projects or chain ecosystems are leading the way.
- For all metrics in our new market sector pages, we break the data visualization down into the top 10 projects for that metric and market sector. Easily see what’s driving growth for any sector by quickly viewing one of our new in-depth charts. Want to customize it more? Just open any chart in Studio!
See metrics broken down by project or by chain ecosystem
- For all metrics in a given market sector, we make it easy to switch between a project-based and a chain-based view, giving you insight into not only the protocols that are driving growth but also the chain ecosystems.
- Data visualizations and tables are both broken down into projects and charts, making it easy to discover not only growth rates and drivers at the protocol level but also which ecosystems are behind those trends. Easily save the charts or download data to create your own custom models.
Deeper Linking between Projects, Metrics, and Market Sectors
- Just like our recently updated project pages, our new market sector pages make it easy to navigate between content on Token Terminal. Want to view a specific project or chain within an ecosystem? Easily jump between projects, metrics, and market sectors with new deep links between pages.
- Explore related in-depth dashboards for a given market sector with our new Analyst Coverage tab. See project specific and market-sector related analysis from our Token Terminal community.
Get Started
To get started today, head over to our new market sector page or checkout some of the leading market sectors like L1 blockchains, lending, and decentralized exchanges.
Real World Assets Issuers Market Sector now available
With the launch of our new market sector pages, we’re also introducing a new market sector specifically focused on Real World Asset known colloquially as RWA Issuers. Major products at launch include BlackRock (BUIDL), Franklin Templeton (FOBXX), and Apollo(ACRED). We’re tracking standardized metrics like Capital Deployed as well as basic onchain metrics like active addresses and transaction counts.
Improvements and Bug Fixes
- ✨Pro subscribers can now download any table view from the Projects page including any customized columns that they add to the table. Pull your custom views into a CSV to update your own models. To download a table, click the gear icon in the upper right hand corner above the table and click “Download as CSV”
- ✨We introduced a group by “product” filter to projects with multiple product lines. Check out projects like Circle and Tether to see metrics broken down by product.
- 🧰We added sources and definitions for all metrics to our API for project-specific metric availability. When hitting the /projects/{project_id} endpoint, users will now receive an additional set of fields
- 🧰We updated the way that we filter by market sectors in charts and tables to ensure that we only list projects in their primary market sectors. For projects that might have multiple products in multiple market sectors, we’ll list each product within the market sector once product breakdowns are live in a few weeks.
- 🧰We updated our related news functionality to a custom scraper of highly reliable news sources for projects. New articles are scraped and updated daily.
- 🧰We updated the sort order of metrics across all categories to follow logical flows of the category. For instance, financial metrics are listed in order they contribute to the income statement with sales related metrics first (active loans, capital deployed, etc) and revenue and profits metrics coming later.
- 🧰We updated our self-service listing form to make it even easier to submit your project for a basic listing on any of our supported chains.
- 🧰We added an archived banner for projects where historical metrics remain relevant but no new data is being tracked. See Terra as an example of an archived project.
In the decentralized world of onchain businesses and investing, having access to detailed, standardized data is critical for making informed decisions. That’s why we’re excited to introduce our updated project pages, designed to help you more easily navigate the universe of onchain data available on Token Terminal.
What’s New?
Updated Projects page
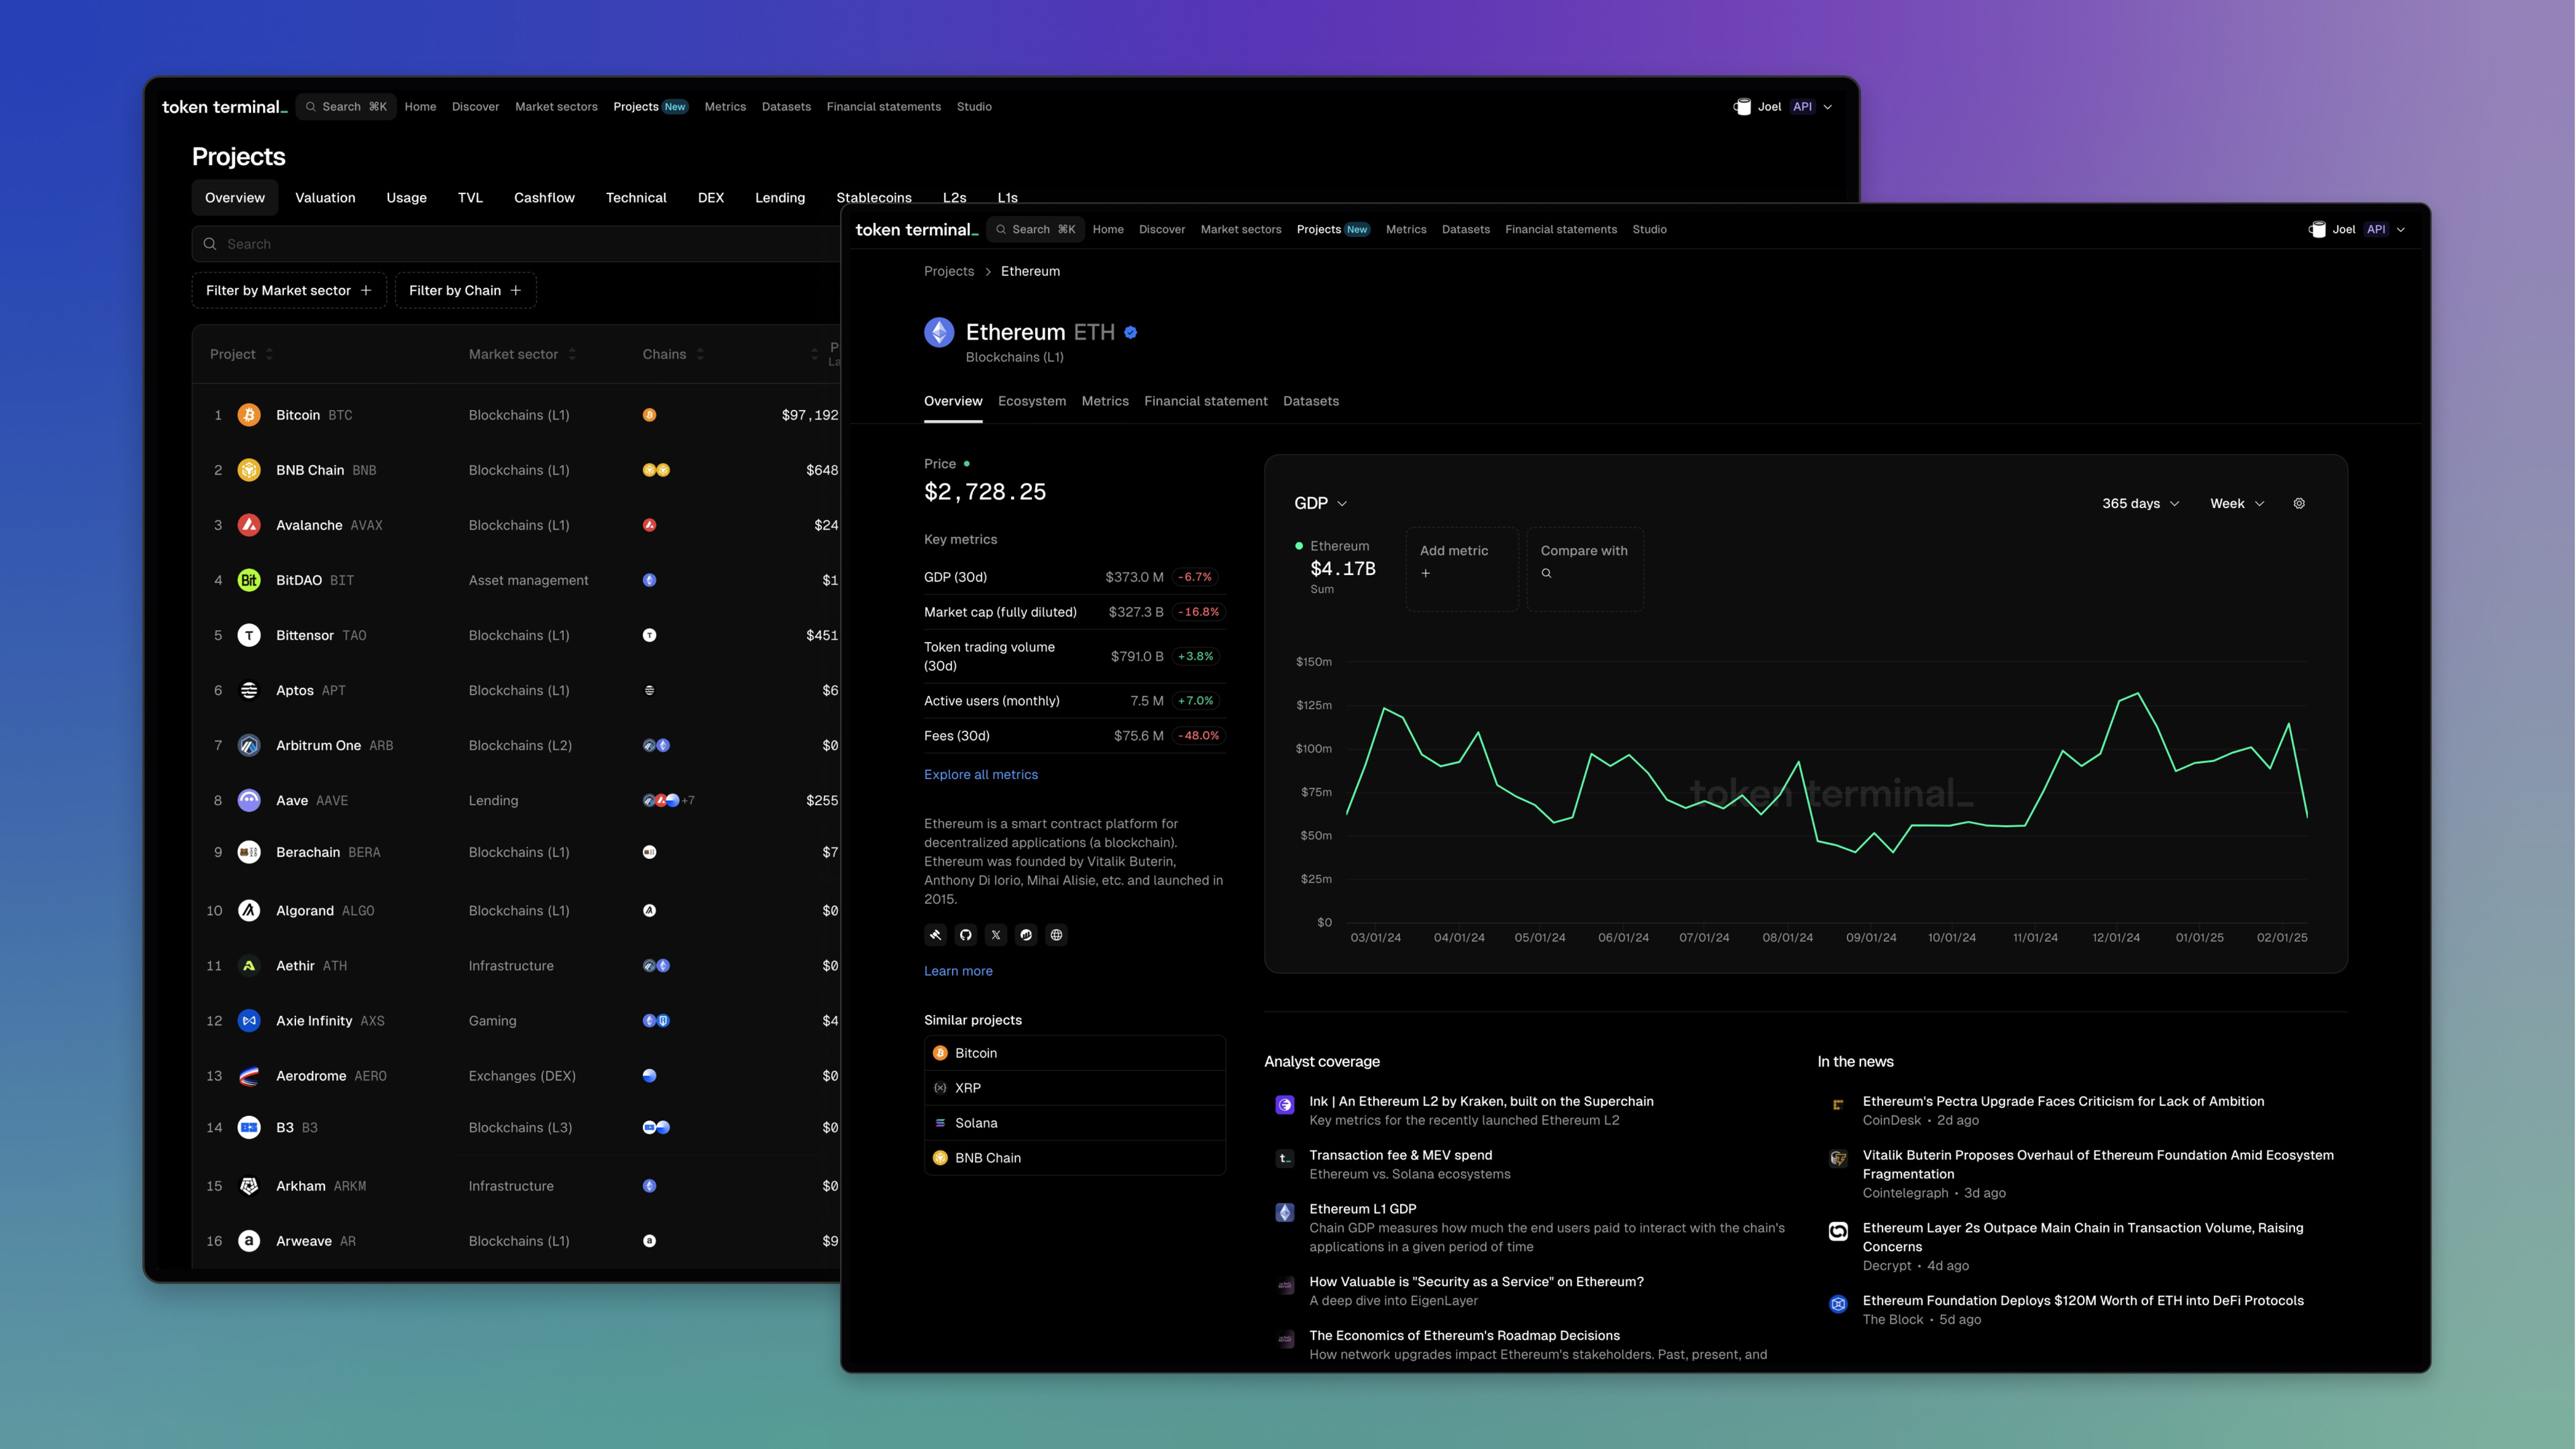
With our updated projects page, you can easily screen for the most up to date data on hundreds of projects across the crypto ecosystem. Want to see which L2 Blockchain generated the most fees in the last 30 days? Got it. Want to see which DEX had the most active user growth in the last 3 months? Got it. Want to find all of the lending protocols deployed on Base? Got it.
New metric-dense Project pages
With our new project pages, you can deep into any metric that you want to explore for any project. You can compare any single metric across multiple projects and even see how a project compares with the entire market sector. Easily navigate between related projects and chain ecosystems.
Ecosystem Metrics for Chains
For any chains with applications deployed, we’re now tracking ecosystem metrics to help you understand the broader economic activity on that chain. You can track key metrics across sectors like lending, stablecoins, and exchanges as well as our new GDP metric which tracks all fees generated on that chain by apps.
The Evolution of Projects on Token Terminal
As a data platform, we’re continually working on improving the ease and depth of access to the petabytes of standardized, onchain data that we’re tracking across hundreds of chains. Here’s how the new Projects section of our app makes our data even easier to use:
Improved Understanding of Project Rankings
- Filter and sort on Projects to easily understand which projects are performing highest and lowest across dozens of standardized metrics.
- For every project and every metric, quickly see how the project stacks up against the market sector, seeing where it ranks and linking off to similarly ranked projects.
Quick Comparisons with Projects and Market Sectors
- On the new overview tab, quickly look at any metric and compare that with other metrics for the project or quickly compare it with the same metric on another project.
- When looking at the All Metrics page for a project, you can quickly compare dozens of metrics to the whole market sector or a specific project. Also, you can breakdown and/or filter all data points by the chain where they happened.
- Quickly understand the market share of a metric that a project has for its whole market sector.
Deeper Linking between Projects, Metrics, and Market Sectors
- On the overview page as well as anytime rankings are included, you can easily navigate between projects, seeing the same metric for similar projects.
- Want to see the same metric page for another project? Just use CMD+K on Mac or CNTRL + K on Windows to pull up the command bar, search for another project and instantly see the same metric page for that project.
Centralized access to all Project Content
- Financial statements are now easily accessed within the project page. Easily see how the project has performed across dozens of metrics broken down by month, quarter, or year.
- Datasets like fundraises, trending contracts, and cohort analysis can also be quickly accessed for any project.
Get Started
To get started today, head over to our new project listing page or checkout some of the bluechip, onchain projects like Ethereum, Base, Aave, and Uniswap.
New Listings
Token Terminal Expands Data Coverage with 14 New Blockchains and Additional Protocol Integrations
Since the start of the year, Token Terminal has significantly broadened its data coverage by adding support for 14 new blockchains, including Unichain and Ink. See all the chain that Token Terminal supports here.
In addition to the expanded blockchain coverage, Token Terminal now also supports Seraph, Pharaoh, GMX, HoudiniSwap, Fluid, and Uniswap v4, enhancing our platform’s depth and utility for users.
Fixes and Updates
- ✨ Updated typography styles on dashboards to improve legibility
- ✨ Shipped a new sparkline component to improve precision and legibility
- ✨ Added Market Sector as a Group By option in Studio charts to make it easier to compare and see trends across whole market sectors.
- 🐛 Fixed a bug where quarters were changing based on user location (ah, timezones).
- 🐛 Fixed a bug with chain filtering in Studio so that chains are not shown when filtering by "Chain deployed on"
- 🐛 Fixed redirect issues across the Terminal app for some existing dead links that were causing some users to end up, unnecessarily, on 404 pages.
Introducing Token Terminal Teams: Real-Time Collaboration for Onchain Analytics
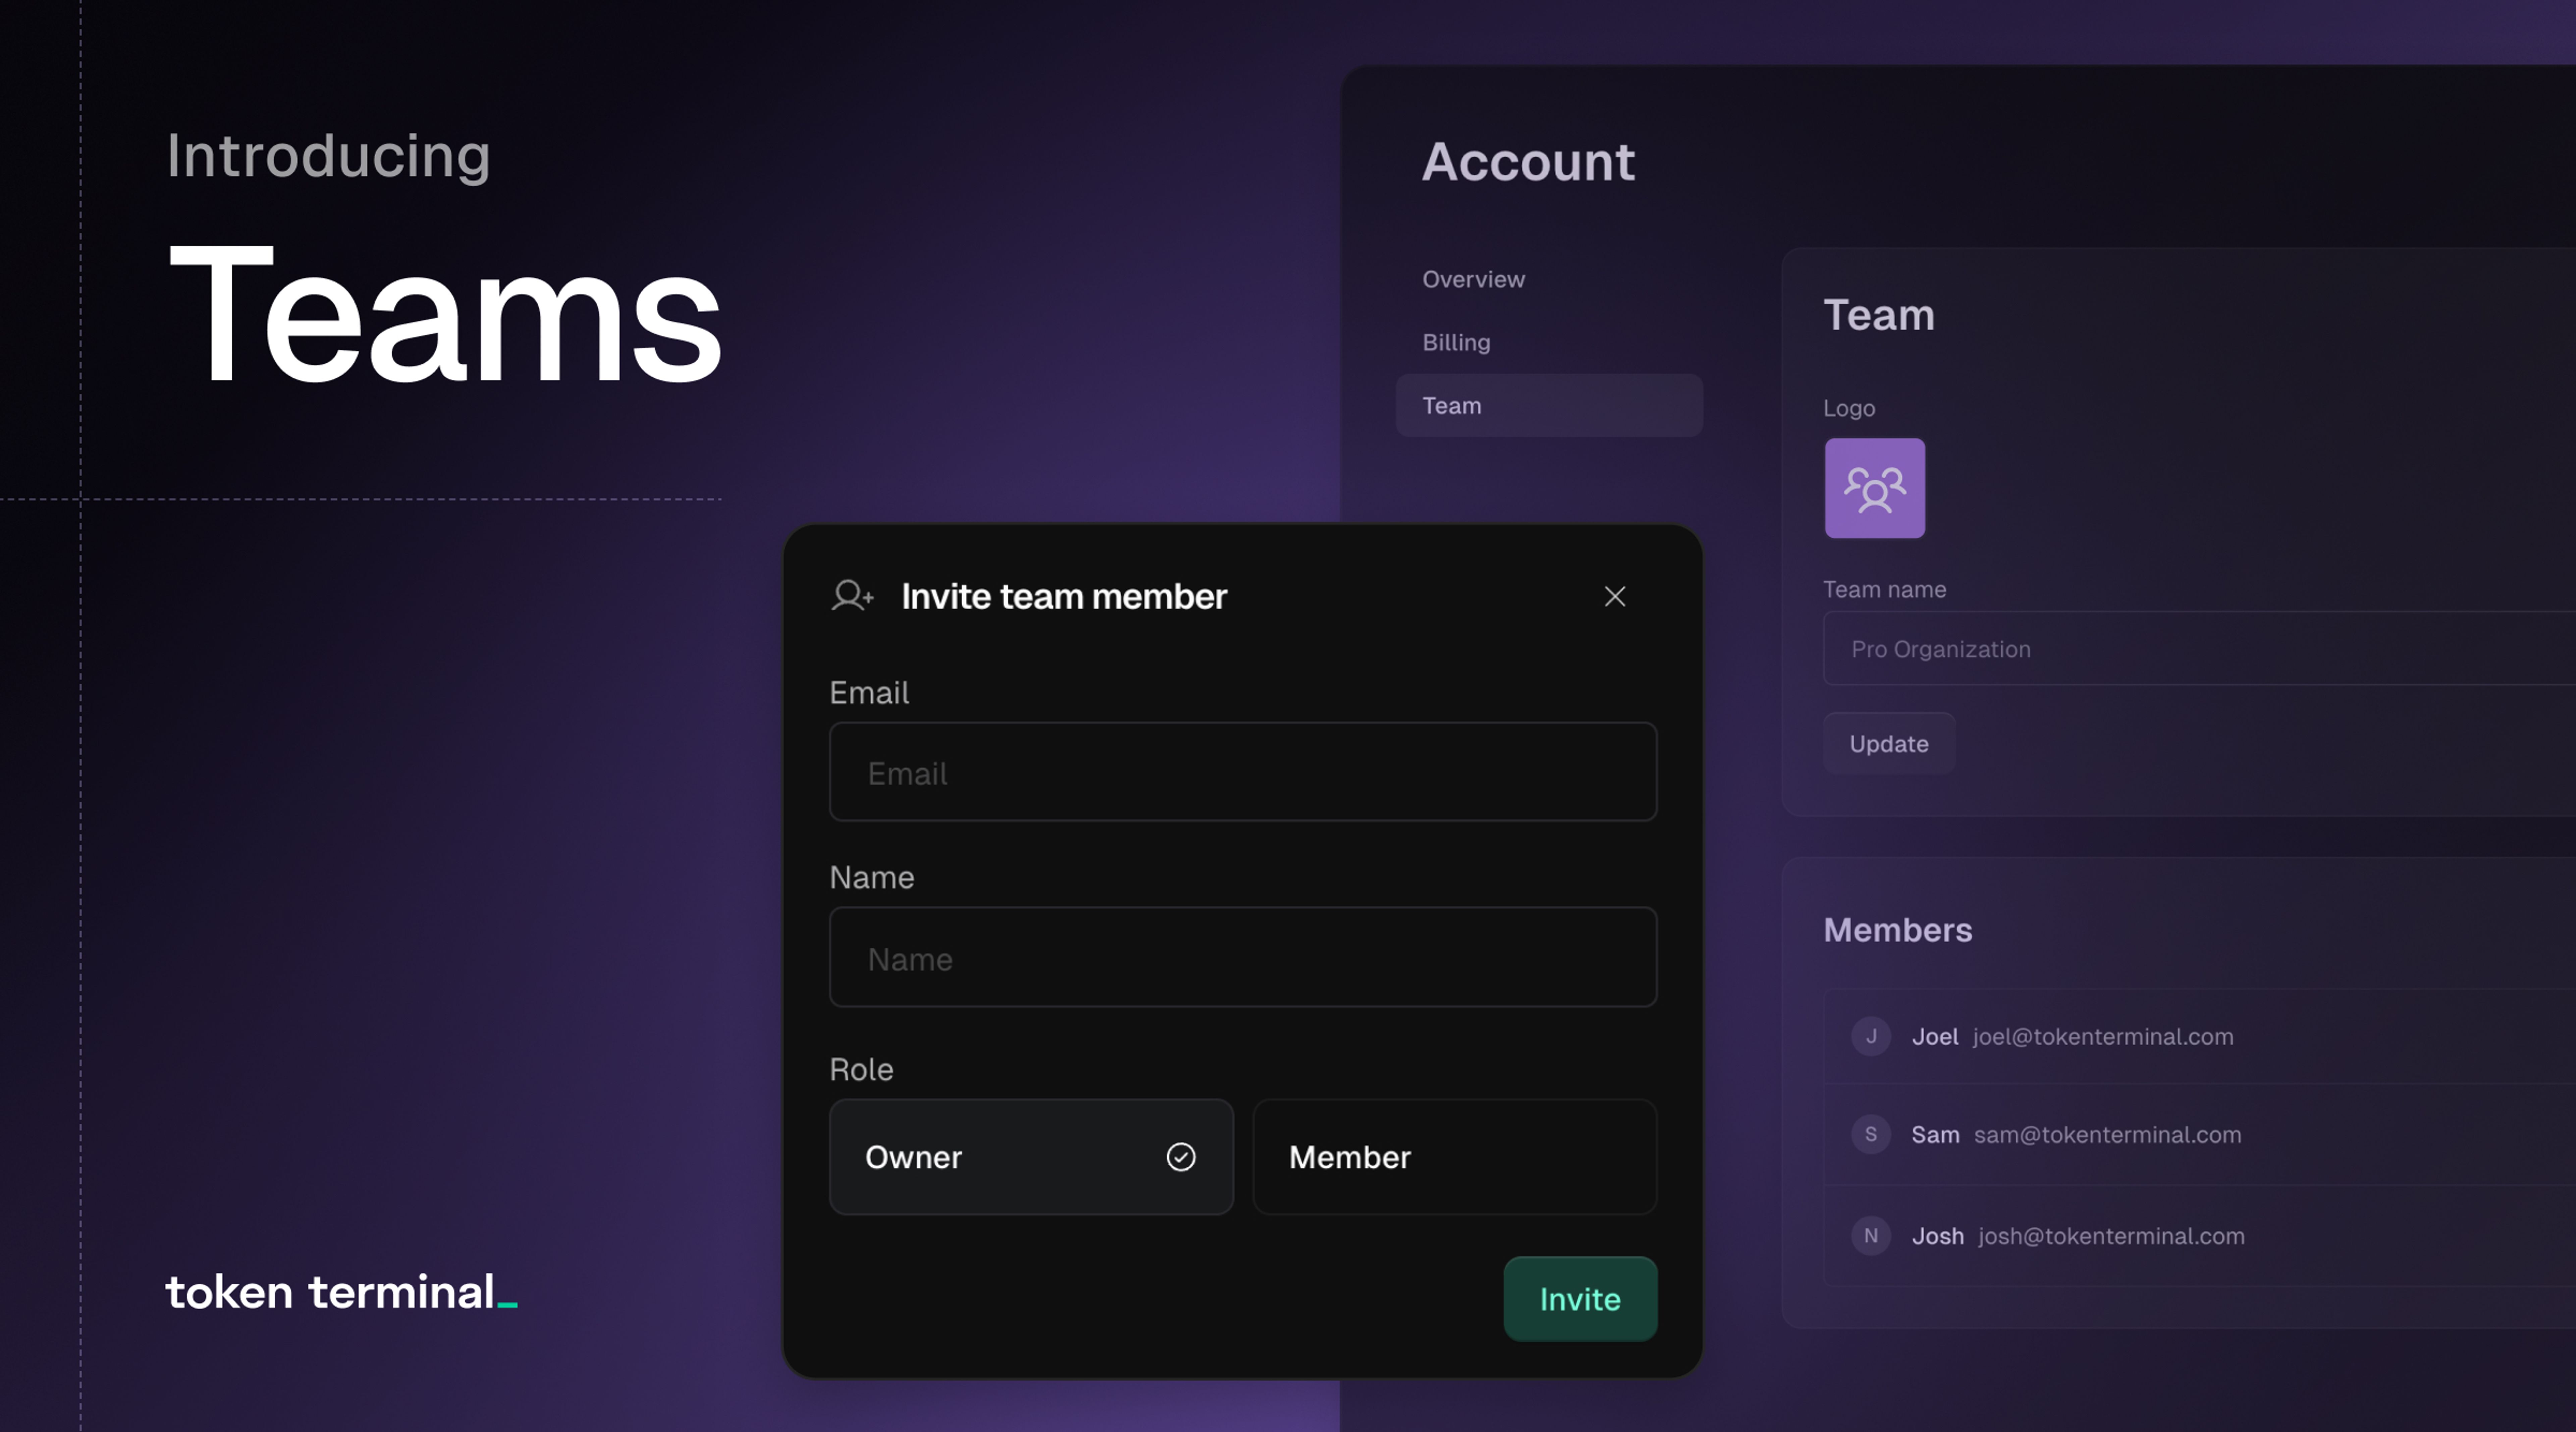
With Token Terminal Teams, entire investment and data analytics teams can now collaborate on custom dashboards in real-time, making onchain research more seamless than ever.
What this means for you: No more siloed research—teams can now work together on live dashboards, ensuring everyone stays aligned with the latest insights.
Get Going in Minutes
As a team admin, you can invite new members via email, manage permissions, and organize your team’s workspace—all in just a few clicks.
What this means for you: Setting up a collaborative research environment is fast and hassle-free, so your team can focus on investment analysis instead of admin tasks.
Collaborate on Onchain Analytics
With Teams, users can create and share custom dashboards in Studio, ensuring that everyone has access to the latest version and can build on each other’s work.
What this means for you: Keep your team in sync with shared dashboards and avoid outdated, disconnected analyses.
Manage Your Project Listing
Teams also empower core contributors of onchain projects to take control of their project listings on Token Terminal. Admins can edit and maintain project metadata and smart contract details, ensuring accuracy.
What this means for you: Project teams now have more control over how their data is represented, improving transparency and reliability.
Get Started with Teams Today
- Log in to your Token Terminal account
- Navigate to Manage Account via your profile
- Go to the Team tab and start inviting members
For full details, check out our documentation. We’re excited to see how Teams enhances your research workflow—let us know your feedback! 🚀
Introducing Token Terminal Studio: Custom Onchain Analysis Made Easy
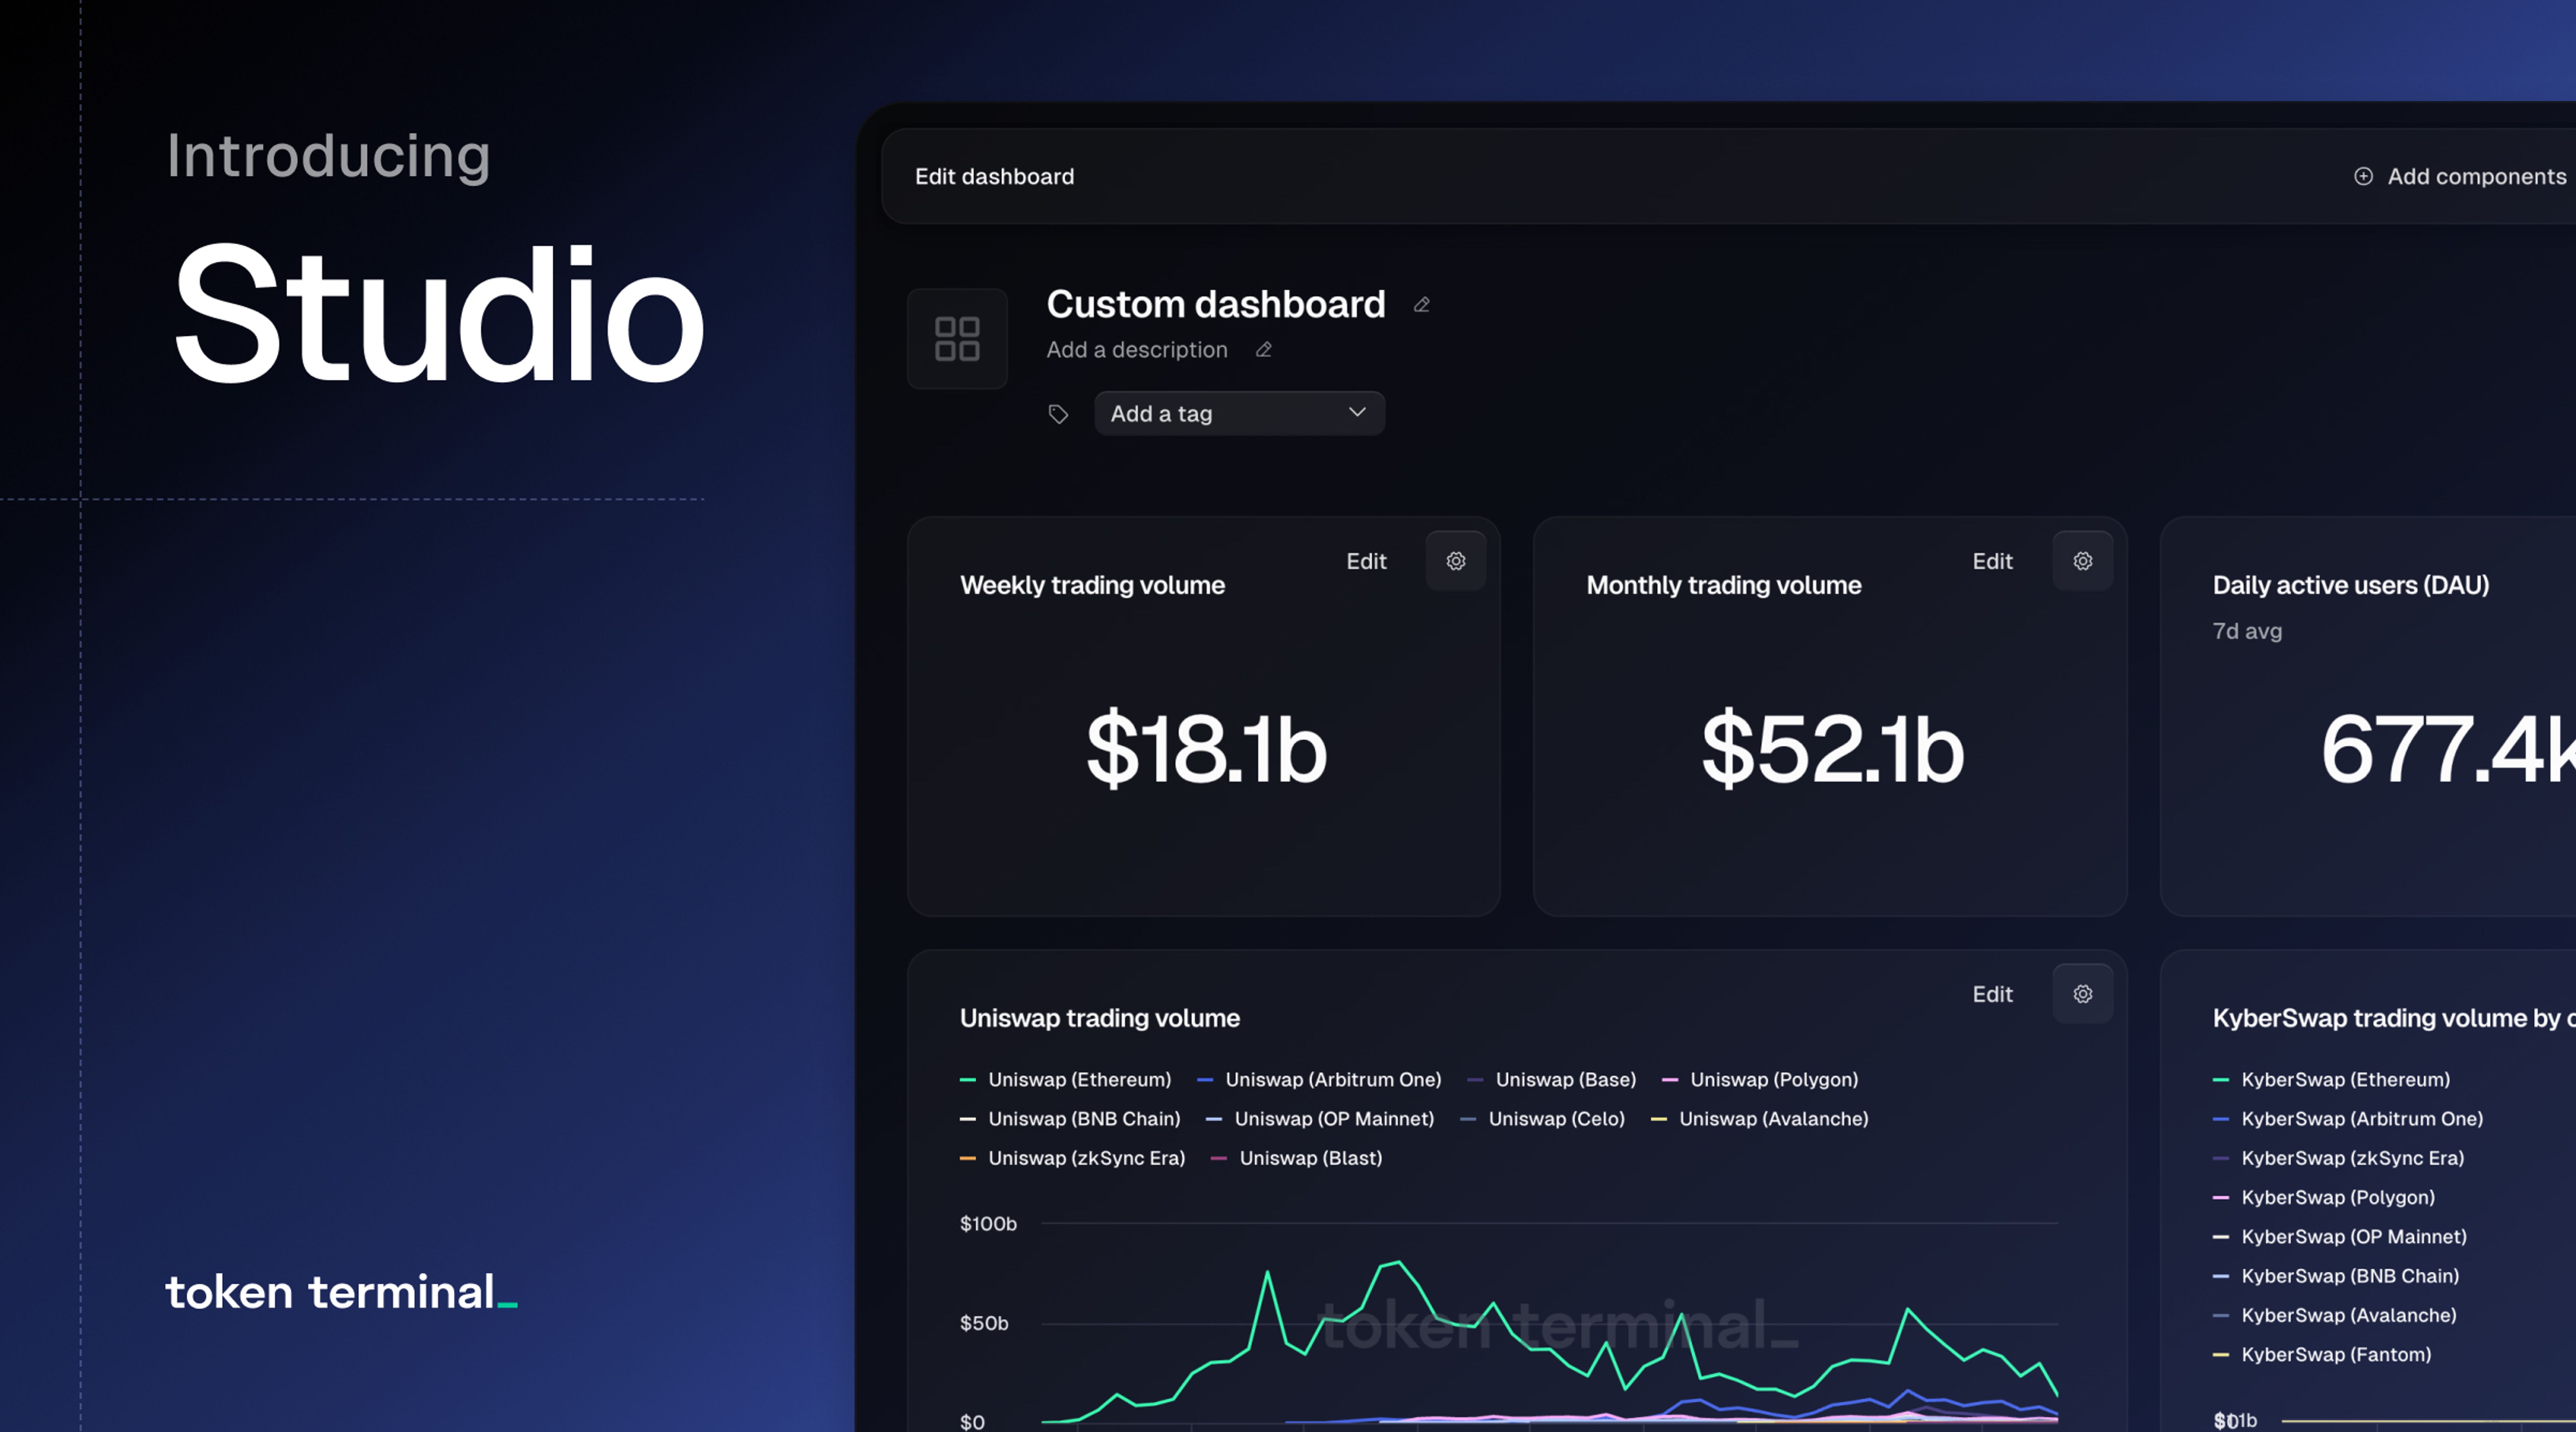
We’re excited to launch Token Terminal Studio, a powerful suite of tools that lets analysts create custom charts, data tables, and dashboards using Token Terminal’s onchain data.
What this means for you: You now have the flexibility to analyze data your way—customizing visualizations, dashboards, and insights to fit your specific research needs.
Create Custom Charts and Data Tables
Studio allows analysts to go beyond standard visualizations by enabling custom charts and data tables. You can track multiple metrics across hundreds of projects and tailor the display to match your use case.
What this means for you: No more one-size-fits-all charts—now, you can slice and dice onchain data exactly how you need it.
Build Custom Dashboards for Deeper Insights
With Studio, you can organize your analysis into high-performance dashboards, combining multiple charts, data sets, and qualitative insights for a richer research experience.
What this means for you: Whether you’re tracking a single project or an entire sector, you can create cohesive dashboards that make complex data easy to understand. Plus, you can export everything to Sheets or Excel for further analysis.
Share Your Research with the Community
Token Terminal’s Discover page showcases research from top analysts across the industry. You can reach out to our team to share your insights, helping build your reputation while delivering valuable research to leading crypto investors and entrepreneurs.
What this means for you: Gain visibility, contribute to the industry conversation, and establish yourself as a trusted voice in onchain analytics.
Get Started with Studio
- Sign up for a Token Terminal account
- Explore Studio by navigating to the “Studio” tab
- Create your first custom charts and dashboards
✅ Pro & API users: Unlimited access to charts and dashboards
✅ Free users: Create up to three charts and dashboards
For detailed guidance, check out our updated documentation. We can’t wait to see what you build with Token Terminal Studio—let us know your thoughts! 🚀
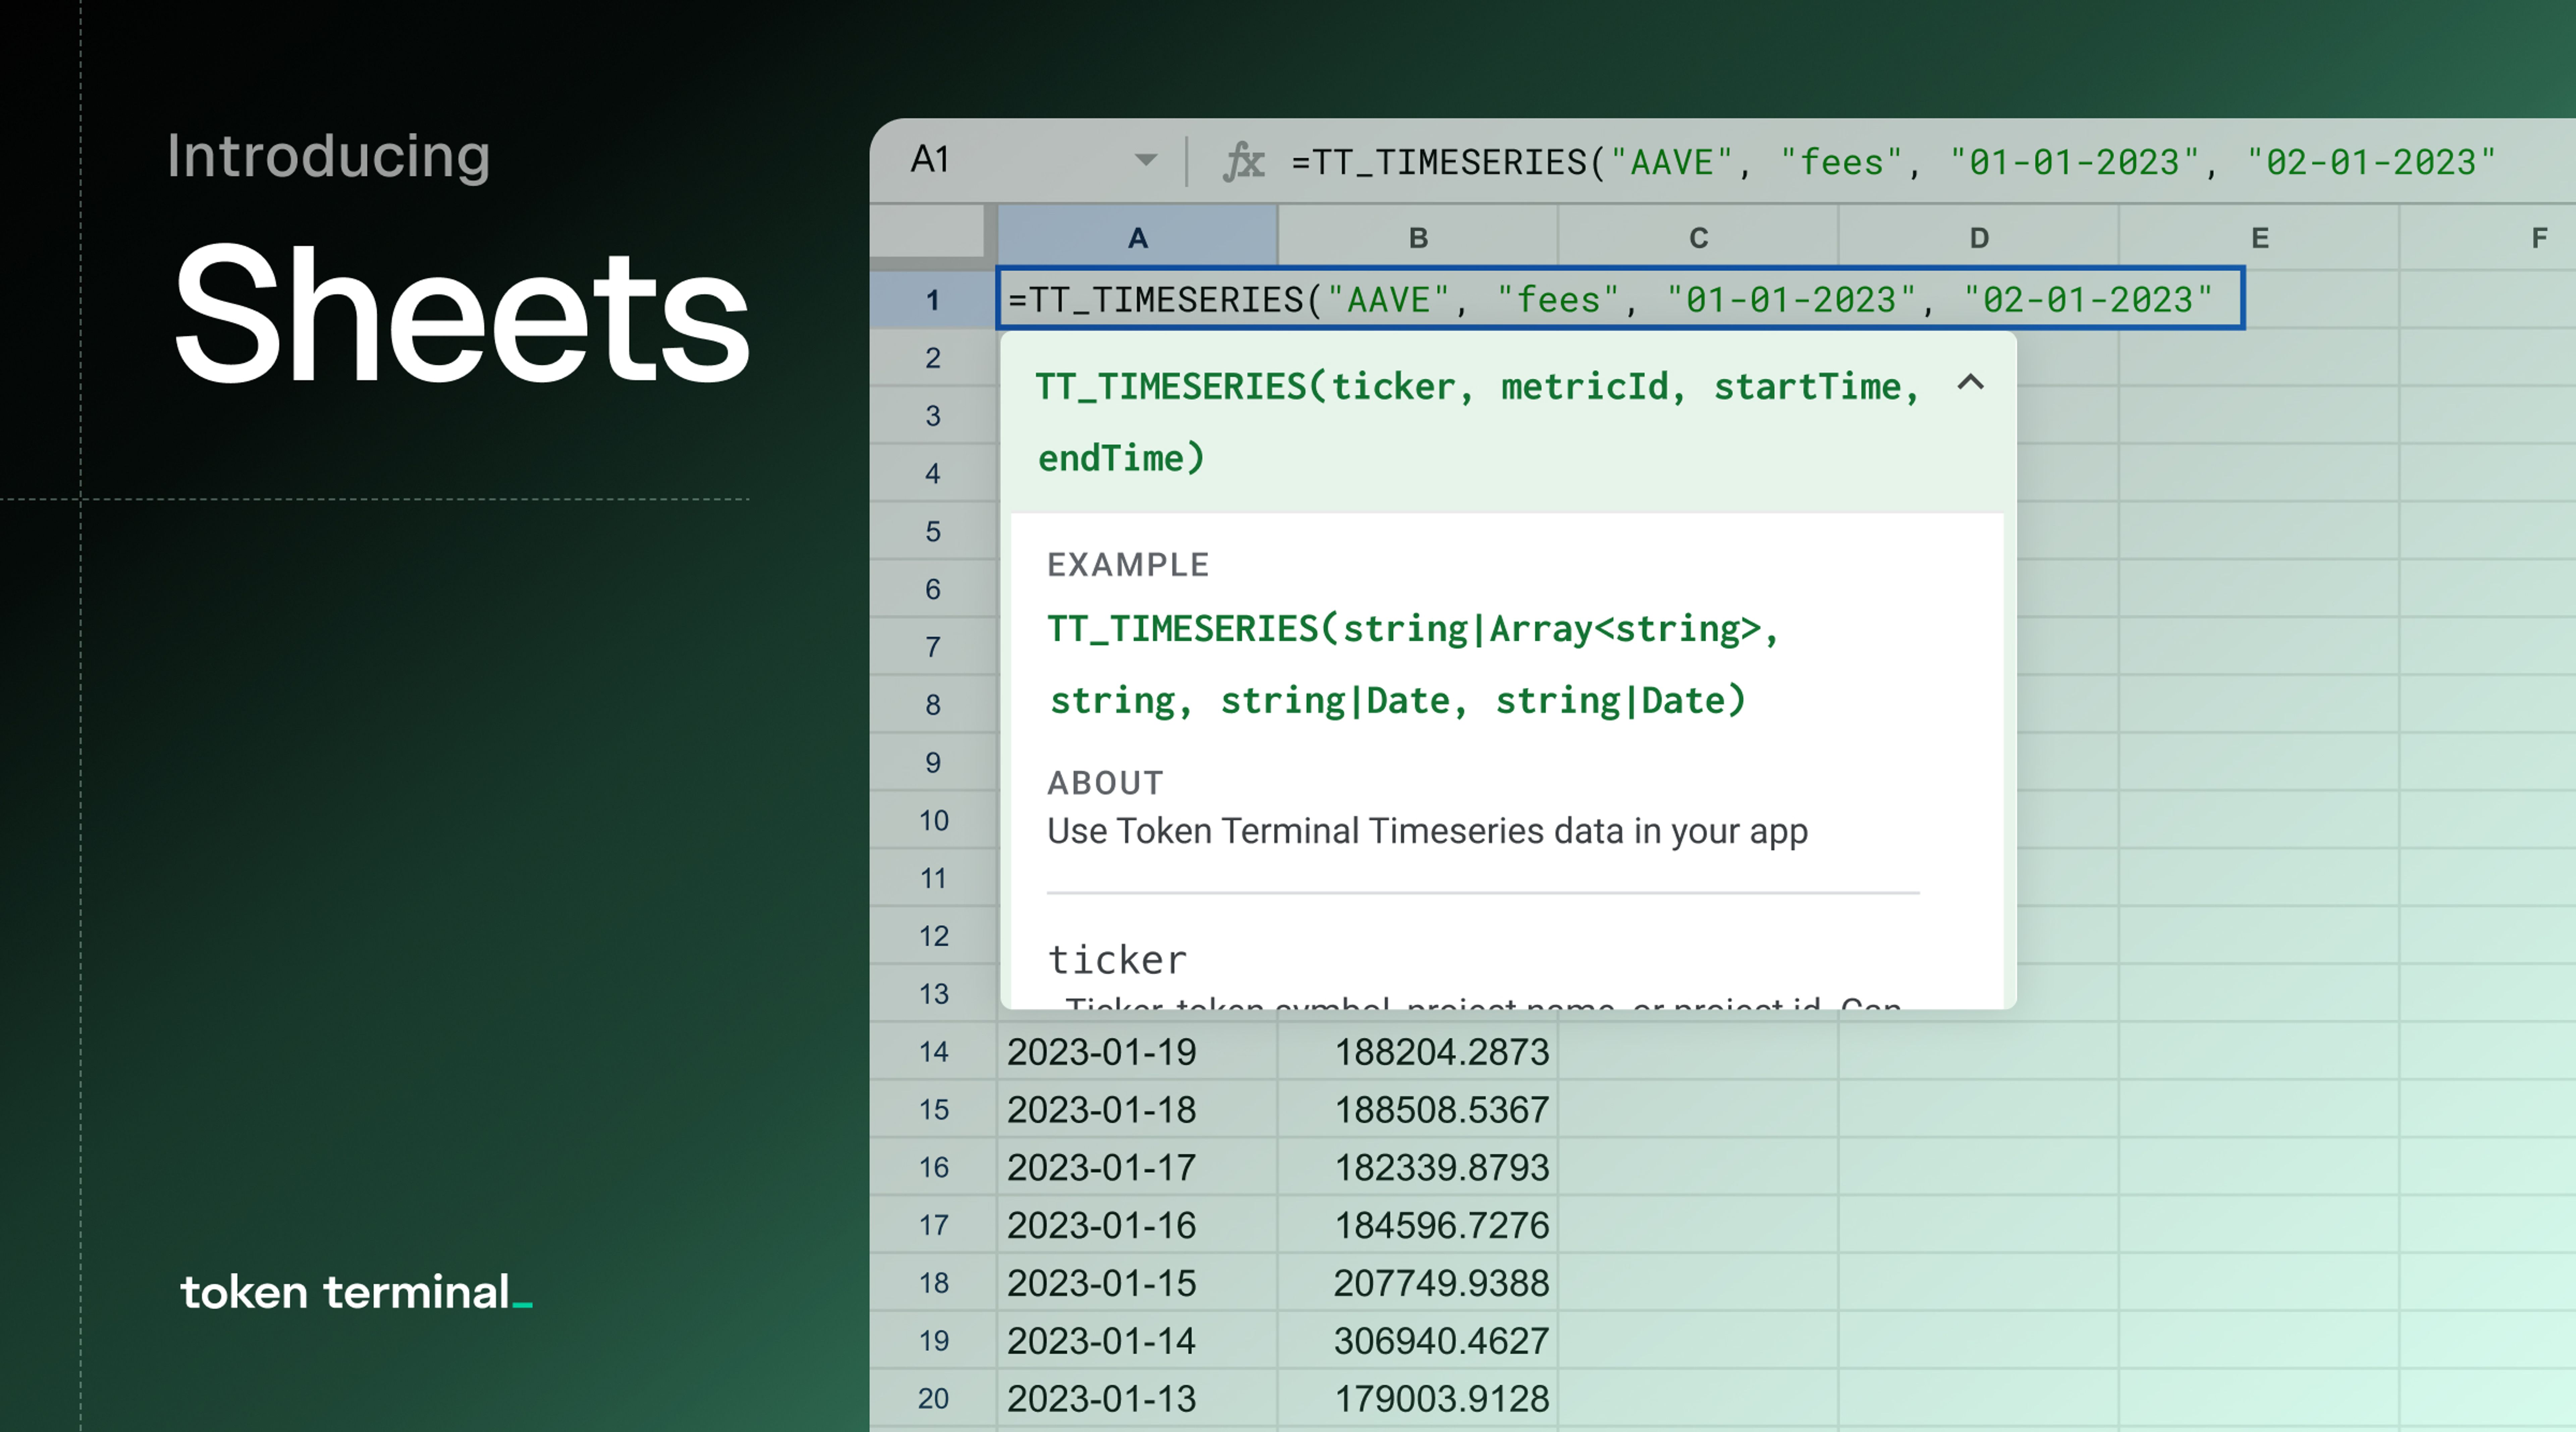
Introducing Token Terminal Sheets
We’re thrilled to launch Token Terminal Sheets, a Google Sheets & Microsoft Excel plug-in that brings all Token Terminal datasets directly into analysts’ spreadsheet workflows.
What this means for you: Now, you can seamlessly integrate onchain data into your financial models, eliminating the hassle of manual data entry and enabling real-time updates.
Leverage Existing Workflows for Onchain Analytics
The new plug-in allows analysts to embed standardized onchain data directly into Google Sheets or Microsoft Excel. This means you can create, improve, and maintain dynamic analytics dashboards without switching tools.
What this means for you: You can work within your existing spreadsheet setup while tapping into real-time financial metrics across hundreds of projects.
Eliminate Time Spent on Manual Data Collection
Token Terminal Sheets automates onchain data updates, giving analysts instant access to real-time and historical metrics.
What this means for you: No more repetitive manual data aggregation—just up-to-date insights at your fingertips.
Double Down on Investment Research & Analysis
By reducing the time spent on data collection, analysts can focus on what really matters: investment research and insight generation.
What this means for you: More time for deep analysis, better financial models, and more informed investment decisions.
Get Started with Token Terminal Sheets (Beta)
The plug-in is available in beta for all Free, Pro, and API users, with rate-limited access based on your subscription level.
Google Sheets: Install the add-on from the Google Workspace Marketplace and link it to your Token Terminal account.
Microsoft Excel: Install the add-on from the AppSource Marketplace and log in with your credentials.
Documentation: Check out our docs for function usage, spreadsheet templates, and best practices for building dashboards.
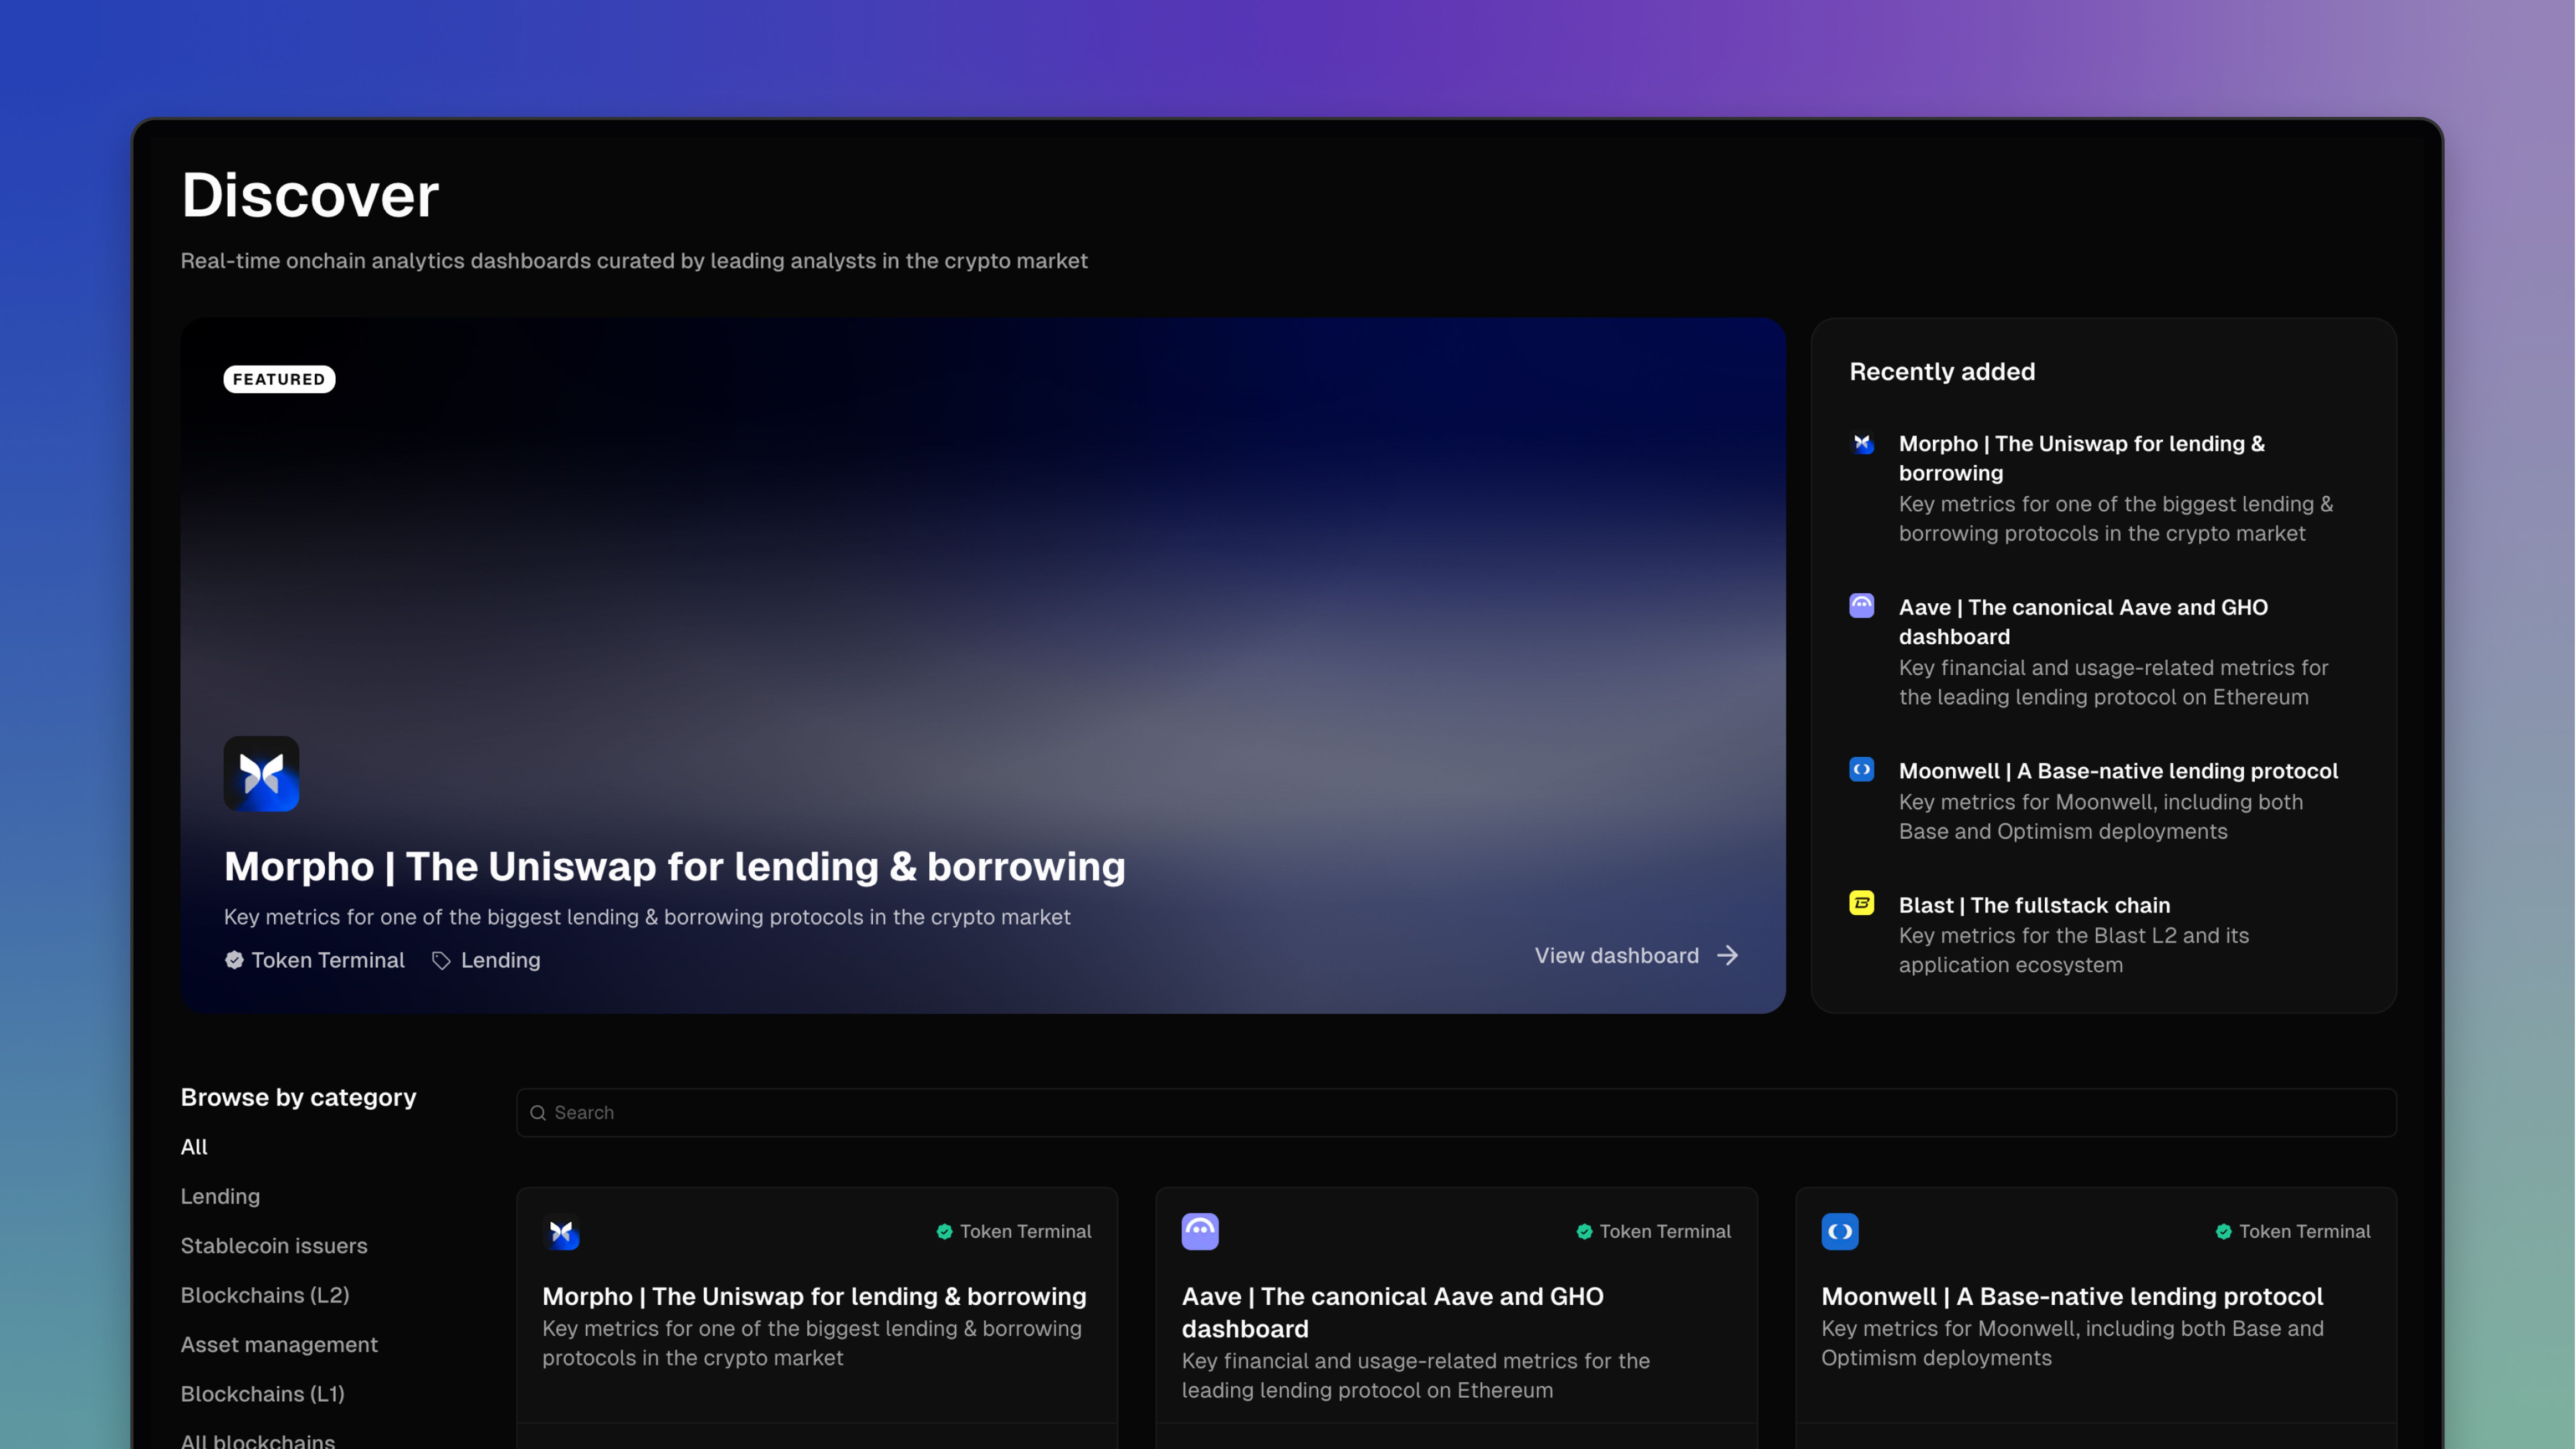
We're excited to announce the launch of the brand new Discover page in Token Terminal! The Discover page serves as your launchpad for exploring a curated collection of dashboards created by our expert team and community of analysts.
As we continue to build out our library of analysis reports on the most interesting ideas and trends in crypto, the Discover page will help investors and operators alike navigate the complex world of data surrounding the biggest crypto projects and market segments with ease and confidence.
The dashboards on the Discover page provide deep insights into important crypto projects and market segments, allowing you to understand the fundamentals of projects as well as to find new and interesting opportunities. Whether you're looking to understand the latest DeFi protocols, analyze NFT marketplaces, or track the performance of layer-1 blockchains, the Discover page has you covered.
With this new feature, you can:
- Quickly access pre-built dashboards tailored to specific crypto sectors
- Gain instant insights into project performance and market trends
- Compare multiple projects or segments side-by-side
Read our full announcement on our blog here:
Ready to find your next best idea? Visit our Terminal now and click on the new "Discover" tab in the main navigation menu. Don't have an account yet? Sign up today to start exploring the wealth of insights waiting for you on our new Discover page!
New Project Listings
In addition to all the stablecoin projects and metrics we added this summer, we’ve continued our trend of listing new and emerging projects to Token Terminal using our new basic listing format.
- The Arena: a SocialFi app built on Avax.
- Eragon: an Aptos-native development and distribution platform for web3 mobile games
- Merkle Trade: a perpetual DEX built on Aptos
- Wapal: an Aptos-native NFT launchpad and marketplace
- Chingari: ab Aptos-native SocialFi app with ~2 million monthly active addresses
- Optoptia: an AI-driven, intent-centric L2 network that allows permissional intent creation
- StarryNift: an AI-powered 3D social network with ~55k daily active addresses
- Planet IX: is a Polygon native NFT-based strategy game
- Wild Forest: a Ronin-native PVP strategy game
- Fenix: a decentralized exchange on Blast
- zkLend: a money market protocol built on Starknet
- Wasabi: a leverage trading protocol built on Blast
- Seamless: a Base-native decentralized lending and borrowing protocol.
- Shrapnel : a moddable extraction shoot game built on Avalanche.
- Colony: a platform for decentralized fundraising built on Avalanche
- Nostra: a DeFi super app built on Starknet
- Ekubo: a decentralized exchange built on Starknet
- Extra Finance: a lending and yield farming protocol build on Optimism and Base.
- Fuul: an affiliate marketing protocol built on Arbitrum.
- Dolomite: a lending protocol built on Arbitrum
- Socket: a chain abstraction protocol that allows developers to compose with any app, user, an asset across rollups.
- Stryke: an options trading protocol build ton EVM-based chains
- Woo: a trading platform built on EVM-based chains
Enhancements & Bug Fixes
- ⚒️We updated custom charts and dashboards to give free users a default view of 365 days of data for all charts set to max view.
- 🎨We moved our account settings to their own page to ensure we can scale additional settings for users and teams.
- 🎨We added custom color selection to our Custom Chart beta.
- 🐛We fixed an issue where some data was showing as a zero instead of not-available
- 🐛We fixed an issue where some composition charts were not rendering correctly based on the metric that was selected.
- 🐛We fixed an issue where some data was showing as a zero instead of not-available
- 🐛We fixed an issue expanded view charts were not correctly displayed based on the original settings.
While summer’s wrapping up, we’re happy to share some of the work our data and integration teams have been doing over the summer. Between new basic metrics and a whole host of new project listings, the data we cover at Token Terminal continues to get both wider and deeper. Read on for what’s new!
New Onchain Metrics
We are excited to announce the addition of five powerful new metrics to our platform, now available for projects listed on Token Terminal. These new onchain metrics offer deeper insights and a more comprehensive understanding of project performance and user engagement. By leveraging Token Terminal's vertically integrated data pipeline and carefully curated smart contract labels dataset, we can provide these easily understandable metrics that act as proxies for protocol usage. Let’s run through these new metrics:
1. Gas used
The Gas used metric tracks the amount of gas consumed when users interact with your project’s labeled smart contracts, with values denominated in USD based on the daily price of the gas token. It aggregates the USD value of all gas used in transactions involving the project’s labeled smart contracts, using purely onchain data combined with the Token Terminal smart contracts label dataset. This metric acts as a proxy for contract usage and user willingness to pay for contract operations, offering valuable insights into cost efficiency when analyzed alongside the Transaction Count (contracts) metric.
2. Transaction count (contracts)
This metric measures the number of transactions made to the project’s labeled smart contracts, calculated based on the number of onchain transactions where the "to" address is the project’s contract. Sourced purely from onchain data and the Token Terminal smart contracts label dataset, it serves as a proxy for onchain activity, helping to identify high-level trends and patterns within the protocol.
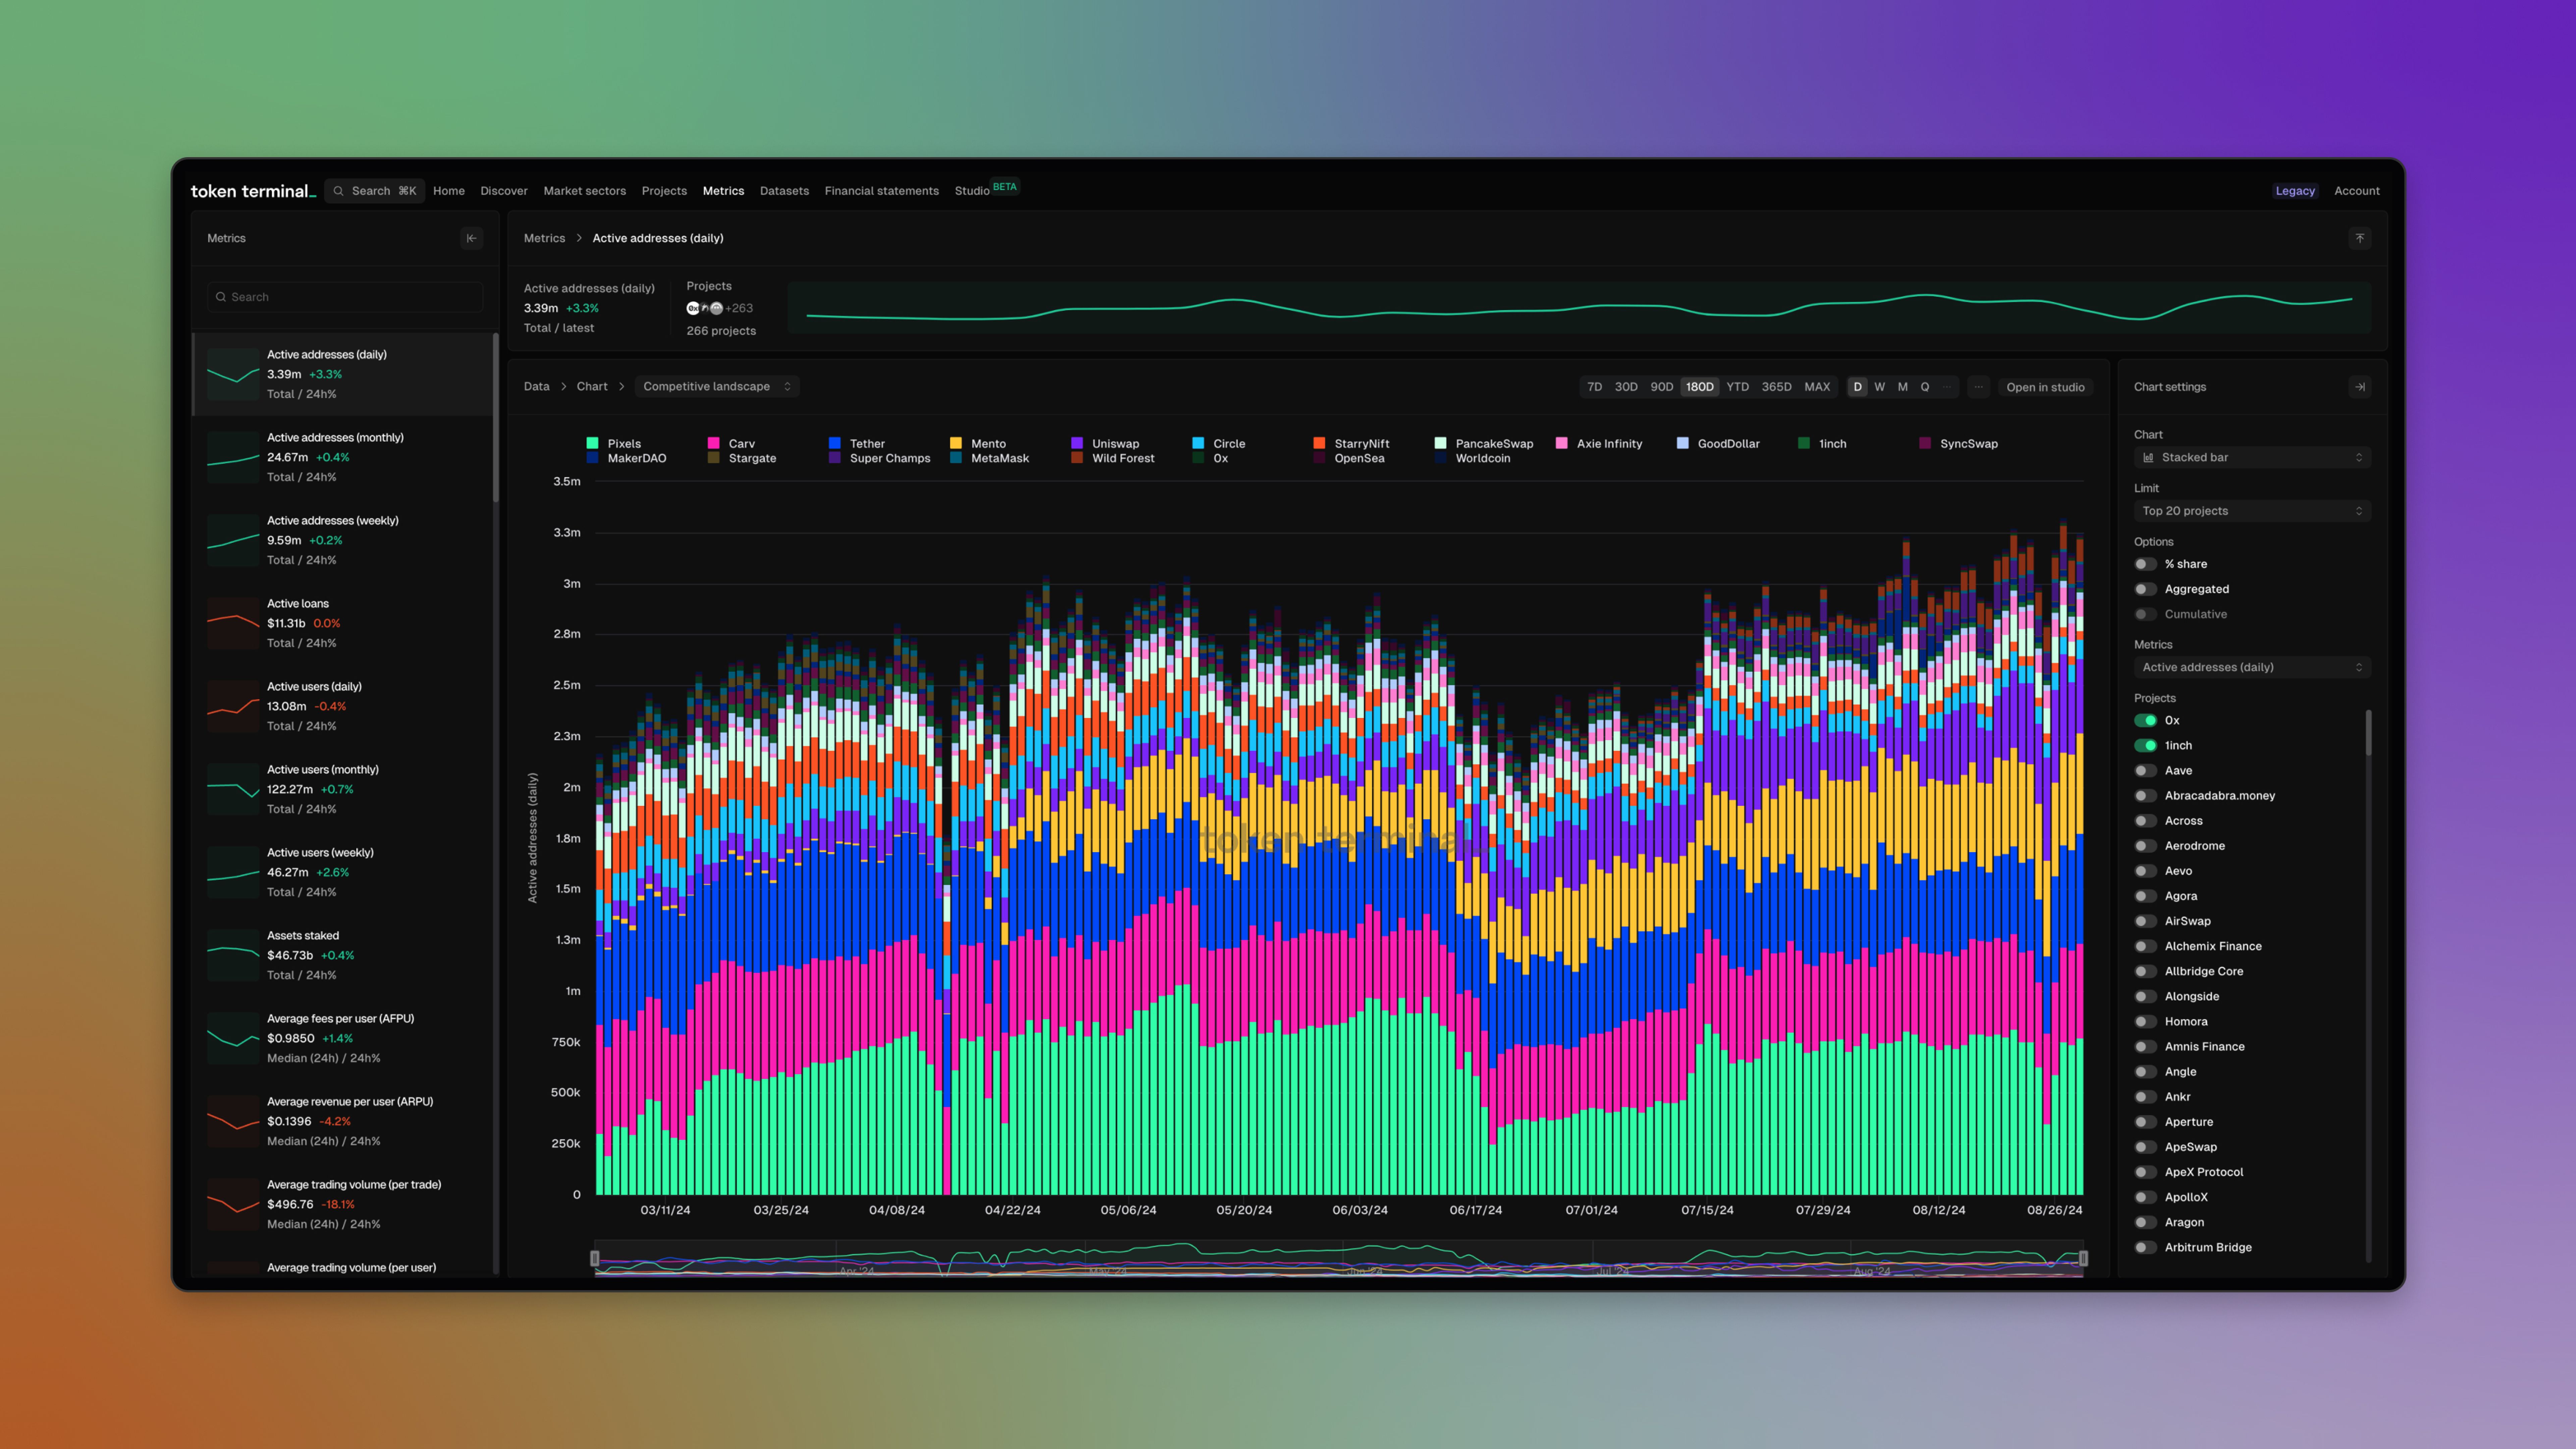
3. Active addresses (daily)
The Active addresses (daily) metric shows the number of distinct addresses transacting with the project's labeled contracts on a daily basis. It counts the distinct sender addresses in transactions where the "to" address is the project’s contract, leveraging purely onchain data integrated with the Token Terminal smart contracts label dataset. This metric is a crucial proxy for understanding daily user engagement and adoption levels, offering insights into user activity trends and helping gauge the immediate popularity of the contracts.
4. Active Addresses (weekly)
The Active addresses (weekly) metric reveals the number of distinct addresses transacting with the project's labeled contracts on a weekly basis. Following the same calculation method as the daily metric but aggregated over the trailing seven days, it provides a broader view of user engagement by smoothing out daily fluctuations. This metric acts as a proxy for weekly user trends and patterns.
5. Active Addresses (monthly)
The Active addresses (monthly) metric tracks the number of distinct addresses transacting with the project's labeled contracts on a monthly basis. Using the same methodology as the daily and weekly metrics but aggregated over the trailing 30 days, it offers the longest view of user engagement, helping to identify sustained trends and patterns in user interaction with the project’s labeled contracts over time.
The Token Terminal labels dataset plays a crucial role in providing accurate and powerful metrics. As the metrics for any project highly depends on the labels we have identified, we gladly welcome any contributions to the Token Terminal labels dataset. Your contributions to this dataset directly enhances the accuracy and comprehensiveness of these metrics for all projects. Today, any new projects can also be listed, by submitting their smart contract information to us, and stay tuned for updated, self-service workflows for listing new projects. We look forward to continue bringing onchain analytics to all investors and operators.
New Project Listings
Over the summer, armed with our new set of metrics, we’ve been quickly adding new projects from a range of market sectors and chains. Having more basic metrics like Gas Used and Active Addresses means that we can help investors see traction even in early stage projects. Check out a highlighted list of our new projects:
- Acala Network: a specialized stablecoin and liquidity blockchain powered by Polkadot Relay chain.
- Amnis Finance: a liquidity staking protocol built on Aptos.
- Hippo Labs: an Aptos-native DEX aggregator
- Moonwell: decentralized lending and borrowing protocol on Base
- Thruster: a yield-first DEX on Blast
- Euler: non-custodial lending protocol built on Ethereum
- B3: a gaming-focused L3 on Base
- Carv: a modular data layer on Ronin
- Gravity Alpha: an Optimum L2 enabling cross-chain interactions
- Fantasy: a fantasy game built on Blast
- Pixels: a retro, world-building game on Ronin
- Super Champs: a sports-themed game built on Base
- Ubeswap: a Celo-native decentralized exchange
- Moola Market: a Celo-native lending & borrowing platform.
- RARI Chain: a creator-centric L3 on Artbitrum
- Banana Gun: a multi-chain trading bot on Telegram
- Tapos: a cat game built on Aptos
- Fren Pet: an onchain game on Base
- Symbiotic: a shared security protocol
Data Updates
- We added full historical OP traces, enabling new metrics (contract deployers and contracts deployed) as well as major improvements to our datasets around contracts, wallets, and stablecoins.
- We added DyDx v4 Trading volume. This upgrade allows us to include data from their latest major version upgrade for the DyDx chain, ensuring full data coverage of one of the leading DeFi protocols.
- We migrated derivative decentralized exchanges to use notional trading volume instead of trading volume to better differentiate between DEX and Derivative DEX activity and metrics.
- We updated our Curve listing to include voting incentives, LLamalend, crvUSD revenues/fees, as well as new pool deployments for Curve DEX. All of these changes together ensure that our Curve listing and data more accurately represents activity on the platform.
- Updated Trader Joe v2.2 so that we’re including the latest changes from the protocol, ensuring our metrics are accurate and up to date.
- Update Ronin blockchain models to account for EIP-1559 so that fees are accurately represented for all Ronin related transactions.
- We added Aptos, TON, and Terra to the Project contracts dataset to ensure even more discoverability for activity on those chains.
- Make market cap data available for all blockchains in the Blockchain comparison dataset.
Enhancements & Bug Fixes
- ⚒️We added url-based configuration for charts and datasets to make it easier to share specific chart views with others in Token Terminal.
- ⚒️We rebuilt our market sector tagging system to provide more clarity about each project and larger categories like “All blockchains”. Listings can now also have multiple tags.
- 🎨We updated the title convention for Expanded Chart view for each chart making it easier to understand the chart settings that the user original set.
- 🎨We updated the application font to a more legible font for both standard and monospaced text.
- 🐛We fixed a set of issues with Quarterly data and how we calculate quarter data based on the users’ time range input: by default full quarter data is shown even if the date range falls in the middle of the quarter.
- 🐛We fixed text overflow issues caused by multiline CSS rules.
- 🐛We fixed a page overflow issue for datatables where the table would overflow the footer in certain circumstances.
- 🐛We fixed an issue with gaps between weekly columns in certain composition charts.
Studio Charts: Now in Beta
Today, we’re excited to announce the beta for a new way to analyze onchain data in Token Terminal: building your own custom charts in our new Studio.
At the core of exploring onchain data in Token Terminal is the humble chart. Showing one or two metrics at a time, these charts help you analyze standardized financial metrics by project and market sector. But, as we learned in our own research, as well as alongside customers, this can be limiting when you want to explore ideas across multiple projects, ecosystems, or even across different metrics.
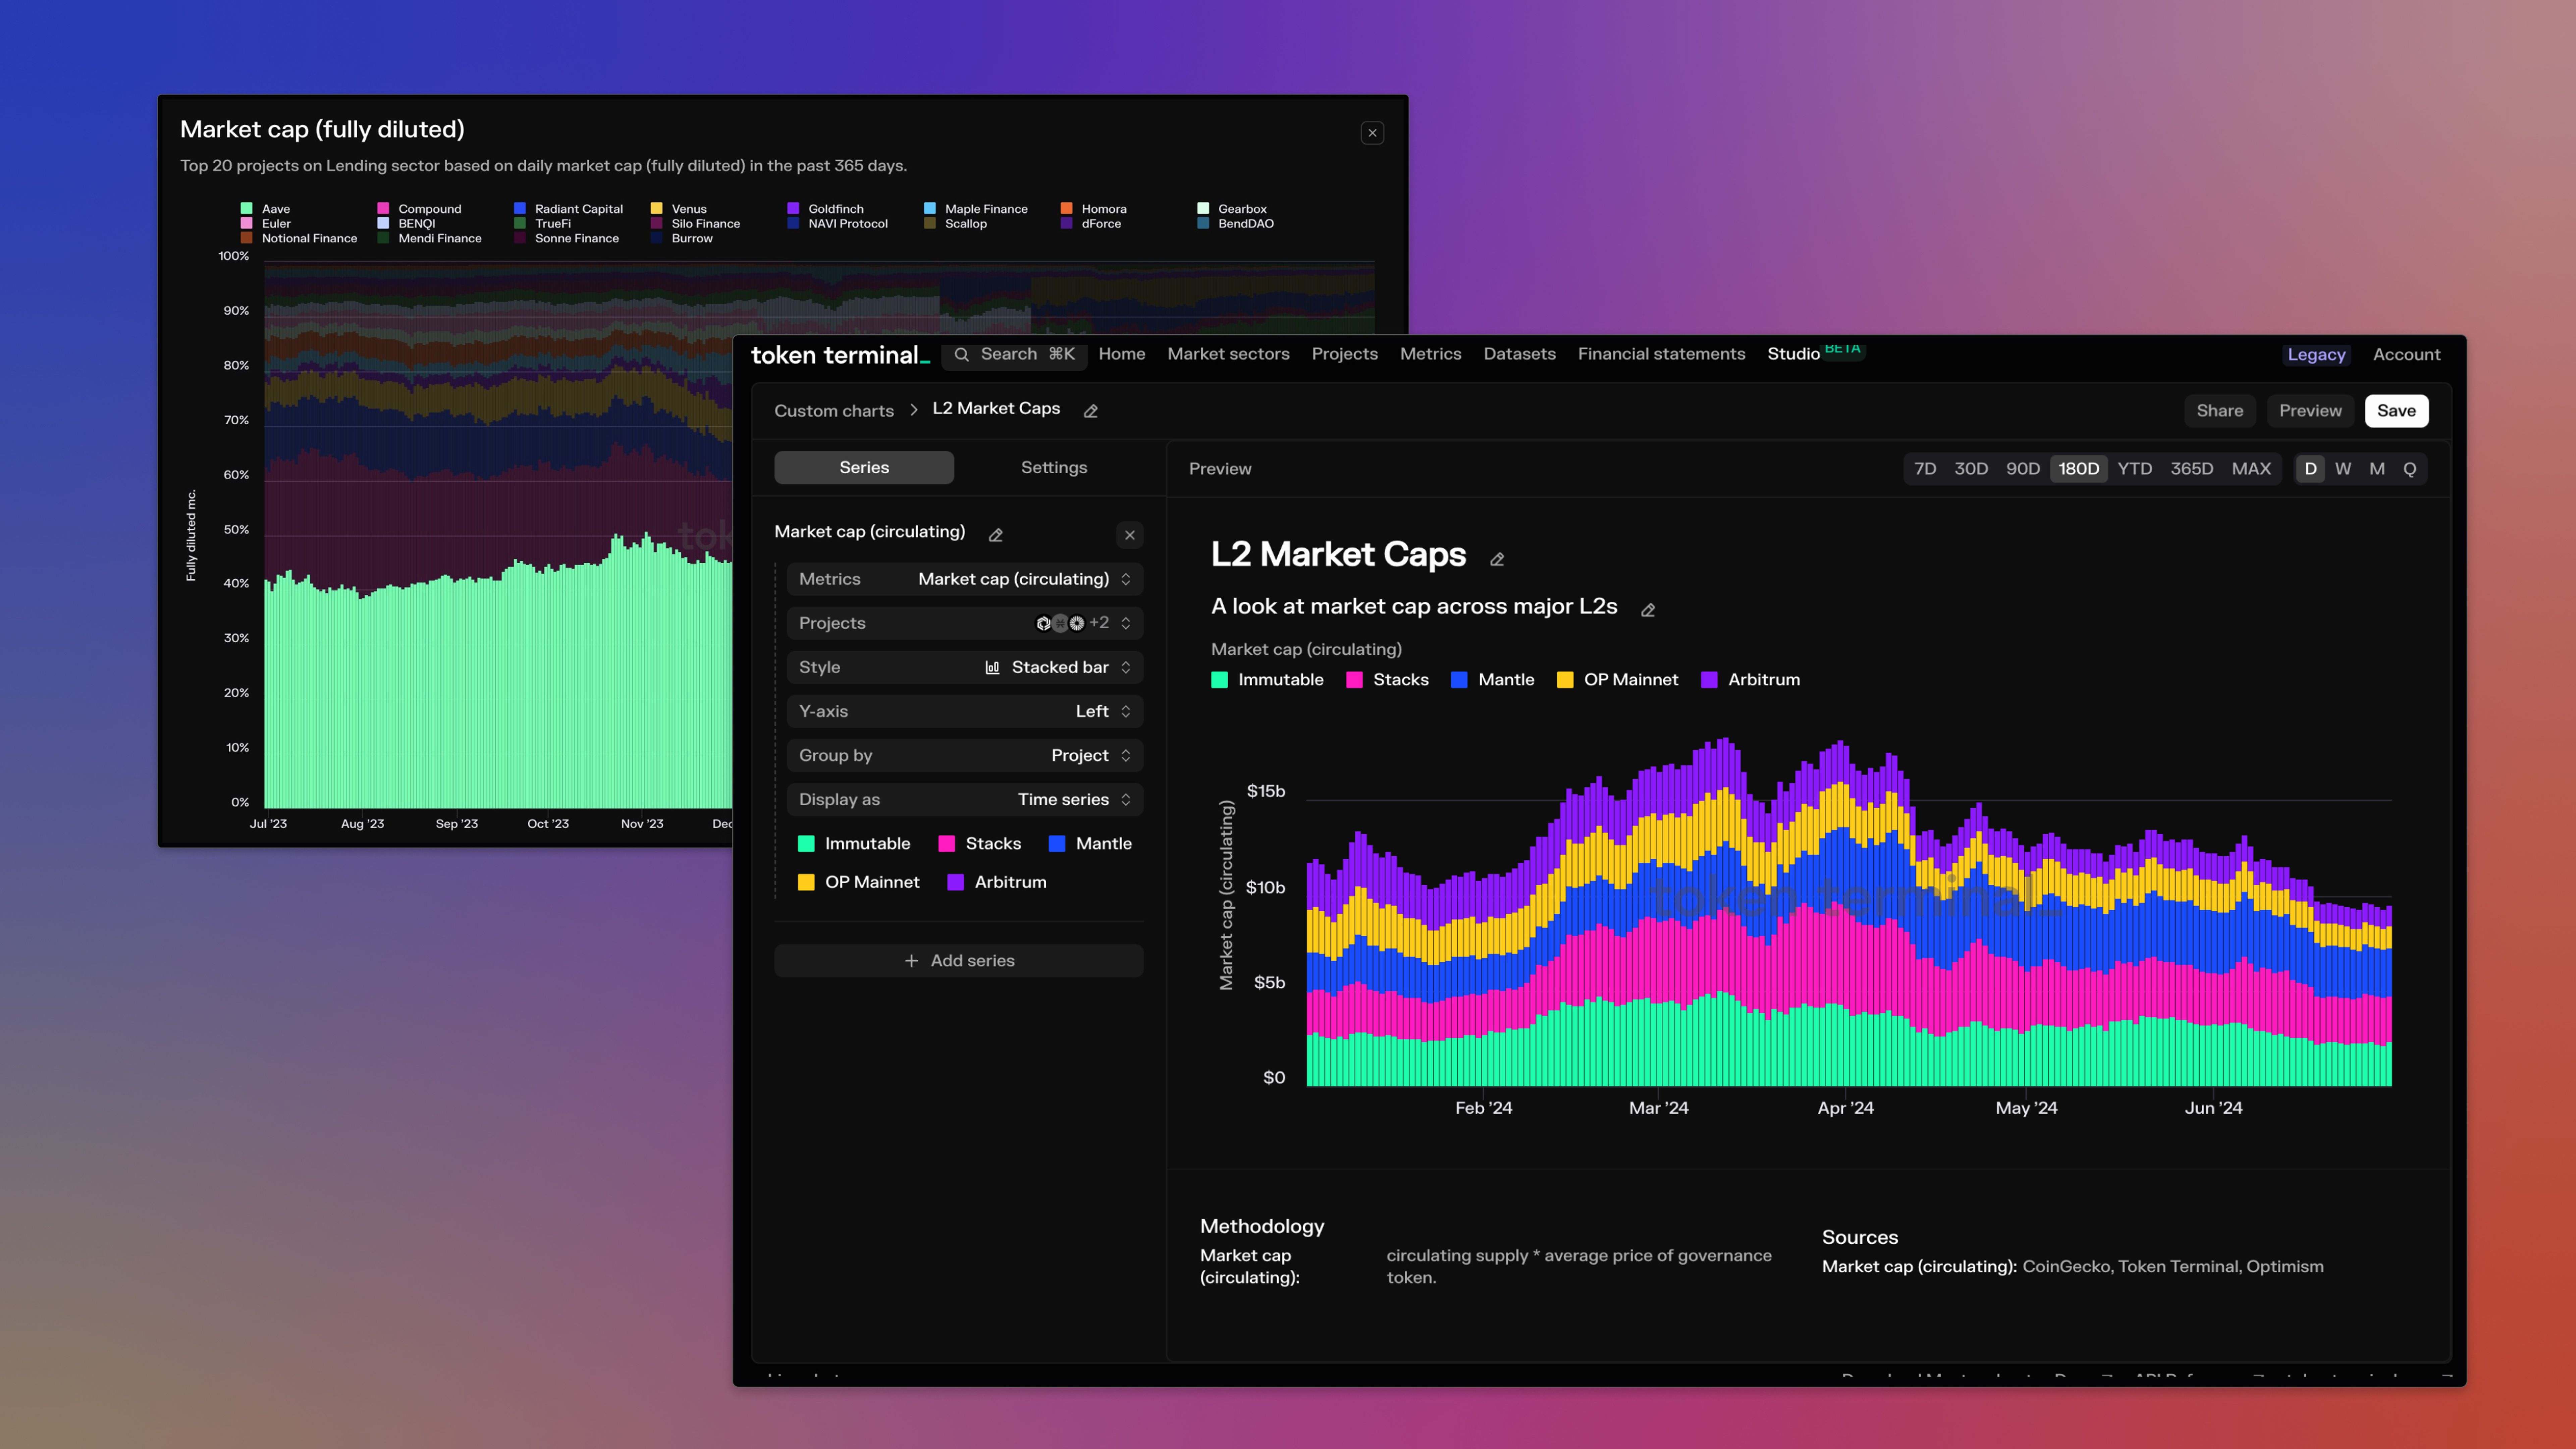
Enter the new and improved chart building experience on Token Terminal. You can easily compare any number of projects with onchain data with multiple metrics all in the same chart. Charts can be created from scratch or from any existing charts in Token Terminal, allowing you to quickly create custom visualizations that help you analyze projects using our standardized, onchain data.
With the new chart, you can easily:
- 📈 Compare any metric across any or all projects listed on Token Terminal
- 📊 Compare up to 4 metrics in the same chart for any combination of projects
- ⛓️ Group projects by chain or aggregate each series for comparison
- 🧰 Leverage all types of data visualizations available on Token Terminal including line, bar, and area charts as well as stacked bar and stacked area charts
- 📅 See data as cumulative or in a time-series
- 👥 Share charts with anyone
- ⚡Easily create new charts from any charts in Token Terminal
The new charts experience is available in beta to all Pro customers. To get started, just log in and start exploring the new Studio page where you can create your first custom chart. And stay tuned for even more new customization features coming soon!
Data Updates
- Added support for non-ERC-20 tokens to our Top Tokenholders data set, unlocking tokenholder metrics across both BTC and ETH.
- Added tokenholder metrics to some additional ERC-20 based tokens: ONDO, AXS, and IMX.
- Added USDT on TON to our Stablecoin data set including data around outstanding supply, transfer volume, and other standard Stablecoin metrics.
- Extended our price feed for ETH historically to ensure the maximum coverage of historical price data.
- Added the outstanding supply of tokens for USDD, crvUSD, and FEI.
- Updated Solana transaction count to include all transactions, including unsuccessful ones in order to bring it inline with our standard transaction count definition.
- Updated all friend.tech metrics to include V2 contracts.
- Added active users (daily, weekly, monthly) for major stablecoin providers.
- Added market data for ZkSync Era including price, market capitalization, and circulating supply.
- Updated Uniswap to include transactions on zkSync Era.
- Added new custom metrics for Internet Computer: annualized estimated rewards, active internet identities, and total canister state.
- Added new Solana metrics including average transaction fee and transaction per second.
- Updated BNB Chain to take blob transactions into account for transaction based metrics.
- Added new metrics for Jito including daily active users, average fee per user, and average revenue per user.
- Added Ubeswap price feed data to ensure full historical price data for CELO.
Enhancements & Bug Fixes
- 💅 Added a stacked area chart for composition-based charts.
- 💅 Added byte-based scales for metrics using bytes.
- 🐛 Fixed a bug in the active user counts for Chainlink.
- 🐛 Fixed a bug in the trade counts for COW Protocol.
- 🐛 Fixed a bug with the scroll viewport on mini charts.
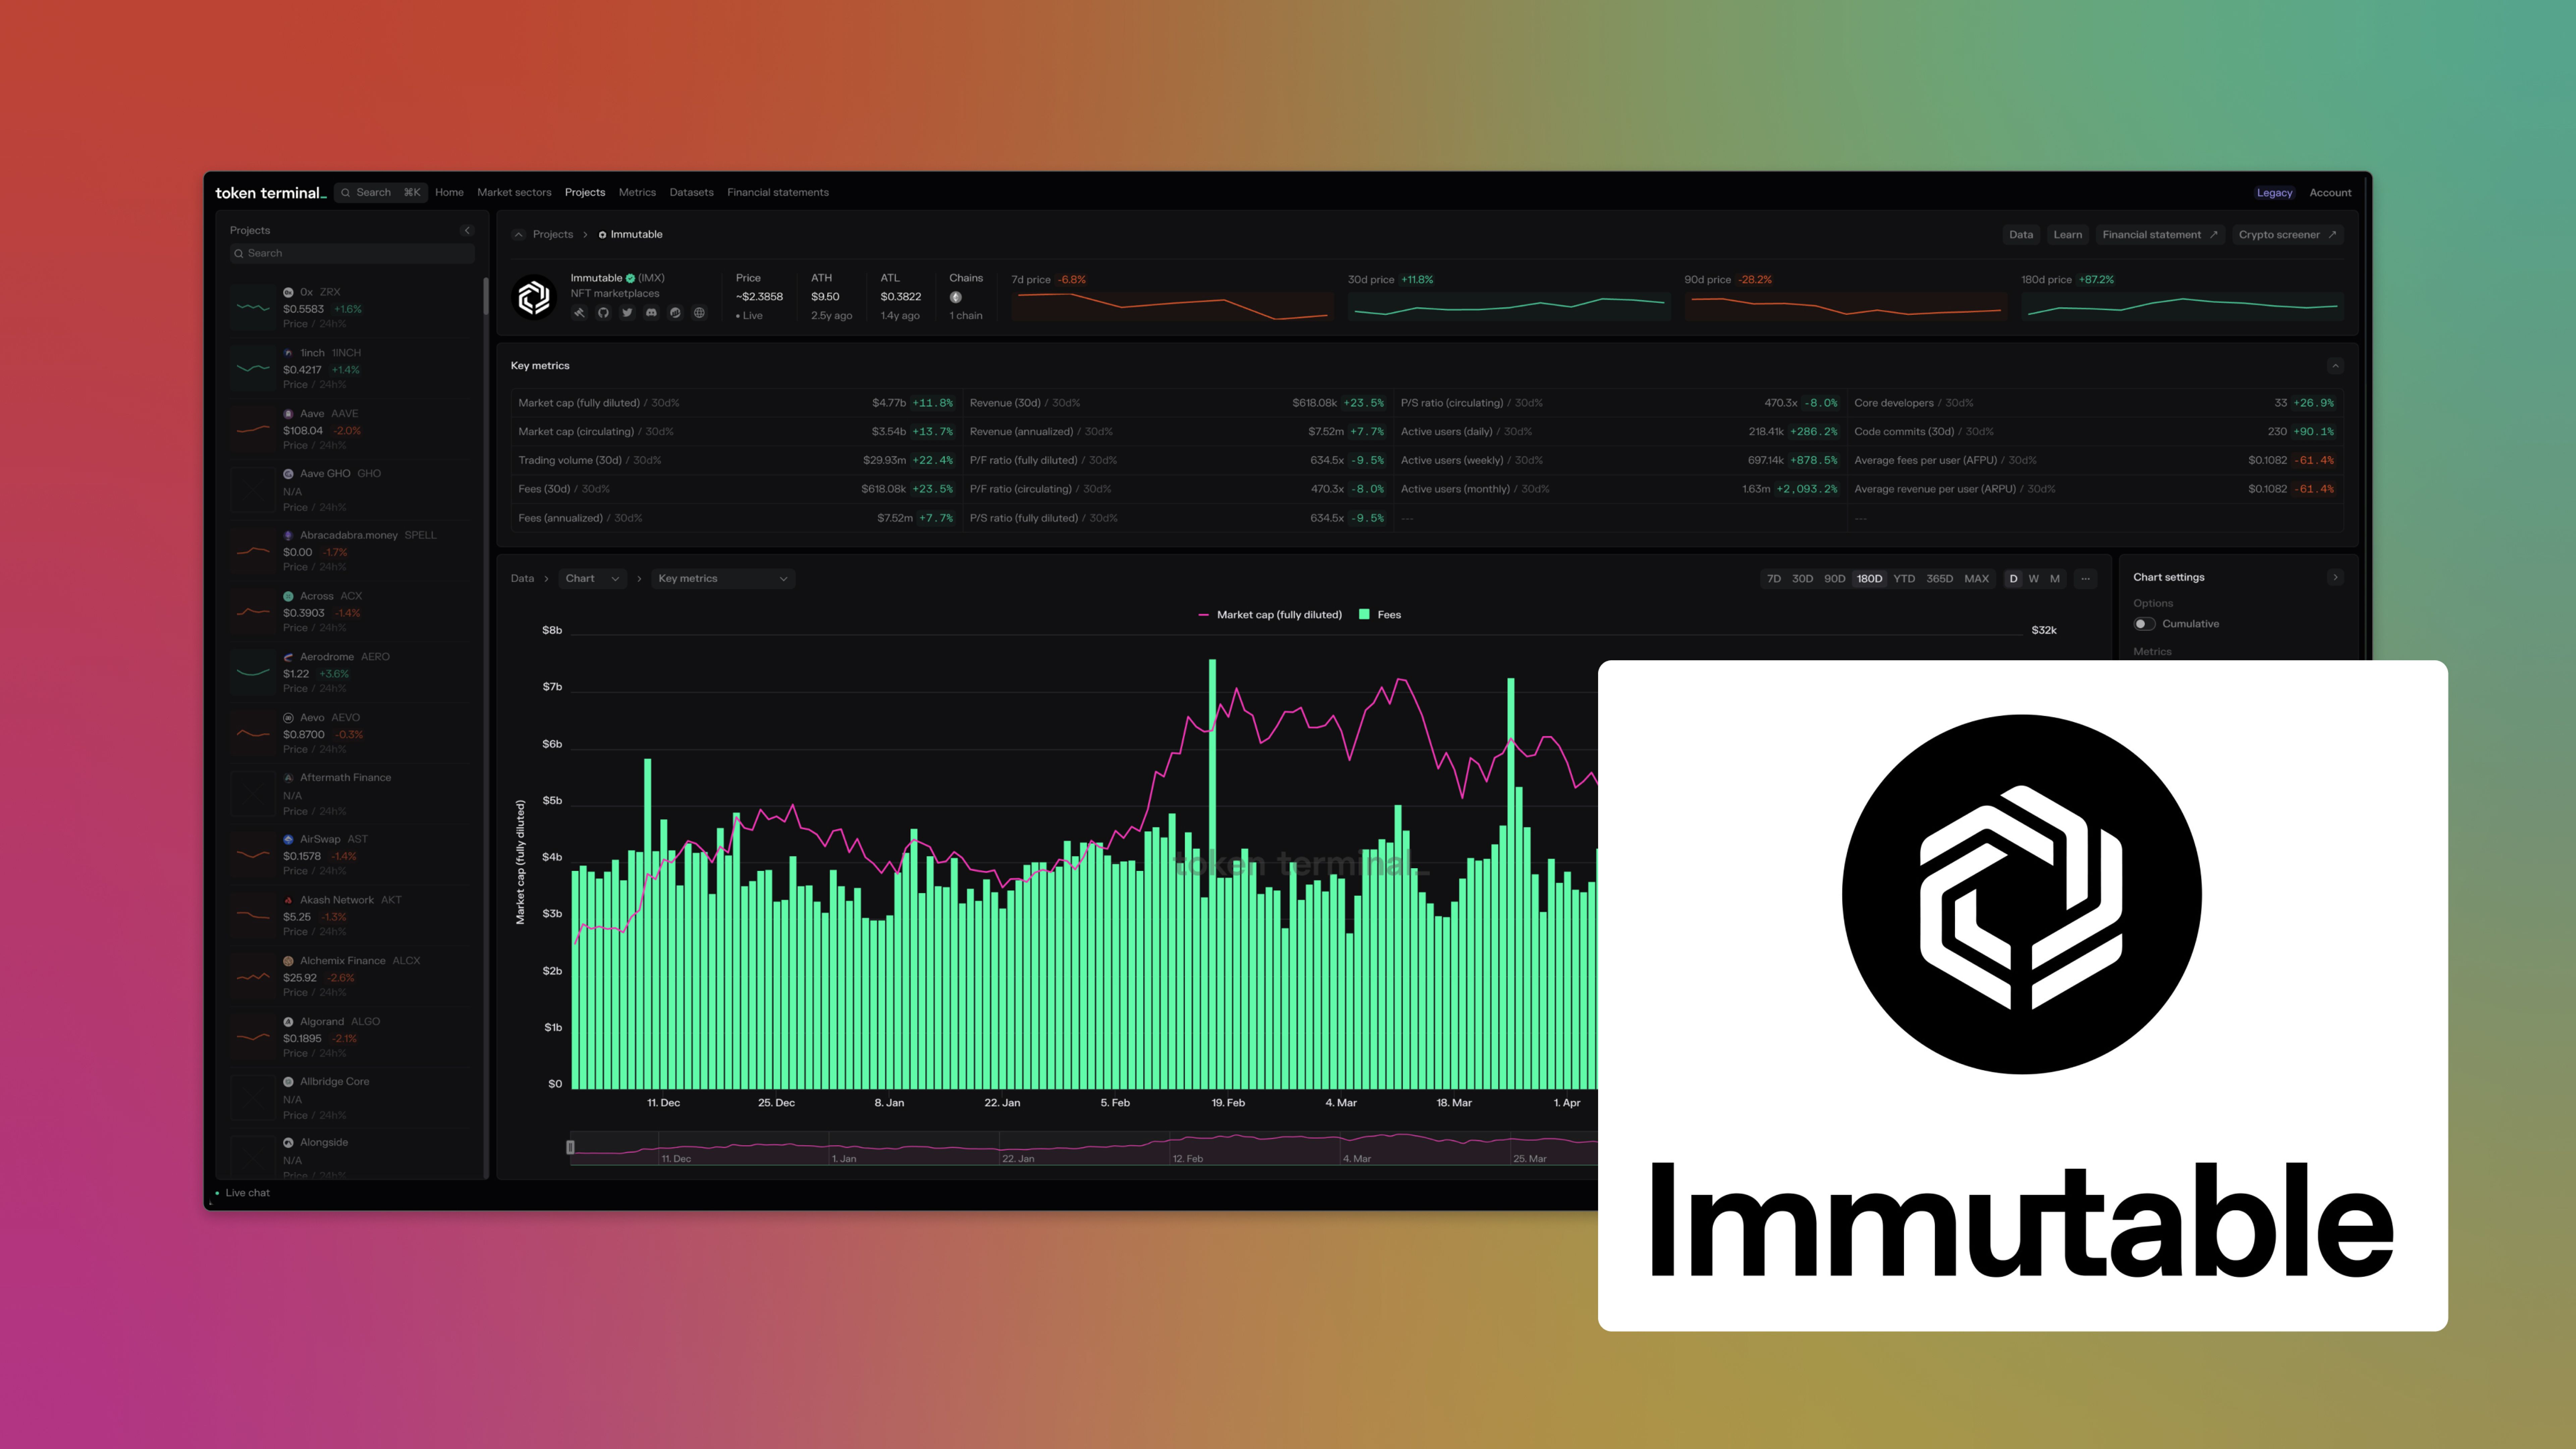
Immutable zkEVM now fully integrated to our Data Pipeline
We have completed our integration of Immutable zkEVM into our data pipeline and warehouse to enable institutional-grade onchain analytics for the chain built for web3 games. This integration improves the accessibility of Immutable zkEVM’s onchain data to enable more informed decision-making for all stakeholders in the ecosystem.
Data Infrastructure Enhancements
- Redundant Archive Nodes: To ensure maximum data granularity, accuracy, and auditability, we have set up redundant archive nodes for the Immutable zkEVM blockchain.
- Historical Data Ingestion: The complete historical raw blockchain data from these nodes has been indexed into the Token Terminal data warehouse.
- Data Standardization and Maintenance: We have standardized this vast amount of data into blocks, transactions, traces, and logs tables. Automated upkeep tooling has also been developed to maintain the ongoing accuracy of this dataset.
Data Abstraction and Analysis Tools:
- Optimized Abstraction Tables: New tables have been created to optimize the tracking of IMX token transfers and flows.
- Comprehensive Token Price Feeds: We've established robust token price feeds for IMX, based on liquidity pool prices from leading decentralized exchanges.
Dashboard and Metrics Enhancements:
- New Centralized Immutable zkEVM Dashboard: A new dashboard for Immutable now shows metrics across all business lines (including their NFT marketplace).
- Updated Trending Contracts Dataset: This dataset now features new data points for Immutable
- Enhanced Trending Wallets Dataset: Updates include metrics like transfers from, most transfers from, transfers to, most transfers to, inflows, outflows, and net flows.
Token Terminal Data Room customers now have access to comprehensive Immutable data including blocks, transactions, traces, logs, and decoded smart contract data, along with optimized abstraction tables and token prices. Additionally, Token Terminal API and Pro customers can now utilize the expanded Immutable data in their analyses, facilitating more informed and effective decision-making.
Data Updates
- Three new Aptos projects are now tracked on Token Terminal - We have now created initial listings for Cellana Finance, Econia and Panora, three top DeFi projects on Aptos. We will continue listing more Aptos projects and increasing the metric coverage for them.
- Aave Incentive Tokens - We added tracking for Aave’s Merit program in order to calculate more precisely the token incentives for the project. The program was created to counteract the impact of Morpho optimizer on Aave revenue and to support the GHO stablecoin peg.
- Jito Updated Metrics - Jito, a non-custodial liquid staking protocol built on Solana. We now added even more metrics for the Jito project including fees, supply side fees, and revenue. These metrics are from Jito's MEV infrastructure product line. Currently, Jito is the primary source of Solana MEV.
- Arbitrum Top Tokenholders - The Top Tokenholders dataset now includes tokens on the Arbitrum chain, allowing users to compare data across multiple ecosystems. The dataset has been expanded to include top Arbitrum tokens such as $ARB, $RDNT, and $GMX, and will be expanded to include more chains in the near future.
- Uniswap Labs fees and trading volumes updated - Uniswap Labs had recently updated their fee collector addresses on multiple chains. The Uniswap Labs dashboard now tracks all of the latest fee collector addresses, resulting in up to date data for Uniswap Labs.
Enhancements & Bug Fixes
- 💅Updated the styling of our search bar to match modern ⌘+K interfaces.
- 👟 Improved the performance of data queries on native token holders across Ethereum, Tron, BNB, and Polygon data sets.
- 👟 Improved the performance of data queries for token supply of Tether.
- 🐛 Improved the accuracy of Operating expense descriptions and updated the logic for how Thena’s Operating expenses are calculated.