Research
The current state of crypto
Edmund Tong
•
In this article, we provide a comprehensive overview of usage statistics for the most widely used protocols
These are the current top 25 dapps and blockchains based on the number of distinct daily active users.
Daily active users dashboard: https://tokenterminal.com/terminal/metrics/active-users
1. BNB Chain
BNB Chain dashboard: https://tokenterminal.com/terminal/projects/binance-smart-chain
Monthly average of daily active users (number of unique sender addresses):
- Jan 2022: 1.17M
- Jan 2023: 0.78M
- YoY change: -33%
2. Ethereum
Ethereum dashboard: https://tokenterminal.com/terminal/projects/ethereum
Monthly average of daily active users (number of unique sender addresses):
- Jan 2022: 365.8K
- Jan 2023: 356.9K
- YoY change: -2%
3. Polygon
Polygon dashboard: https://tokenterminal.com/terminal/projects/polygon
Monthly average of daily active users (number of unique sender addresses):
- Jan 2022: 326.0K
- Jan 2023: 453.2K
- YoY change: +39%
4. Solana
Solana dashboard: https://tokenterminal.com/terminal/projects/solana
Monthly average of daily active users (number of unique first signer addresses):
- Jan 2022: 261.7K
- Jan 2023: 166.8K
- YoY change: -36%
5. PancakeSwap
PancakeSwap dashboard: https://tokenterminal.com/terminal/projects/pancakeswap
Monthly average of daily active users (number of distinct addresses interacting with business relevant contracts):
- Jan 2022: 346.7K
- Jan 2023: 118.2K
- YoY change: -66%
6. Optimism
Optimism dashboard: https://tokenterminal.com/terminal/projects/optimism
Monthly average of daily active users (number of unique sender addresses):
- Jan 2022: 2.0K
- Jan 2023: 55.9K
- YoY change: +2,695%
7. Uniswap
Uniswap dashboard: https://tokenterminal.com/terminal/projects/uniswap
Monthly average of daily active users (number of distinct addresses interacting with business relevant contracts):
- Jan 2022: 26.6K
- Jan 2023: 49.1K
- YoY change: +84%
8. OpenSea
OpenSea dashboard: https://tokenterminal.com/terminal/projects/opensea
Monthly average of daily active users (number of distinct addresses interacting with business relevant contracts):
- Jan 2022: 66.0K
- Jan 2023: 60.2K
- YoY change: -9%
9. Arbitrum
Arbitrum dashboard: https://tokenterminal.com/terminal/projects/arbitrum
Monthly average of daily active users (number of unique sender addresses):
- Jan 2022: 6.8K
- Jan 2023: 49.6K
- YoY change: +629%
10. Fantom
Fantom dashboard: https://tokenterminal.com/terminal/projects/fantom
Monthly average of daily active users (number of unique sender addresses):
- Jan 2022: 75.4K
- Jan 2023: 64.0K
- YoY change: -15%
11. Avalanche C-Chain
Avalanche C-Chain dashboard: https://tokenterminal.com/terminal/projects/avalanche
Monthly average of daily active users (number of unique sender addresses):
- Jan 2022: 87.4K
- Jan 2023: 25.1K
- YoY change: -71%
12. PoolTogether
PoolTogether dashboard: https://tokenterminal.com/terminal/projects/pooltogether
Monthly average of daily active users (number of distinct addresses interacting with business relevant contracts):
- Jan 2022: 662
- Jan 2023: 10.1K
- YoY change: +1,426%
13. Stargate
Stargate dashboard: https://tokenterminal.com/terminal/projects/stargate
Monthly average of daily active users (number of distinct addresses interacting with business relevant contracts):
- Jul 2022: 261
- Jan 2023: 8.4K
- Change over 6 months: +3,118%
14. Perpetual Protocol
Perpetual Protocol dashboard: https://tokenterminal.com/terminal/projects/perpetual-protocol
Monthly average of daily active users (number of distinct addresses interacting with business relevant contracts):
- Jan 2022: 150
- Jan 2023: 7.4K
- YoY change: +4,833%
15. Blur
Blur dashboard: https://tokenterminal.com/terminal/projects/blur
Monthly average of daily active users (number of distinct addresses interacting with business relevant contracts):
- Oct 2022: 2.2K
- Jan 2023: 10.3K
- QoQ change: +282%
16. Quix
Quix dashboard: https://tokenterminal.com/terminal/projects/quix
Monthly average of daily active users (number of distinct addresses interacting with business relevant contracts):
- Jul 2022: 464
- Jan 2023: 4.9K
- Change over 6 months: +956%
17. Lens Protocol
Lens Protocol dashboard: https://tokenterminal.com/terminal/projects/lens
Monthly average of daily active users (number of distinct addresses interacting with business relevant contracts):
- Jul 2022: 3.2K
- Jan 2023: 5.4K
- Change over 6 months: +69%
18. Zora
Zora dashboard: https://tokenterminal.com/terminal/projects/zora
Monthly average of daily active users (number of distinct addresses interacting with business relevant contracts):
- Jan 2022: 21
- Jan 2023: 3.2K
- YoY change: +15,138%
19. Trader Joe
Trader Joe dashboard: https://tokenterminal.com/terminal/projects/trader-joe
Monthly average of daily active users (number of distinct addresses interacting with business relevant contracts):
- Jan 2022: 26.4K
- Jan 2023: 2.8K
- YoY change: -89%
20. Synthetix
Synthetix dashboard: https://tokenterminal.com/terminal/projects/synthetix
Monthly average of daily active users (number of distinct addresses interacting with business relevant contracts):
- Jan 2022: 80
- Jan 2023: 3.7K
- YoY change: +4,525%
21. StarkNet
StarkNet dashboard: https://tokenterminal.com/terminal/projects/starknet
Monthly average of daily active users (number of unique sender addresses):
- Jan 2022: 141
- Jan 2023: 4.6K
- YoY change: +3,162%
22. Aave
Aave dashboard: https://tokenterminal.com/terminal/projects/aave
Monthly average of daily active users (number of distinct addresses interacting with business relevant contracts):
- Jan 2022: 4.2K
- Jan 2023: 5.1K
- YoY change: +21%
23. SushiSwap
SushiSwap dashboard: https://tokenterminal.com/terminal/projects/sushiswap
Monthly average of daily active users (number of distinct addresses interacting with business relevant contracts):
- Jan 2022: 13.0K
- Jan 2023: 3.1K
- YoY change: -76%
24. SpookySwap
SpookySwap dashboard: https://tokenterminal.com/terminal/projects/spookyswap
Monthly average of daily active users (number of distinct addresses interacting with business relevant contracts):
- Jan 2022: 21.1K
- Jan 2023: 2.4K
- YoY change: -89%
25. ApeSwap
ApeSwap dashboard: https://tokenterminal.com/terminal/projects/apeswap
Monthly average of daily active users (number of distinct addresses interacting with business relevant contracts):
- Jan 2022: 6.9K
- Jan 2023: 2.6K
- YoY change: -62%
Methodology:
- It is important to note that the composition chart (below) may show higher values than the aggregate daily active users chart (above).
- The discrepancy is a result of different methodologies being used in the two charts.
- Using Aave as an example, a single address may be both a depositor and a borrower during the same day.
- In the aggregate chart this user is recorded as 1 distinct user, whereas in the composition chart the same address is counted as 2 distinct users.
Daily active users dashboard: https://tokenterminal.com/terminal/metrics/active-users
Thank you for reading! All of the data presented in this article can be found for free on Token Terminal.
The authors of this content, or members, affiliates, or stakeholders of Token Terminal may be participating or are invested in protocols or tokens mentioned herein. The foregoing statement acts as a disclosure of potential conflicts of interest and is not a recommendation to purchase or invest in any token or participate in any protocol. Token Terminal does not recommend any particular course of action in relation to any token or protocol. The content herein is meant purely for educational and informational purposes only, and should not be relied upon as financial, investment, legal, tax or any other professional or other advice. None of the content and information herein is presented to induce or to attempt to induce any reader or other person to buy, sell or hold any token or participate in any protocol or enter into, or offer to enter into, any agreement for or with a view to buying or selling any token or participating in any protocol. Statements made herein (including statements of opinion, if any) are wholly generic and not tailored to take into account the personal needs and unique circumstances of any reader or any other person. Readers are strongly urged to exercise caution and have regard to their own personal needs and circumstances before making any decision to buy or sell any token or participate in any protocol. Observations and views expressed herein may be changed by Token Terminal at any time without notice. Token Terminal accepts no liability whatsoever for any losses or liabilities arising from the use of or reliance on any of this content.
Stay in the loop
Join our mailing list to get the latest insights!
Continue reading
Customer stories: Token Terminal’s Data Partnership with Linea
Through its partnership with Token Terminal, Linea turns transparency into a competitive advantage and continues to build trust with its growing community.
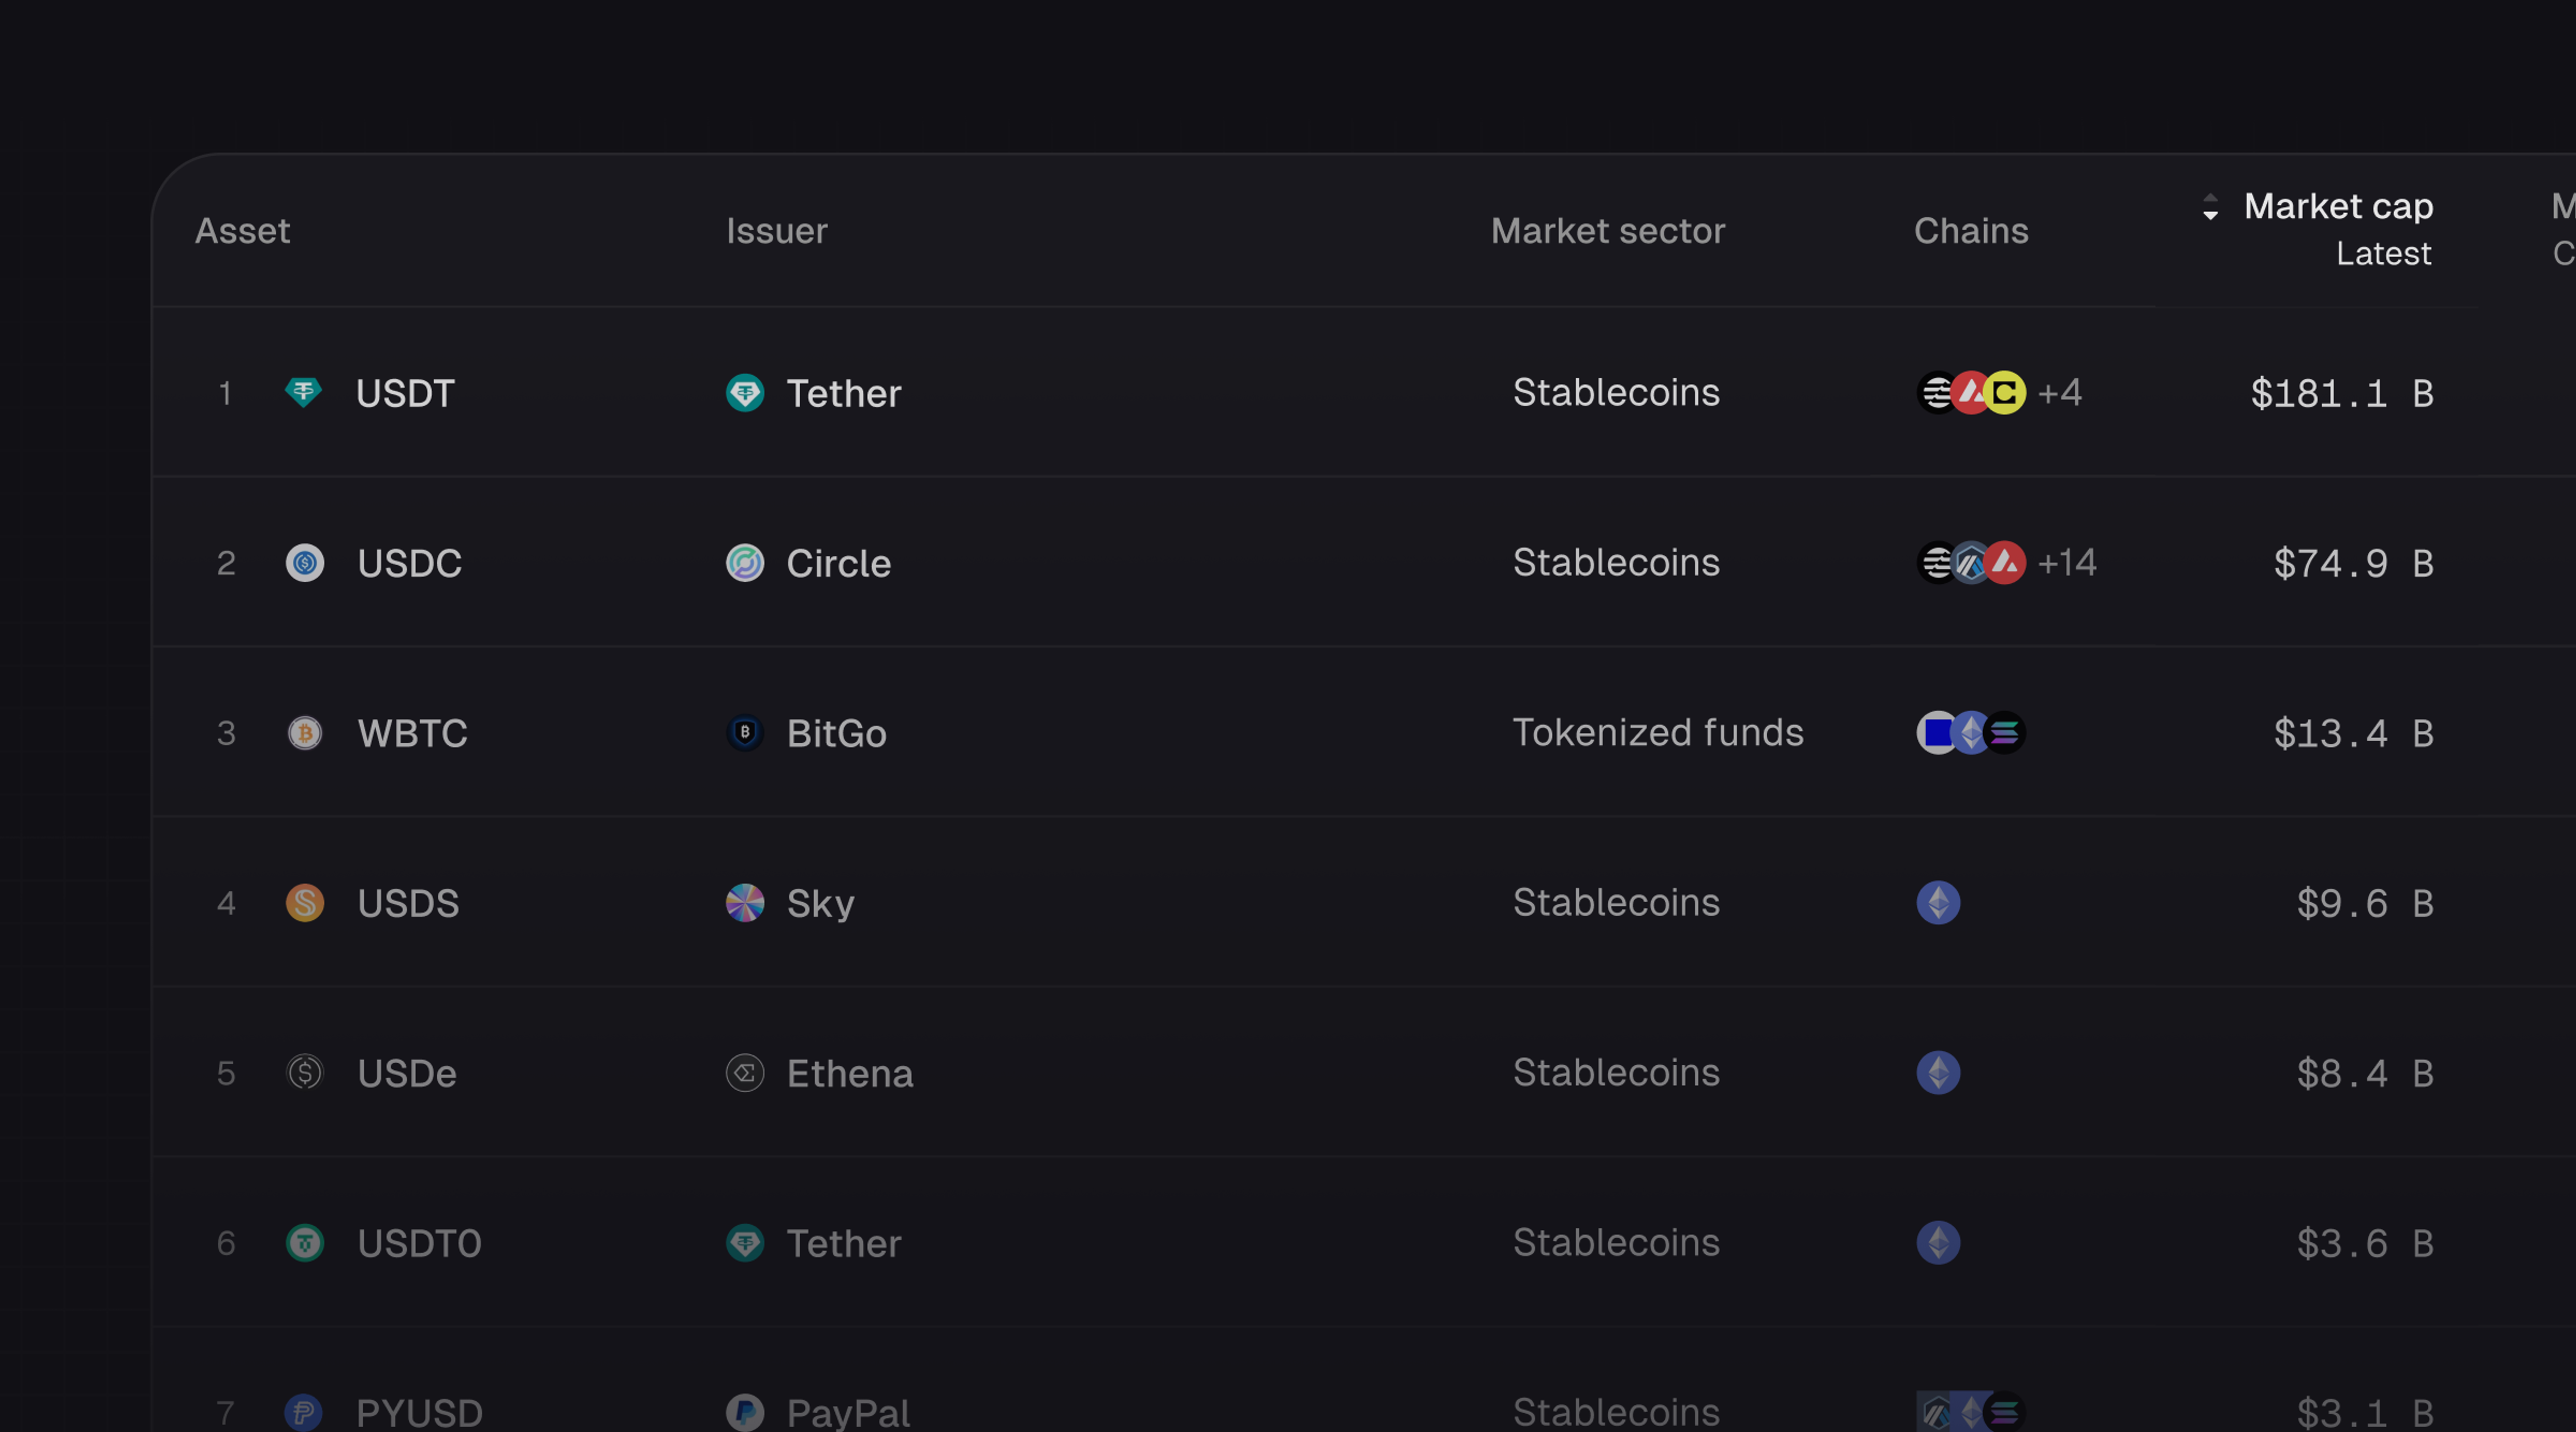
Introducing Tokenized Assets
Token Terminal is expanding its standardized onchain analytics to cover the rapidly growing category of tokenized real-world assets (RWAs) – starting with stablecoins, tokenized funds, and tokenized stocks.
Customer stories: Token Terminal’s Data Partnership with EigenCloud
Through its partnership with Token Terminal, EigenCloud turns transparency into a competitive advantage and continues to build trust with its growing community.