Research
Research piece on Tron
Token Terminal Research
•
In this article, we go through Tron’s onchain financials & alternative KPIs and see how they benchmark against the competition. Tron is a layer 1 blockchain network that was launched in 2017. Since its launch, Tron has become the most known for hosting the exponential growth of Tether’s USDT stablecoin, which has grown from $0 to $50B in outstanding supply since its launch in May 2019.
For the purpose of this article, we’ve chosen Arbitrum, Base, Solana, Avalanche, and BNB Chain, i.e. chains that also focus on facilitating cost-efficient payments, as the primary comparables for Tron.
Let’s jump in!
Market capitalizations
Let’s start by looking at how the market currently values these projects. It’s possible to argue that an investor should always view all other metrics in relation to the valuation, which is why we start with that.
Market cap (fully diluted):
- BNB Chain: $122B
- Solana: $99B
- Avalanche: $34B
- Arbitrum: $15B
- Tron: $10B
- Base: N/A
Two networks are at the $100B valuation mark. Tron’s TRX is currently valued at ~10% of BNB and SOL. TRX is the lowest-valued network among its comparables. The valuation for Base is currently N/A, as Coinbase has not yet issued a native token for the L2. However, looking at BNB’s (also an ‘exchange token’) current market cap of $122B, it is possible that Coinbase is thinking about launching a token for Base later on.
Onchain financials
Now that we’ve established the values that the market assigns to these networks, let’s examine how much transaction fees they generate per day. The transaction fees indicate how much users are willing to pay to interact with the applications on each network.
Daily transaction fees:
- Tron: $4.4M
- Solana: $2.1M
- BNB Chain: $774K
- Base: $613K
- Avalanche: $63K
- Arbitrum: $38K
Tron generates the most transaction fees per day, by a meaningful margin. However, both Solana and Base have seen high growth rates in transaction fees over the past month. Avalanche and Arbitrum stand out as chains with extremely low fees compared to the others.
Valuation multiples
The following metric can be derived from the fully diluted market and annualized transaction fees: price to fees (P/F) ratio. The P/F ratio tells us how the market values the chain relative to the usage it sees in the form of transaction fees – a low multiple might indicate that a network is undervalued and vice versa.
Price to fees (P/F) ratio (fully diluted):
- Tron: 6x
- Solana: 95x
- Arbitrum: 356x
- BNB Chain: 333x
- Avalanche: 877x
- Base: N/A
Tron is valued at ~6x its annualized transaction fees, whereas all other competitors have P/F multiples around or above 100x. Arbitrum, BNB Chain, and Avalanche stand out as the most ‘overvalued’ networks based on their P/F multiples.
Alternative KPIs
As another indicator of usage, let’s look at the daily active users (unique sender addresses) metric for each network. This figure tells us how wide the user base of the chain is, i.e. whether the demand to transact comes from a concentrated or a diversified base of users.
Active users (daily):
- Tron: 1.6M
- BNB Chain: 1.2M
- Solana: 949K
- Base 359K
- Arbitrum: 330K
- Avalanche 55K
Tron has the highest daily active user count among its comparables, but is closely followed by both BNB Chain and Solana. Base and Arbitrum tie for 4th place, whereas Avalanche comes significantly behind all other comparables.
Finally, let’s look at how many core developers each network has. This figure tells us how many engineers are needed to keep the network up and running. The headcounts below are calculated based on unique GitHub users that, within a rolling 30-day period, have made commits to repositories that reside under each network's primary GitHub organization.
Core developers:
- Solana: 76
- BNB Chain: 64
- Avalanche: 43
- Arbitrum: 37
- Base: 32
- Tron: 14
Tron seems to have the smallest core development team among its competitors, however no individual team stands out as outsized compared to others. These small core development teams illustrate the leverage that engineers have in crypto – a handful of people can build extremely valuable, global, and transparent networks.
Key takeaways
- Tron represents ~10% of BNB’s and SOL’s market capitalizations.
- Tron generates the most transaction fees per day among its competitors, ~2x more than Solana and ~7x more than BNB Chain.
- Tron is valued at only ~6x its annualized transaction fees, whereas all of its competitors have a P/F multiple around or above 100x.
- Tron has the highest daily active user count, albeit both BNB Chain and Solana come in as close 2nd and 3rd.
- Tron has the smallest core development team among its peers, however no individual team stands out as ‘outsized’ compared to others.
Relevant links:
- Tron project dashboard
- Blockchains (L1) market sector dashboard
- Blockchains (L2) market sector dashboard
- Crypto screener
The authors of this content, or members, affiliates, or stakeholders of Token Terminal may be participating or are invested in protocols or tokens mentioned herein. The foregoing statement acts as a disclosure of potential conflicts of interest and is not a recommendation to purchase or invest in any token or participate in any protocol. Token Terminal does not recommend any particular course of action in relation to any token or protocol. The content herein is meant purely for educational and informational purposes only, and should not be relied upon as financial, investment, legal, tax or any other professional or other advice. None of the content and information herein is presented to induce or to attempt to induce any reader or other person to buy, sell or hold any token or participate in any protocol or enter into, or offer to enter into, any agreement for or with a view to buying or selling any token or participating in any protocol. Statements made herein (including statements of opinion, if any) are wholly generic and not tailored to take into account the personal needs and unique circumstances of any reader or any other person. Readers are strongly urged to exercise caution and have regard to their own personal needs and circumstances before making any decision to buy or sell any token or participate in any protocol. Observations and views expressed herein may be changed by Token Terminal at any time without notice. Token Terminal accepts no liability whatsoever for any losses or liabilities arising from the use of or reliance on any of this content.
Stay in the loop
Join our mailing list to get the latest insights!
Continue reading
Customer stories: Token Terminal’s Data Partnership with Linea
Through its partnership with Token Terminal, Linea turns transparency into a competitive advantage and continues to build trust with its growing community.
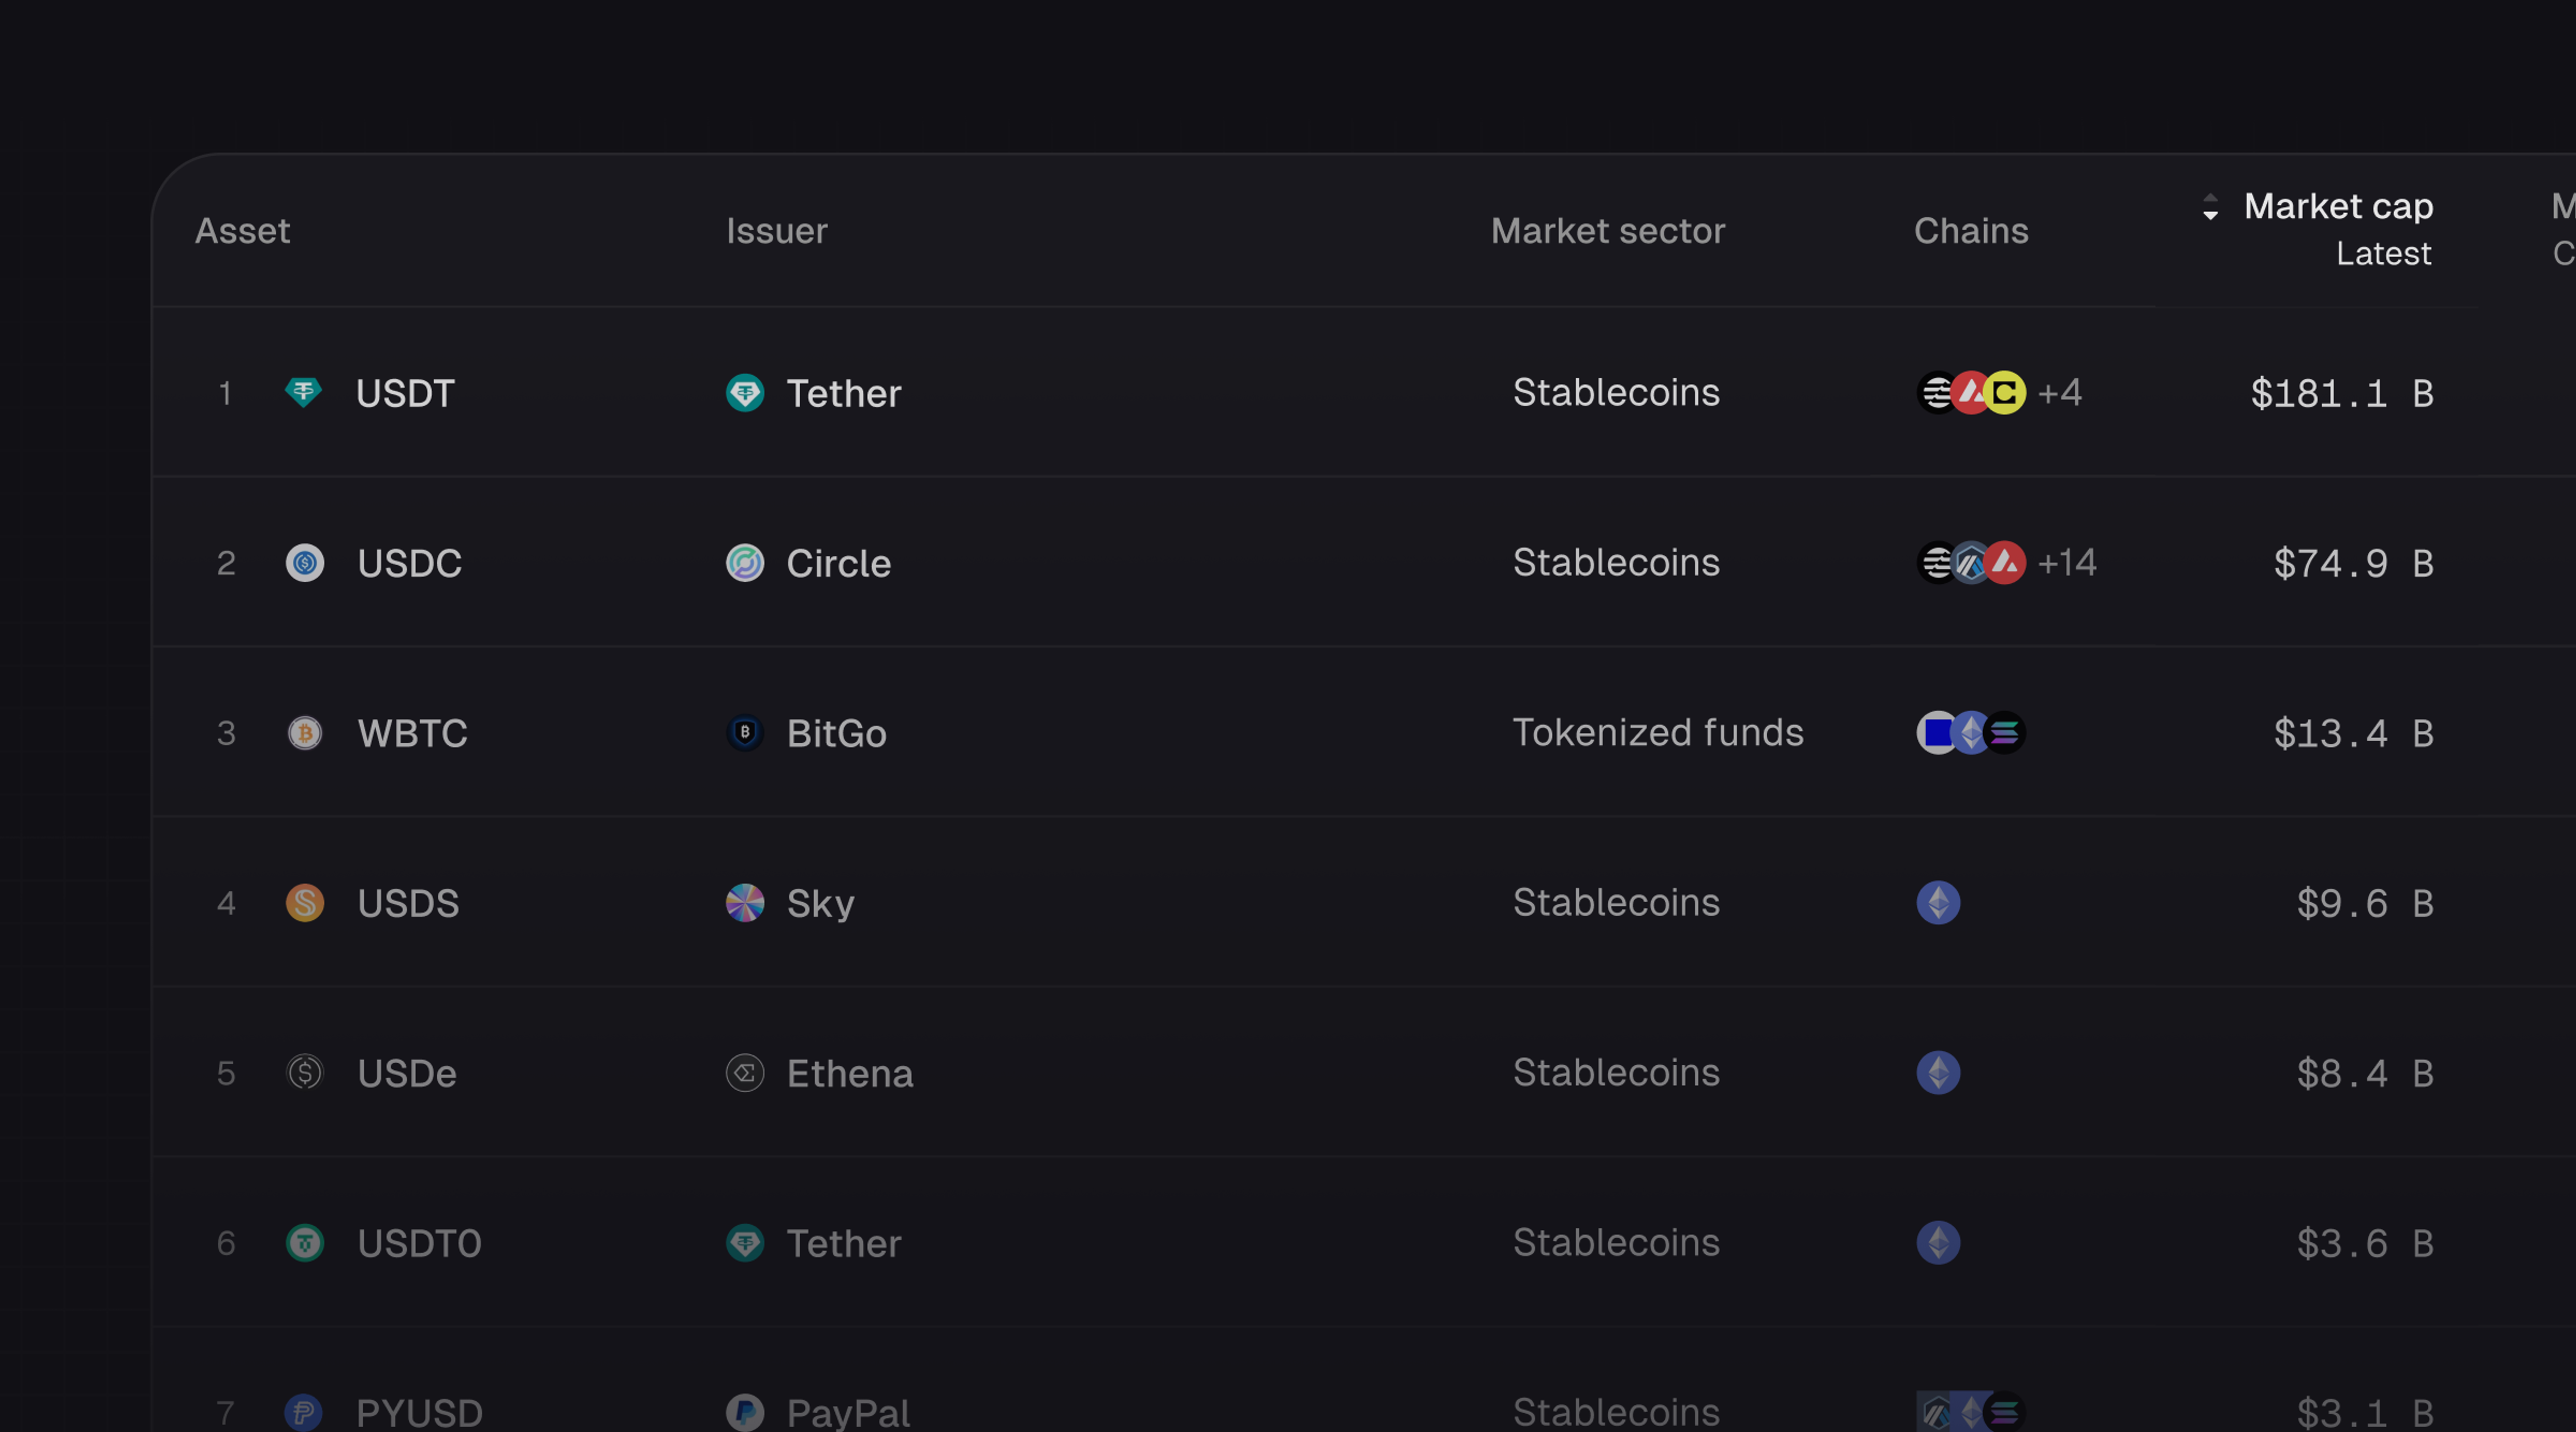
Introducing Tokenized Assets
Token Terminal is expanding its standardized onchain analytics to cover the rapidly growing category of tokenized real-world assets (RWAs) – starting with stablecoins, tokenized funds, and tokenized stocks.
Customer stories: Token Terminal’s Data Partnership with EigenCloud
Through its partnership with Token Terminal, EigenCloud turns transparency into a competitive advantage and continues to build trust with its growing community.