Summer Metrics and Project Updates

While summer’s wrapping up, we’re happy to share some of the work our data and integration teams have been doing over the summer. Between new basic metrics and a whole host of new project listings, the data we cover at Token Terminal continues to get both wider and deeper. Read on for what’s new!
New Onchain Metrics
We are excited to announce the addition of five powerful new metrics to our platform, now available for projects listed on Token Terminal. These new onchain metrics offer deeper insights and a more comprehensive understanding of project performance and user engagement. By leveraging Token Terminal's vertically integrated data pipeline and carefully curated smart contract labels dataset, we can provide these easily understandable metrics that act as proxies for protocol usage. Let’s run through these new metrics:
1. Gas used
The Gas used metric tracks the amount of gas consumed when users interact with your project’s labeled smart contracts, with values denominated in USD based on the daily price of the gas token. It aggregates the USD value of all gas used in transactions involving the project’s labeled smart contracts, using purely onchain data combined with the Token Terminal smart contracts label dataset. This metric acts as a proxy for contract usage and user willingness to pay for contract operations, offering valuable insights into cost efficiency when analyzed alongside the Transaction Count (contracts) metric.
2. Transaction count (contracts)
This metric measures the number of transactions made to the project’s labeled smart contracts, calculated based on the number of onchain transactions where the "to" address is the project’s contract. Sourced purely from onchain data and the Token Terminal smart contracts label dataset, it serves as a proxy for onchain activity, helping to identify high-level trends and patterns within the protocol.
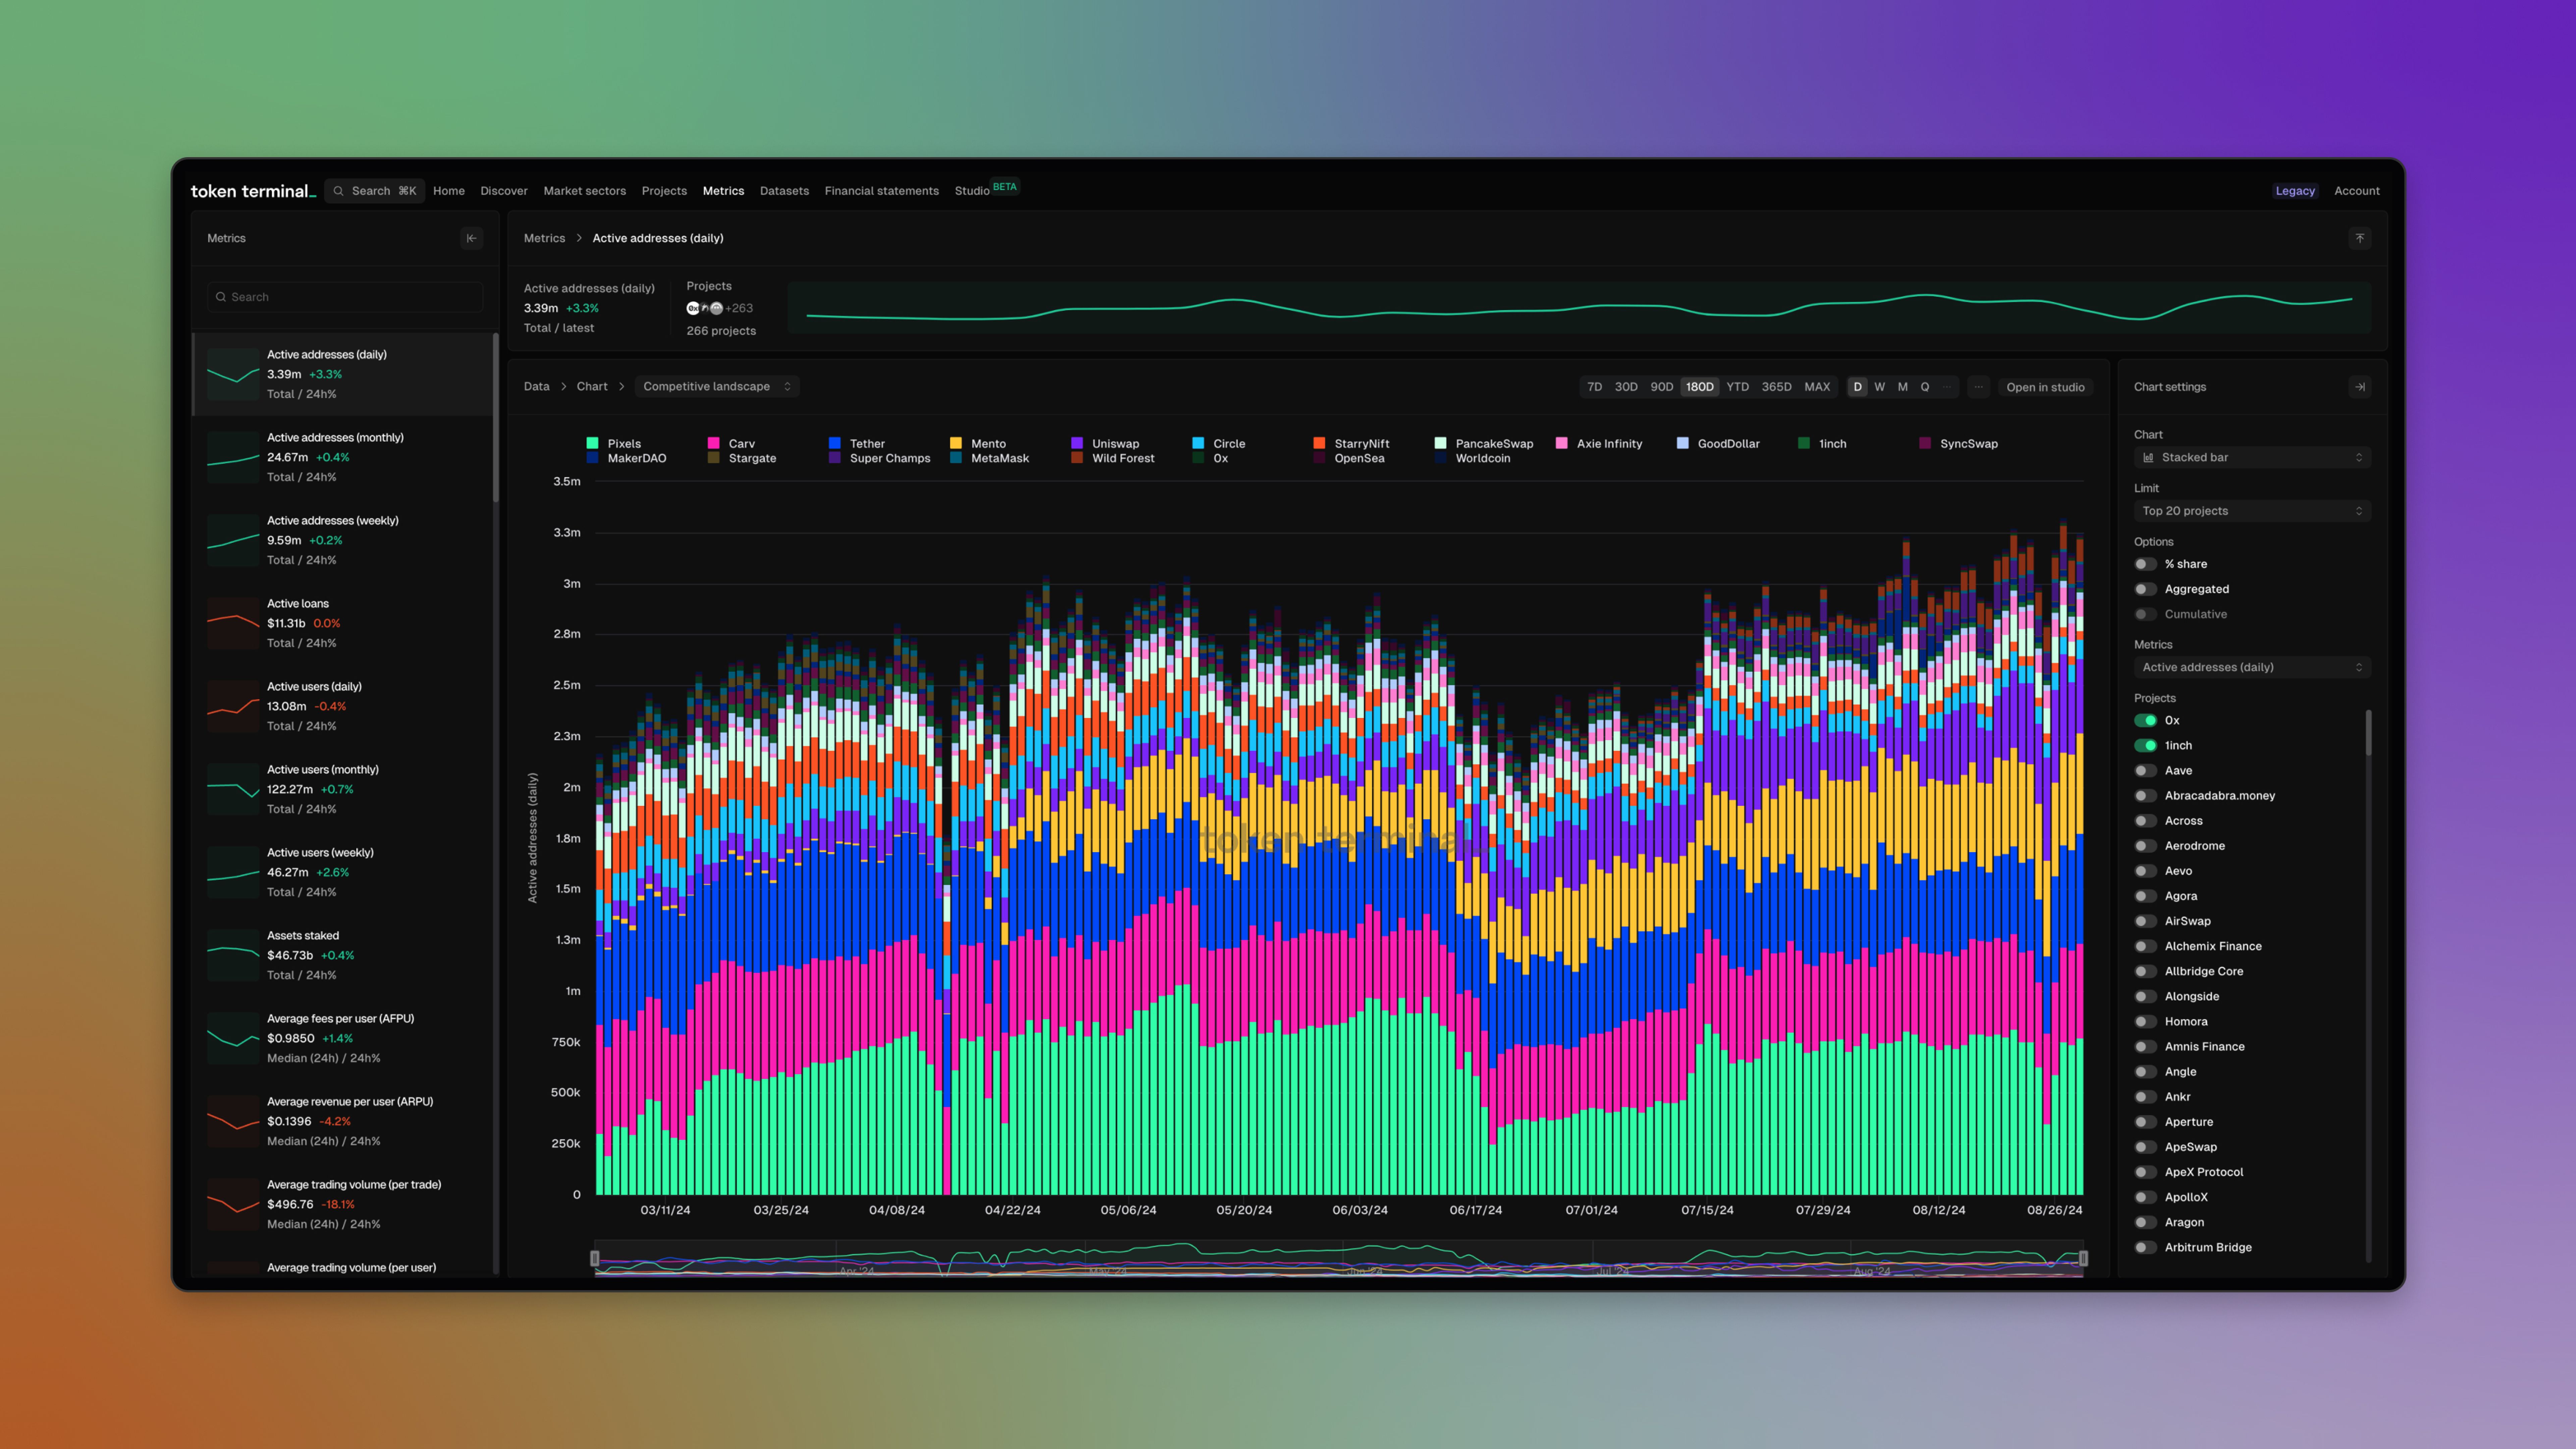
3. Active addresses (daily)
The Active addresses (daily) metric shows the number of distinct addresses transacting with the project's labeled contracts on a daily basis. It counts the distinct sender addresses in transactions where the "to" address is the project’s contract, leveraging purely onchain data integrated with the Token Terminal smart contracts label dataset. This metric is a crucial proxy for understanding daily user engagement and adoption levels, offering insights into user activity trends and helping gauge the immediate popularity of the contracts.
4. Active Addresses (weekly)
The Active addresses (weekly) metric reveals the number of distinct addresses transacting with the project's labeled contracts on a weekly basis. Following the same calculation method as the daily metric but aggregated over the trailing seven days, it provides a broader view of user engagement by smoothing out daily fluctuations. This metric acts as a proxy for weekly user trends and patterns.
5. Active Addresses (monthly)
The Active addresses (monthly) metric tracks the number of distinct addresses transacting with the project's labeled contracts on a monthly basis. Using the same methodology as the daily and weekly metrics but aggregated over the trailing 30 days, it offers the longest view of user engagement, helping to identify sustained trends and patterns in user interaction with the project’s labeled contracts over time.
The Token Terminal labels dataset plays a crucial role in providing accurate and powerful metrics. As the metrics for any project highly depends on the labels we have identified, we gladly welcome any contributions to the Token Terminal labels dataset. Your contributions to this dataset directly enhances the accuracy and comprehensiveness of these metrics for all projects. Today, any new projects can also be listed, by submitting their smart contract information to us, and stay tuned for updated, self-service workflows for listing new projects. We look forward to continue bringing onchain analytics to all investors and operators.
New Project Listings
Over the summer, armed with our new set of metrics, we’ve been quickly adding new projects from a range of market sectors and chains. Having more basic metrics like Gas Used and Active Addresses means that we can help investors see traction even in early stage projects. Check out a highlighted list of our new projects:
- Acala Network: a specialized stablecoin and liquidity blockchain powered by Polkadot Relay chain.
- Amnis Finance: a liquidity staking protocol built on Aptos.
- Hippo Labs: an Aptos-native DEX aggregator
- Moonwell: decentralized lending and borrowing protocol on Base
- Thruster: a yield-first DEX on Blast
- Euler: non-custodial lending protocol built on Ethereum
- B3: a gaming-focused L3 on Base
- Carv: a modular data layer on Ronin
- Gravity Alpha: an Optimum L2 enabling cross-chain interactions
- Fantasy: a fantasy game built on Blast
- Pixels: a retro, world-building game on Ronin
- Super Champs: a sports-themed game built on Base
- Ubeswap: a Celo-native decentralized exchange
- Moola Market: a Celo-native lending & borrowing platform.
- RARI Chain: a creator-centric L3 on Artbitrum
- Banana Gun: a multi-chain trading bot on Telegram
- Tapos: a cat game built on Aptos
- Fren Pet: an onchain game on Base
- Symbiotic: a shared security protocol
Data Updates
- We added full historical OP traces, enabling new metrics (contract deployers and contracts deployed) as well as major improvements to our datasets around contracts, wallets, and stablecoins.
- We added DyDx v4 Trading volume. This upgrade allows us to include data from their latest major version upgrade for the DyDx chain, ensuring full data coverage of one of the leading DeFi protocols.
- We migrated derivative decentralized exchanges to use notional trading volume instead of trading volume to better differentiate between DEX and Derivative DEX activity and metrics.
- We updated our Curve listing to include voting incentives, LLamalend, crvUSD revenues/fees, as well as new pool deployments for Curve DEX. All of these changes together ensure that our Curve listing and data more accurately represents activity on the platform.
- Updated Trader Joe v2.2 so that we’re including the latest changes from the protocol, ensuring our metrics are accurate and up to date.
- Update Ronin blockchain models to account for EIP-1559 so that fees are accurately represented for all Ronin related transactions.
- We added Aptos, TON, and Terra to the Project contracts dataset to ensure even more discoverability for activity on those chains.
- Make market cap data available for all blockchains in the Blockchain comparison dataset.
Enhancements & Bug Fixes
- ⚒️We added url-based configuration for charts and datasets to make it easier to share specific chart views with others in Token Terminal.
- ⚒️We rebuilt our market sector tagging system to provide more clarity about each project and larger categories like “All blockchains”. Listings can now also have multiple tags.
- 🎨We updated the title convention for Expanded Chart view for each chart making it easier to understand the chart settings that the user original set.
- 🎨We updated the application font to a more legible font for both standard and monospaced text.
- 🐛We fixed a set of issues with Quarterly data and how we calculate quarter data based on the users’ time range input: by default full quarter data is shown even if the date range falls in the middle of the quarter.
- 🐛We fixed text overflow issues caused by multiline CSS rules.
- 🐛We fixed a page overflow issue for datatables where the table would overflow the footer in certain circumstances.
- 🐛We fixed an issue with gaps between weekly columns in certain composition charts.
The authors of this content, or members, affiliates, or stakeholders of Token Terminal may be participating or are invested in protocols or tokens mentioned herein. The foregoing statement acts as a disclosure of potential conflicts of interest and is not a recommendation to purchase or invest in any token or participate in any protocol. Token Terminal does not recommend any particular course of action in relation to any token or protocol. The content herein is meant purely for educational and informational purposes only, and should not be relied upon as financial, investment, legal, tax or any other professional or other advice. None of the content and information herein is presented to induce or to attempt to induce any reader or other person to buy, sell or hold any token or participate in any protocol or enter into, or offer to enter into, any agreement for or with a view to buying or selling any token or participating in any protocol. Statements made herein (including statements of opinion, if any) are wholly generic and not tailored to take into account the personal needs and unique circumstances of any reader or any other person. Readers are strongly urged to exercise caution and have regard to their own personal needs and circumstances before making any decision to buy or sell any token or participate in any protocol. Observations and views expressed herein may be changed by Token Terminal at any time without notice. Token Terminal accepts no liability whatsoever for any losses or liabilities arising from the use of or reliance on any of this content.
Stay in the loop
Join our mailing list to get the latest insights!
Continue reading

Customer stories: Token Terminal’s Data Partnership with Linea
Through its partnership with Token Terminal, Linea turns transparency into a competitive advantage and continues to build trust with its growing community.

Introducing Tokenized Assets
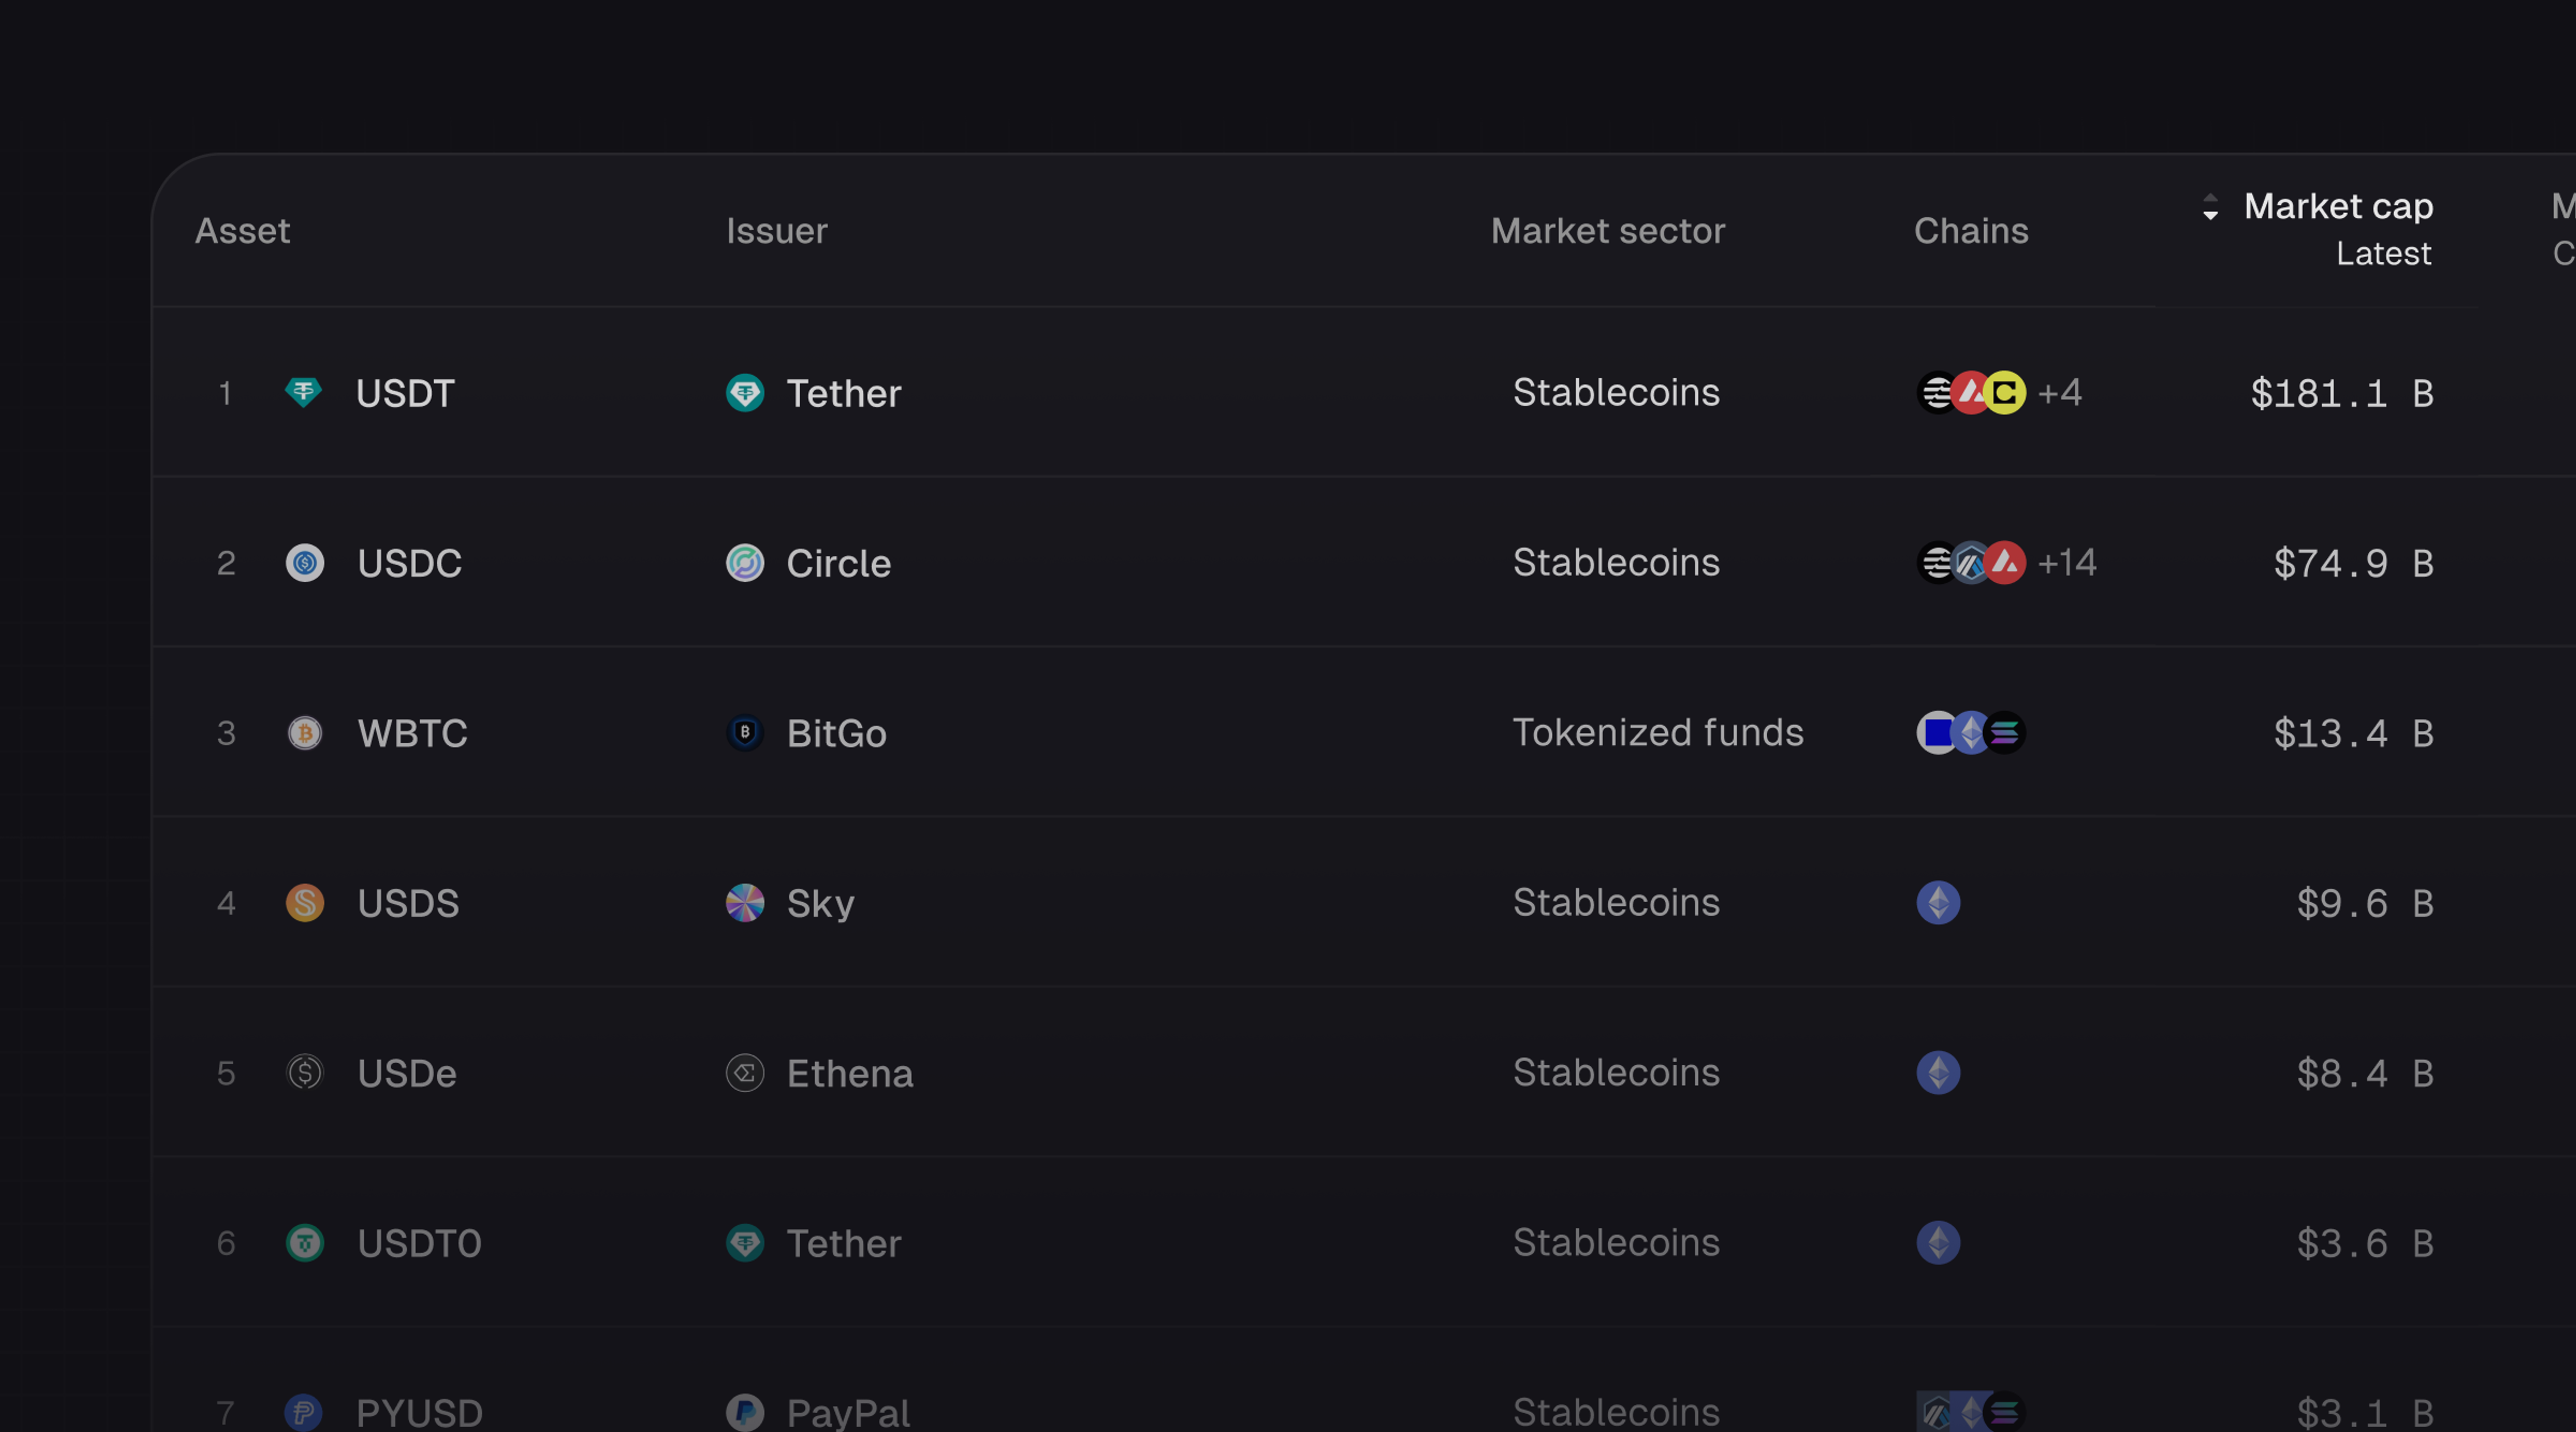
Token Terminal is expanding its standardized onchain analytics to cover the rapidly growing category of tokenized real-world assets (RWAs) – starting with stablecoins, tokenized funds, and tokenized stocks.

Customer stories: Token Terminal’s Data Partnership with EigenCloud
Through its partnership with Token Terminal, EigenCloud turns transparency into a competitive advantage and continues to build trust with its growing community.