News
Learn how to navigate the new dashboard
Token Terminal
•
We are excited to announce our new Cohort analysis data set. We look forward to seeing how the analyst community makes use of it. Don’t hesitate to reach out to us via X DMs or people@tokenterminal.xyz to share feedback and questions!
The current data set includes data for 150+ projects, and uses monthly active users (MAU) as a basis for the calculation. MAUs are defined as unique addresses that transact with a project's business relevant smart contracts within a calendar month.
Let’s dig in!
Overview
- What? More powerful user activity data in the form of monthly user cohort tables.
- Why? In addition to aggregate DAU, WAU, and MAU figures, it’s insightful to track user retention and churn separately for users that become customers of a protocol at different points in time.
- So what? For example, we might find that traders who started to use Uniswap two years after the protocol’s launch are more engaged (higher retention) than its initial users, as a result of better liquidity and asset availability (network effects) later on.
What is cohort analysis?
Analysts can use cohort analysis tables to observe what happens to a group of customers that are onboarded within monthly time intervals. For our first user cohort data set, we’ve added monthly cohort data for over 150 protocols. The dashboard includes sorting and filtering for all columns, which allows for a more targeted discovery and due diligence process.
In Figure 1, we can observe two things:
- an uptick in absolute user numbers, and
- a periodical drop in user retention during the time of Optimism’s Quests incentive campaign (September ‘22 - January ‘23).
In other words, the users who joined at that time did not become long-term users of Synthetix, but most likely farmed the incentives instead.
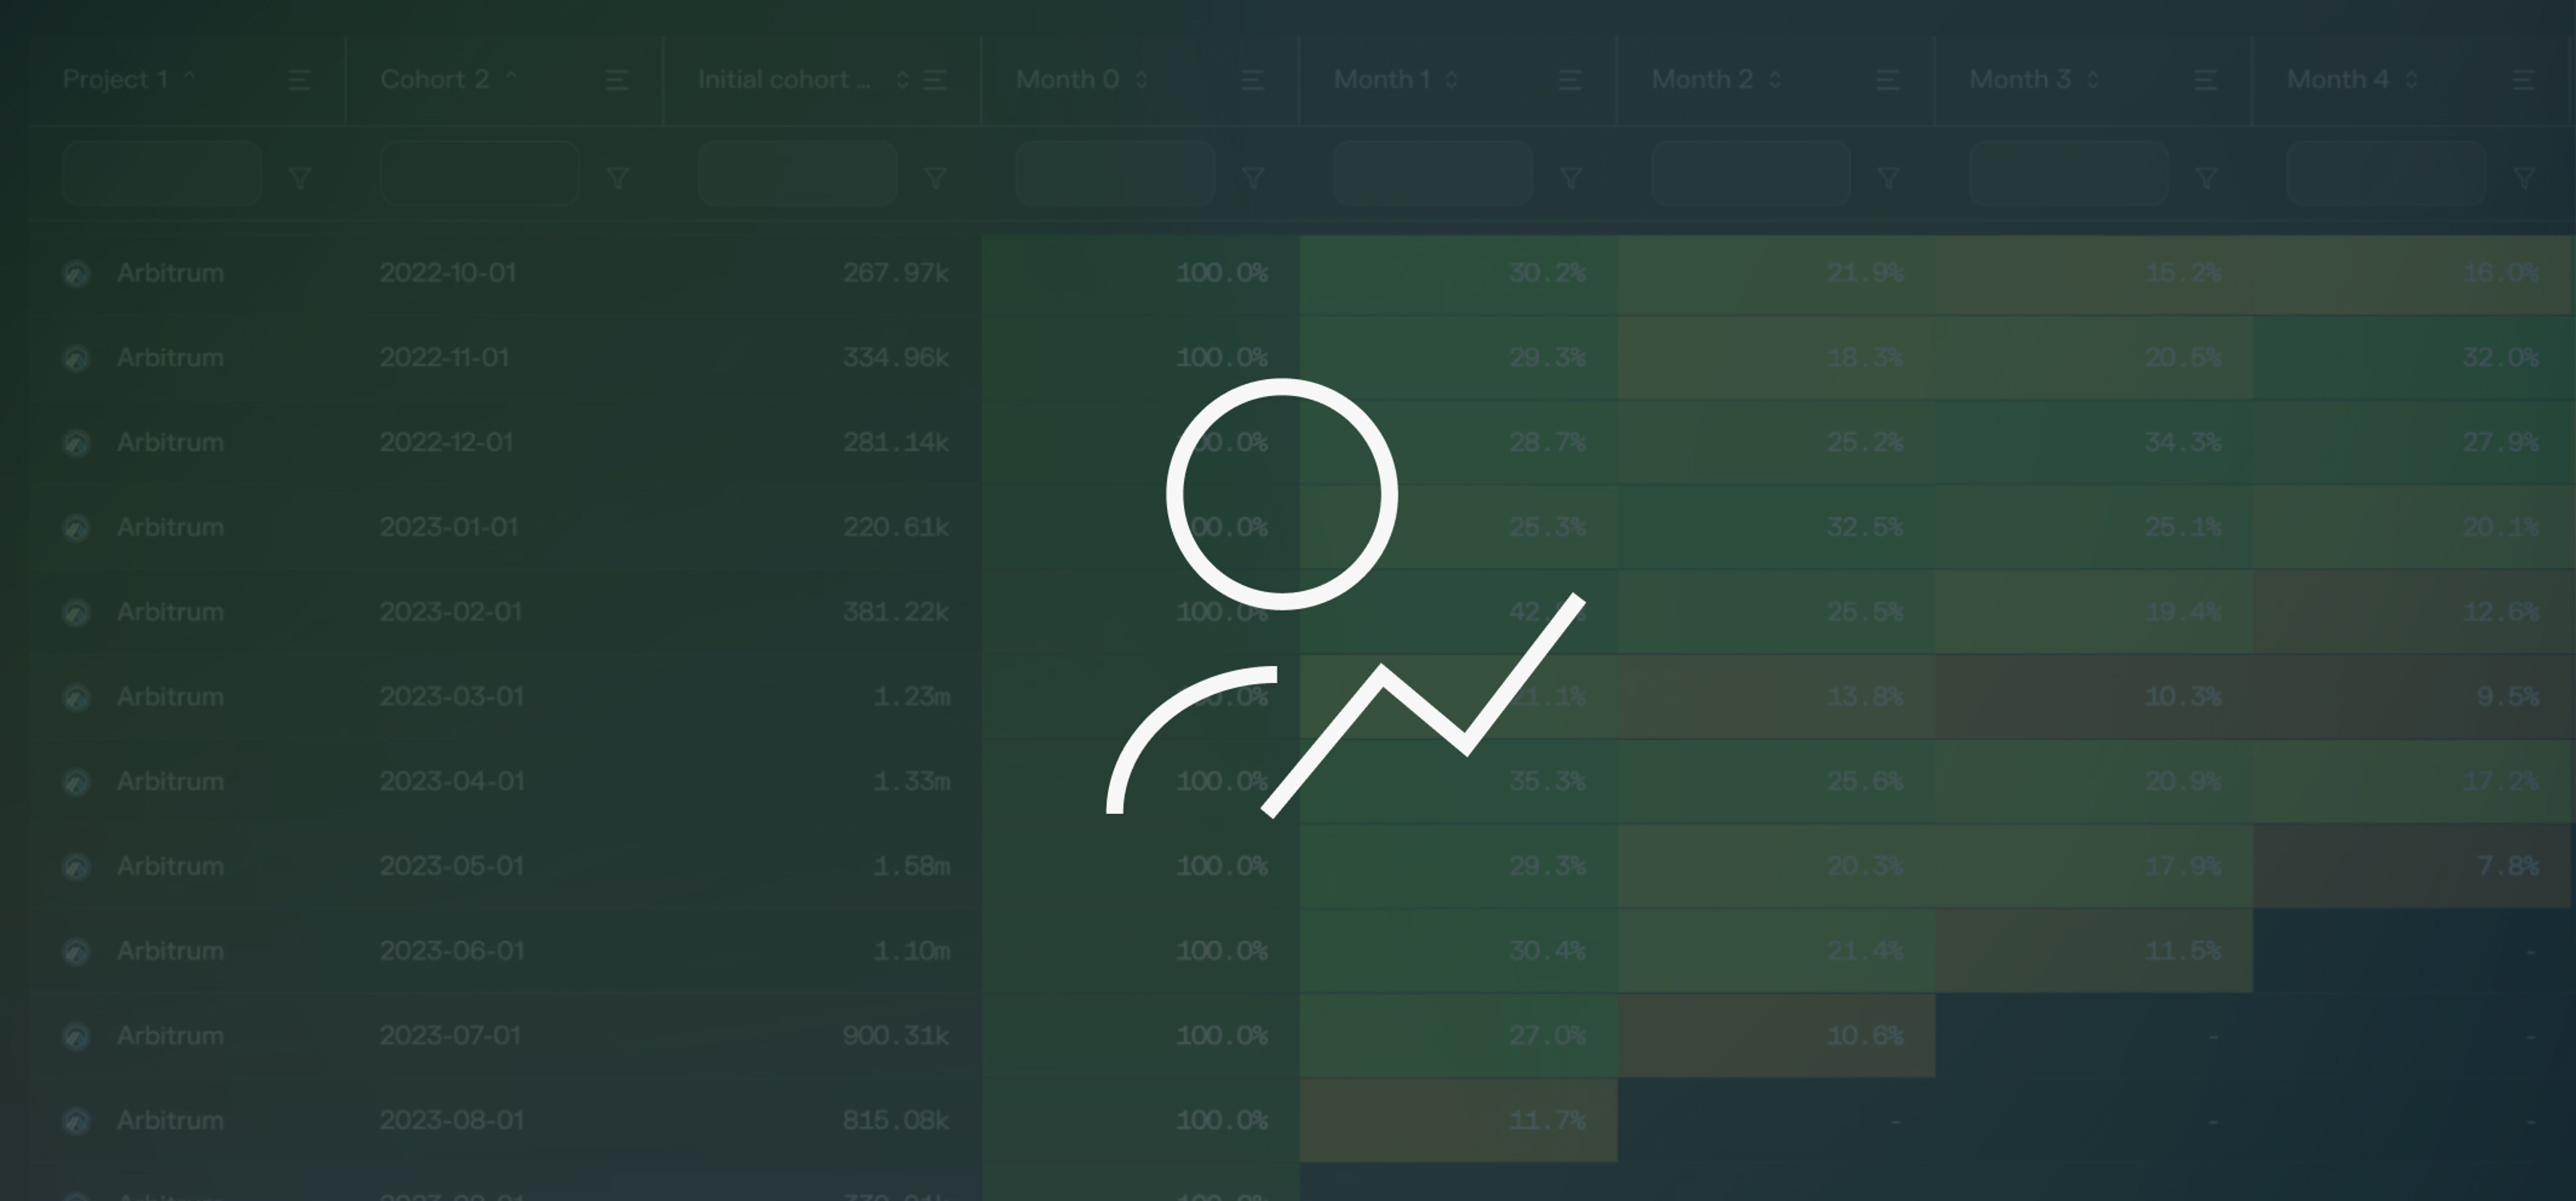
How to read a cohort analysis table?
The cohort analysis tables might look a bit overwhelming at first glance, but breaking them down column by column makes the interpretation of the data a lot easier.
A walkthrough of the different columns, from left to right:
- Cohort: shows which month is tracked, e.g. March 2022.
- Initial cohort size: shows how many new users made a fee or revenue-generating transaction during that month, e.g. 685.
- Month 0: includes the entire initial cohort size, e.g. 685.
- Month 1: shows what % of the initial cohort (685) made a fee or revenue-generating transaction during the following month.
- Month 2: shows what % of the initial cohort size (685) made a fee or revenue-generating transaction two months from first using the protocol.
- Month 3-11: See Month 2 above.
1 - Month X retention rate = Churn
There are many ways to sort and filter cohort data, but two of the most common ways to analyze it are horizontally (retention curves for individual cohorts) and vertically (month X retention across all cohorts over time).
- Horizontally: learn how many users stay (and churn) as paying customers of the protocol over time. The higher the retention rates, the better.
- Vertically: learn how many users stay (and churn) as paying customers of the protocol e.g. after 2 months from when they first started to use the service. The higher the retention rates, the better.
Things to keep in mind
There are many factors that can affect the retention (and churn) rates of a protocol, such as ongoing token incentive campaigns. But one, more nuanced, difference has to do with the protocol’s business model.
In Figure 2, we’ve visualized the retention rates for both Lido’s (liquid staking) and Arbitrum’s (blockchain L2) monthly cohorts. On the surface, you might think that Lido is performing quite poorly compared to Arbitrum, but the comparison is not as simple as that.
For Lido, the user cohorts include unique depositor addresses, whereas for Arbitrum, the cohorts include unique transaction fee-paying addresses. Similar to how you might not be a DAU of your bank, you’re unlikely to use Lido on a daily or monthly basis, given the service that the protocol provides. For Arbitrum, you might have a reason to interact with the chain on a daily basis: to interact with all the different applications that have been built on top of it.
What’s next?
We’re currently working on the addition of more in-depth data sets, by building separate cohort tables for a protocol’s:
- Supply-side users (i): liquidity providers, lenders, NFT creators, etc.
- Supply-side users (ii): receipt token (DEX LP tokens, aUSDC, cUSDC, etc.) users
- Demand-side users (i): traders, borrowers, NFT collectors, etc.
- Demand-side users (ii): USDC, DAI, stETH, etc. users
We are extremely excited about the new Cohort analysis data set, and look forward to seeing how the analyst community makes use of it. Don’t hesitate to reach out to us via X DMs to share feedback and questions!
The authors of this content, or members, affiliates, or stakeholders of Token Terminal may be participating or are invested in protocols or tokens mentioned herein. The foregoing statement acts as a disclosure of potential conflicts of interest and is not a recommendation to purchase or invest in any token or participate in any protocol. Token Terminal does not recommend any particular course of action in relation to any token or protocol. The content herein is meant purely for educational and informational purposes only, and should not be relied upon as financial, investment, legal, tax or any other professional or other advice. None of the content and information herein is presented to induce or to attempt to induce any reader or other person to buy, sell or hold any token or participate in any protocol or enter into, or offer to enter into, any agreement for or with a view to buying or selling any token or participating in any protocol. Statements made herein (including statements of opinion, if any) are wholly generic and not tailored to take into account the personal needs and unique circumstances of any reader or any other person. Readers are strongly urged to exercise caution and have regard to their own personal needs and circumstances before making any decision to buy or sell any token or participate in any protocol. Observations and views expressed herein may be changed by Token Terminal at any time without notice. Token Terminal accepts no liability whatsoever for any losses or liabilities arising from the use of or reliance on any of this content.
Stay in the loop
Join our mailing list to get the latest insights!
Continue reading
Customer stories: Token Terminal’s Data Partnership with Linea
Through its partnership with Token Terminal, Linea turns transparency into a competitive advantage and continues to build trust with its growing community.
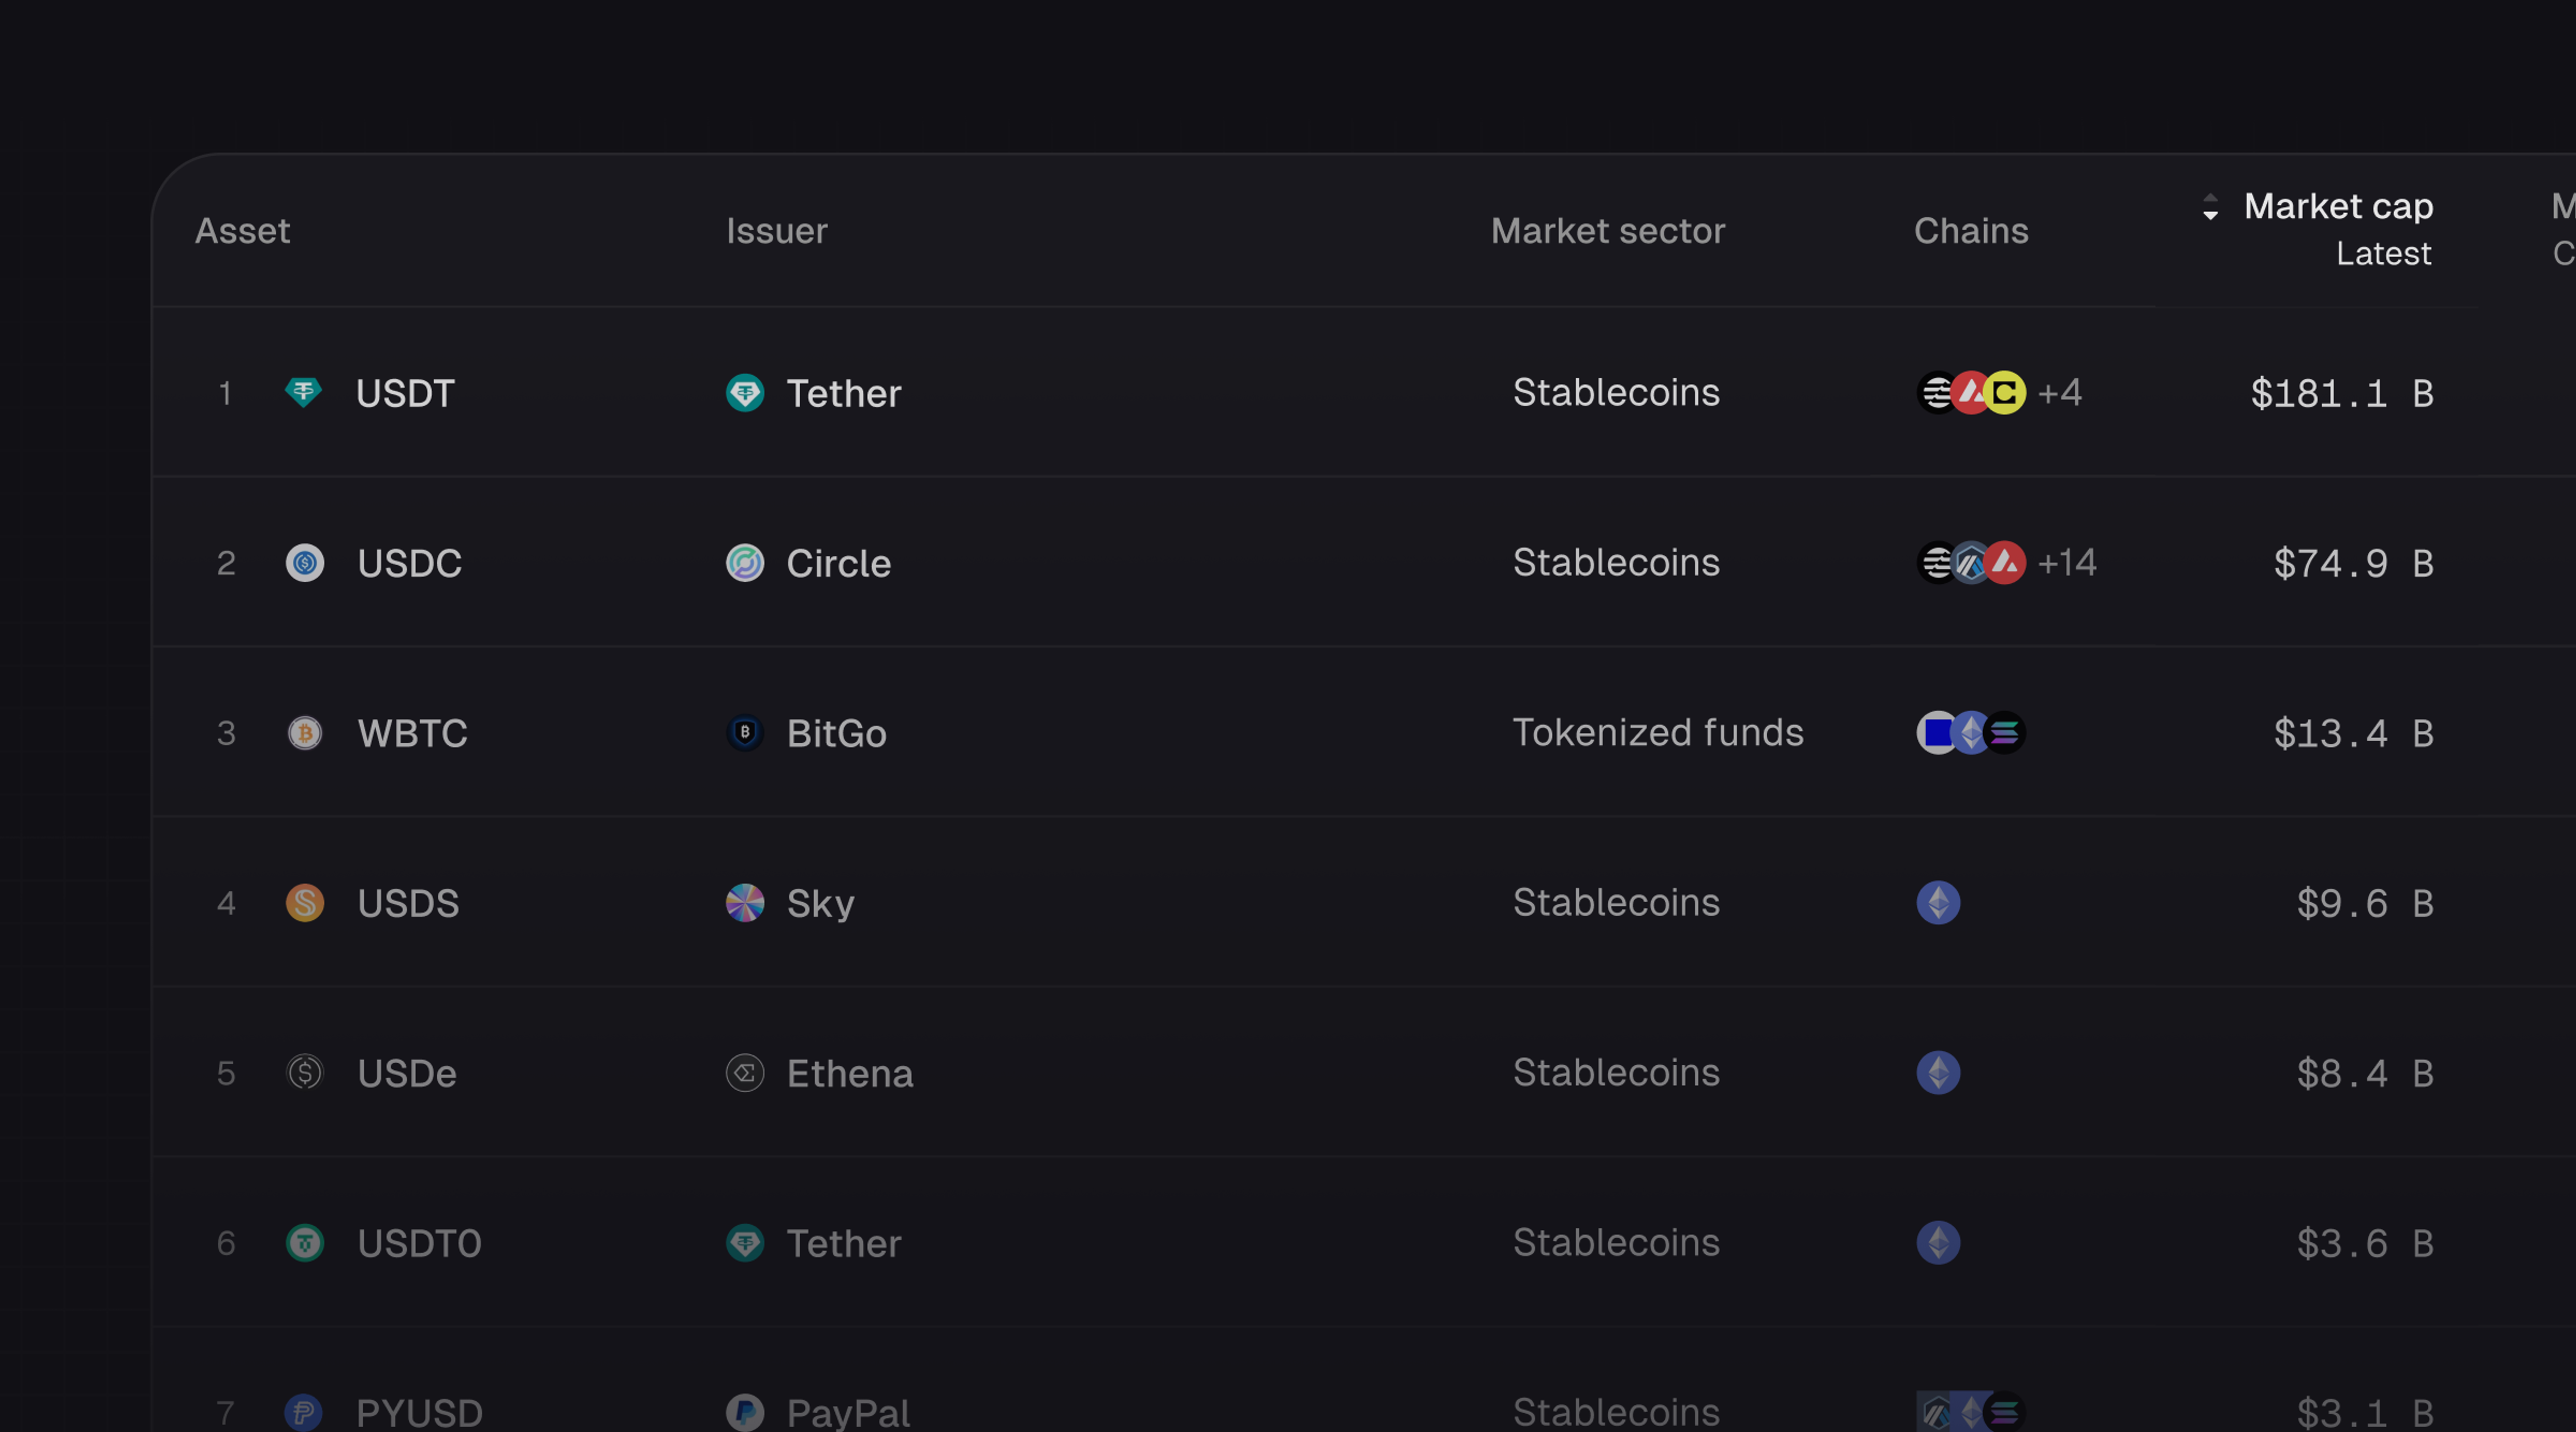
Introducing Tokenized Assets
Token Terminal is expanding its standardized onchain analytics to cover the rapidly growing category of tokenized real-world assets (RWAs) – starting with stablecoins, tokenized funds, and tokenized stocks.
Customer stories: Token Terminal’s Data Partnership with EigenCloud
Through its partnership with Token Terminal, EigenCloud turns transparency into a competitive advantage and continues to build trust with its growing community.