News
Edmund Tong
•
In this article, we provide an overview of Token Terminal's key metrics, how the metrics are calculated, and why we show them.
With the release of new metrics on Token Terminal, we have been receiving an increasing number of questions on what these metrics mean, how we derive them, and how investors should interpret them.
This article is meant to serve as a guide and a single source of truth for Token Terminal users. It includes illustrative examples of our dashboards, along with the relevant smart contract events or function calls used to calculate the metrics sourced from on-chain data.
It is also important to remember that no single metric is perfect in isolation, and should be used in a complementary way to each other when making investment decisions.
Contents:
- Market data
- Fully diluted market capitalization
- Circulating market capitalization
- Token trading volume
- Tokenholders
- Gross merchanise volume (GMV) data
- Total value locked
- Trading volume (DEX, NFT marketplace)
- Borrowing volume (lending)
- Assets staked (liquid staking derivative)
- Capital deployed (asset management)
- Transfer volume (cross-chain bridging)
- Financial data
- Fees
- Supply-side fees
- Revenue
- Token incentives
- Earnings
- Valuation data
- P/F ratio (fully diluted)
- P/F ratio (circulating)
- P/S ratio (fully diluted)
- P/S ratio (circulating)
- Cash management data
- Treasury
- Alternative data
- Daily active users
- Active developers
- Code commits
1. Market Data
Fully diluted market capitalization
What is this metric: Valuation of the protocol based on the maximum supply of its governance token.
How it is calculated: Maximum supply * token price, sourced from Coingecko.
Why do we show it: Shows the protocol's true valuation by taking into account all the tokens that have been issued.
Example:
Bitcoin dashboard: https://tokenterminal.com/terminal/projects/bitcoin
Optimism dashboard: https://tokenterminal.com/terminal/projects/optimism
Chainlink dashboard: https://tokenterminal.com/terminal/projects/chainlink
Circulating market capitalization
What is this metric: Valuation of the protocol based on the circulating supply of its governance token.
How it is calculated: Circulating supply * token price, sourced from Coingecko.
Why do we show it: When charted against the fully diluted market capitalization, it shows the magnitude of future unlocks that could potentially drive down the price.
Example:
Ethereum dashboard: https://tokenterminal.com/terminal/projects/ethereum
Cardano dashboard: https://tokenterminal.com/terminal/projects/cardano
PancakeSwap dashboard: https://tokenterminal.com/terminal/projects/pancakeswap
Token trading volume
What is this metric: Trading volume of the protocol's governance token across CEXs and DEXs.
How it is calculated: Trading volume on supported CEXs & DEXs, sourced from Coingecko.
Why do we show it: Shows if there's proper price discovery for the token.
Example:
Dogecoin dashboard: https://tokenterminal.com/terminal/projects/dogecoin
Polygon dashboard: https://tokenterminal.com/terminal/projects/polygon
Ribbon Finance dashboard: https://tokenterminal.com/terminal/projects/ribbon-finance
Tokenholders
What is this metric: Number of unique governance tokenholders.
How it is calculated: Number of unique addresses with a governance token balance greater than 0, sourced from onchain data.
Why do we show it: Shows if the protocol's ownership is concentrated or decentralized, often tied to the maturity of the protocol (concentrated ownership more common at the early stage).
Example:
Compound dashboard: https://tokenterminal.com/terminal/projects/compound
SushiSwap dashboard: https://tokenterminal.com/terminal/projects/sushiswap
0x dashboard: https://tokenterminal.com/terminal/projects/0x
2. Gross merchandise volume (GMV) data
Total value locked (TVL)
What is this metric: User deposits to the protocol's smart contracts (these assets are not owned by the protocol).
How it is calculated: Value of funds held across a protocol's smart contracts.
Why do we show it: Shows how much value users are willing to deposit to a protocol's contracts, i.e. if there is trust in the protocol's contracts (security-wise).
Example:
Convex Finance dashboard: https://tokenterminal.com/terminal/projects/convex-finance
Transaction volume (L1 / L2 blockchain)
What is this metric: Transaction volume on a blockchain (L1 / L2).
How it is calculated: Value of the tokens being transacted on a blockchain, sourced from onchain data.
Why do we show it: Shows how much value users are willing to transact on a blockchain, i.e. if there is trust in the blockchain to transact at scale.
Trading volume (DEX / NFT marketplace)
What is this metric: Trading volume on a DEX / NFT marketplace.
How it is calculated: Value of tokens being exchanged at a DEX / NFT marketplace.
Why do we show it: Shows how much value traders are willing to trade on a DEX / NFT marketplace, i.e. if there is trust in the DEX / NFT marketplace to trade at scale.
Example:
Relevant events for Uniswap: Swap event, Pair / Pool contracts
Uniswap dashboard: https://tokenterminal.com/terminal/projects/uniswap
Relevant events for GMX: IncreasePosition / DecreasePosition / Swap events, Vault contract
GMX dashboard: https://tokenterminal.com/terminal/projects/gmx
Relevant events / function calls for OpenSea: atomicMatch function call, WyvernExchange contract + OrderFulfilled event, Seaport contract
OpenSea dashboard: https://tokenterminal.com/terminal/projects/opensea
Active loans (lending)
What is this metric: Outstanding loans on a lending protocol.
How it is calculated: Value of funds owed by borrowers to lenders.
Why do we show it: Shows how much value borrowers are willing to borrow on a protocol, i.e. if there is trust in the lending protocol to lend & borrow at scale.
Example:
Relevant events for Aave: Mint / Burn events, SToken / VToken contracts
Aave dashboard: https://tokenterminal.com/terminal/projects/aave
Relevant events for Compound: AccrueInterest event, CEther / CErc20 / CErc20Delegator contracts
Compound dashboard: https://tokenterminal.com/terminal/projects/compound
Relevant events for Euler: AssetStatus event, Euler contract
Euler dashboard: https://tokenterminal.com/terminal/projects/euler
Assets staked (liquid staking derivative)
What is this metric: User deposits staked by a liquid staking protocol.
How it is calculated: Value of funds staked across the protocol's smart contracts.
Why do we show it: Shows how much value stakers are willing to stake through a protocol, i.e. if there is trust in the liquid staking protocol to stake at scale.
Example:
Relevant events for Lido Finance: PostTotalShares event, Oracle contract
Lido Finance dashboard: https://tokenterminal.com/terminal/projects/lido-finance
Relevant events for StakeWise: DepositAdded event, Solos contract
StakeWise dashboard: https://tokenterminal.com/terminal/projects/stakewise
Relevant events for Ankr: StakeConfirmed event, ETHStaking contract
Ankr dashboard: https://tokenterminal.com/terminal/projects/ankr
Transfer volume (cross-chain bridging)
What is this metric: Tokens transferred through a cross-chain bridging protocol.
How it is calculated: Value of tokens transferred through a cross-chain bridge.
Why do we show it: Shows how much bridge users are willing to transfer through a bridging protocol, i.e. if there is trust in the bridging protocol to transfer at scale.
Example:
Relevant events for Stargate: Swap / SendToChain events, Pool / StargateToken contracts
Stargate dashboard: https://tokenterminal.com/terminal/projects/stargate
Relevant events for Synapse: TokenDeposit / TokenDepositAndSwap / TokenRedeemAndSwap / TokenRedeem / TokenRedeemV2 / TokenRedeemAndRemove events, SynapseBridge contract
Synapse dashboard: https://tokenterminal.com/terminal/projects/synapse
3. Financial data
Fees
What is this metric: Fees paid by end users.
How it is calculated: Value of the aggregate fees paid by end users, sourced from onchain data.
Why do we show it: Shows if users are willing to pay to use a protocol, i.e. if there is product market fit (especially if there are no token incentives).
Example:
Relevant events for Synthetix: PositionModified event, FuturesMarket contract + all sUSD token transfers to the FeeCollector contract
Synthetix dashboard: https://tokenterminal.com/terminal/projects/synthetix
Relevant events for Perpetual Protocol: PositionChanged event, ClearingHouse event
Perpetual Protocol dashboard: https://tokenterminal.com/terminal/projects/perpetual-protocol
Relevant events for LooksRare: RoyaltyPayment event, Exchange contract
LooksRare dashboard: https://tokenterminal.com/terminal/projects/looksrare
Relevant events for Venus: AccrueInterest event, vBNB / VBep20Delegate contracts
Venus dashboard: https://tokenterminal.com/terminal/projects/venus
Relevant token transfers for Lido Finance: All stETH token transfers to the Lido DAO treasury contract
Lido Finance dashboard: https://tokenterminal.com/terminal/projects/lido-finance
Supply-side fees
What is this metric: Portion of fees paid to service providers.
How it is calculated: Value of the fees paid to service providers (LPs, lenders, creators, etc.), sourced from onchain data.
Why do we show it: Shows what percentage of the fees the protocol passes on to service providers.
Example:
SushiSwap dashboard: https://tokenterminal.com/terminal/projects/sushiswap
BENQI dashboard: https://tokenterminal.com/terminal/projects/benqi
Goldfinch dashboard: https://tokenterminal.com/terminal/projects/goldfinch
Revenue
What is this metric: Portion of fees kept by the protocol (and its tokenholders).
How it is calculated: Value of the fees kept by the protocol (and tokenholders), sourced from onchain data.
Why do we show it: Shows what percentage of the fees the protocol captures for itself.
Example:
MakerDAO dashboard: https://tokenterminal.com/terminal/projects/makerdao
Trader Joe dashboard: https://tokenterminal.com/terminal/projects/trader-joe
Radiant Capital dashboard: https://tokenterminal.com/terminal/projects/radiant-capital
Token incentives
What is this metric: Governance tokens distributed to users (token-based compensation).
How it is calculated: Value of a protocol’s governance tokens that have been claimed by users, sourced from onchain data.
Why do we show it: Shows how much the protocol is subsidizing the use of the protocol by issuing tokens to its users, i.e. how much existing tokenholders are being diluted.
Example:
Relevant events for SushiSwap: Harvest event, MasterChefV2 / MiniChef contracts
SushiSwap dashboard: https://tokenterminal.com/terminal/projects/sushiswap
Relevant events for Gains Network: ReferralFeeCharged event, GNSTradingCallbacksV2 / GNSTradingCallbacksV3 contracts
Gains Network dashboard: https://tokenterminal.com/terminal/projects/gains-network
Relevant events for Maple Finance: RewardPaid event, MplRewards contract + MPL token transfers to liquidity providers addresses
Maple Finance dashboard: https://tokenterminal.com/terminal/projects/maple-finance
Relevant events for Index Cooperative: INDEX token transfers from the RewardDistributor contracts
Index Cooperative dashboard: https://tokenterminal.com/terminal/projects/index-cooperative
Relevant events for Hop Protocol: RewardPaid event, StakingRewards contract
Hop Protocol dashboard: https://tokenterminal.com/terminal/projects/hop-protocol
Earnings
What is this metric: Net income of a protocol (excl. operating expenses).
How it is calculated: Revenue - token incentives, sourced from onchain data.
Why do we show it: Shows how much the protocol earns after token incentives, i.e. if the protocol has an economically sustainable business or not.
Example:
MakerDAO dashboard: https://tokenterminal.com/terminal/projects/makerdao
SpookySwap dashboard: https://tokenterminal.com/terminal/projects/spookyswap
X2Y2 dashboard: https://tokenterminal.com/terminal/projects/x2y2
4. Valuation data
P/F ratio (fully diluted)
What is this metric: Valuation multiple, based on the fees paid by end users.
How it is calculated: Fully diluted market capitalization / annualized fees.
Why do we show it: Shows how many years it would take for the fees to "repay" the fully diluted valuation.
Example:
Stargate dashboard: https://tokenterminal.com/terminal/projects/stargate
PoolTogether dashboard: https://tokenterminal.com/terminal/projects/pooltogether
Mycelium dashboard: https://tokenterminal.com/terminal/projects/mycelium
P/F ratio (circulating)
What is this metric: Valuation multiple, based on the fees paid by end users.
How it is calculated: Circulating market capitalization / annualized fees.
Why do we show it: Shows how many years it would take for the fees to "repay" the circulating valuation.
Example:
Ethereum Name Service dashboard: https://tokenterminal.com/terminal/projects/ethereum-name-service
Lyra dashboard: https://tokenterminal.com/terminal/projects/lyra
Kleros dashboard: https://tokenterminal.com/terminal/projects/kleros
P/S ratio (fully diluted)
What is this metric: Valuation multiple, based on the revenue earned by the protocol.
How it is calculated: Fully diluted market capitalization / annualized revenue.
Why do we show it: Shows how many years it would take for the revenue to "repay" the fully diluted valuation.
Example:
Hop Protocol dashboard: https://tokenterminal.com/terminal/projects/hop-protocol
NEAR Protocol dashboard: https://tokenterminal.com/terminal/projects/near-protocol
Notional Finance dashboard: https://tokenterminal.com/terminal/projects/notional-finance
P/S ratio (circulating)
What is this metric: Valuation multiple, based on the revenue earned by the protocol.
How it is calculated: Circulating market capitalization / annualized revenue.
Why do we show it: Shows how many years it would take for the revenue to "repay" the circulating valuation.
Example:
Optimism dashboard: https://tokenterminal.com/terminal/projects/optimism
Rarible dashboard: https://tokenterminal.com/terminal/projects/rarible
Filecoin dashboard: https://tokenterminal.com/terminal/projects/filecoin
5. Cash management data
Treasury
What is this metric: Assets in the protocol's treasury (incl. unallocated governance tokens).
How it is calculated: Value of the tokens held across a protocol's treasury contracts, sourced from onchain data.
Why do we show it: Shows how much the protocol is generating in business income and how it manages its treasury over time.
Example:
Rook dashboard
Example:
Uniswap dashboard: https://tokenterminal.com/terminal/projects/uniswap
Example:
Ethereum Name Service dashboard: https://tokenterminal.com/terminal/projects/ethereum-name-service
6. Alternative data
Daily active users
What is this metric: Unique addresses that use the protocol's service during a 24h period.
How it is calculated: Number of unique addresses interacting with the protocol's business relevant smart contracts, sourced from onchain data.
Why do we show it: Important to know if there are 3 vs. 300k users, gives a better understanding of the supply & demand-side dependencies.
Example:
Relevant events for GMX: IncreasePosition / DecreasePosition / Swap events, Vault contract
GMX dashboard: https://tokenterminal.com/terminal/projects/gmx
Relevant events for Across: FilledRelay / DepositRelayed events, EthereumSpokePool / ArbitrumSpokePool / OptimismSpokePool / PolygonSpokePool / BridgePoolProd contracts
Across dashboard: https://tokenterminal.com/terminal/projects/across
Relevant events for Blur: OrdersMatched event, BlurExchange contract
Blur dashboard: https://tokenterminal.com/terminal/projects/blur
Active developers
What is this metric: Core developers that contribute to the protocol's public GitHub repositories.
How it is calculated: Number of distinct users that made 1+ commits to the protocol's public repositories during the past 30 days, sourced from GitHub.
Why do we show it: Important to know if there are 10 vs. 100 core developers, gives a better understanding of the contributor dependencies.
Example:
Flashbots dashboard: https://tokenterminal.com/terminal/projects/flashbots
Sound dashboard: https://tokenterminal.com/terminal/projects/sound
The Graph dashboard: https://tokenterminal.com/terminal/projects/the-graph
Code commits
What is this metric: New commits to the protocol's public GitHub repositories.
How it is calculated: Number of commits to the protocol's public repositories, sourced from GitHub.
Why do we show it: Important to know if there are few vs. many regular commits, gives a better understanding of the pace of development.
Example:
Gitcoin dashboard: https://tokenterminal.com/terminal/projects/gitcoin
Zcash dashboard: https://tokenterminal.com/terminal/projects/zcash
1inch dashboard: https://tokenterminal.com/terminal/projects/1inch
The authors of this content, or members, affiliates, or stakeholders of Token Terminal may be participating or are invested in protocols or tokens mentioned herein. The foregoing statement acts as a disclosure of potential conflicts of interest and is not a recommendation to purchase or invest in any token or participate in any protocol. Token Terminal does not recommend any particular course of action in relation to any token or protocol. The content herein is meant purely for educational and informational purposes only, and should not be relied upon as financial, investment, legal, tax or any other professional or other advice. None of the content and information herein is presented to induce or to attempt to induce any reader or other person to buy, sell or hold any token or participate in any protocol or enter into, or offer to enter into, any agreement for or with a view to buying or selling any token or participating in any protocol. Statements made herein (including statements of opinion, if any) are wholly generic and not tailored to take into account the personal needs and unique circumstances of any reader or any other person. Readers are strongly urged to exercise caution and have regard to their own personal needs and circumstances before making any decision to buy or sell any token or participate in any protocol. Observations and views expressed herein may be changed by Token Terminal at any time without notice. Token Terminal accepts no liability whatsoever for any losses or liabilities arising from the use of or reliance on any of this content.
Stay in the loop
Join our mailing list to get the latest insights!
Continue reading
Customer stories: Token Terminal’s Data Partnership with Linea
Through its partnership with Token Terminal, Linea turns transparency into a competitive advantage and continues to build trust with its growing community.
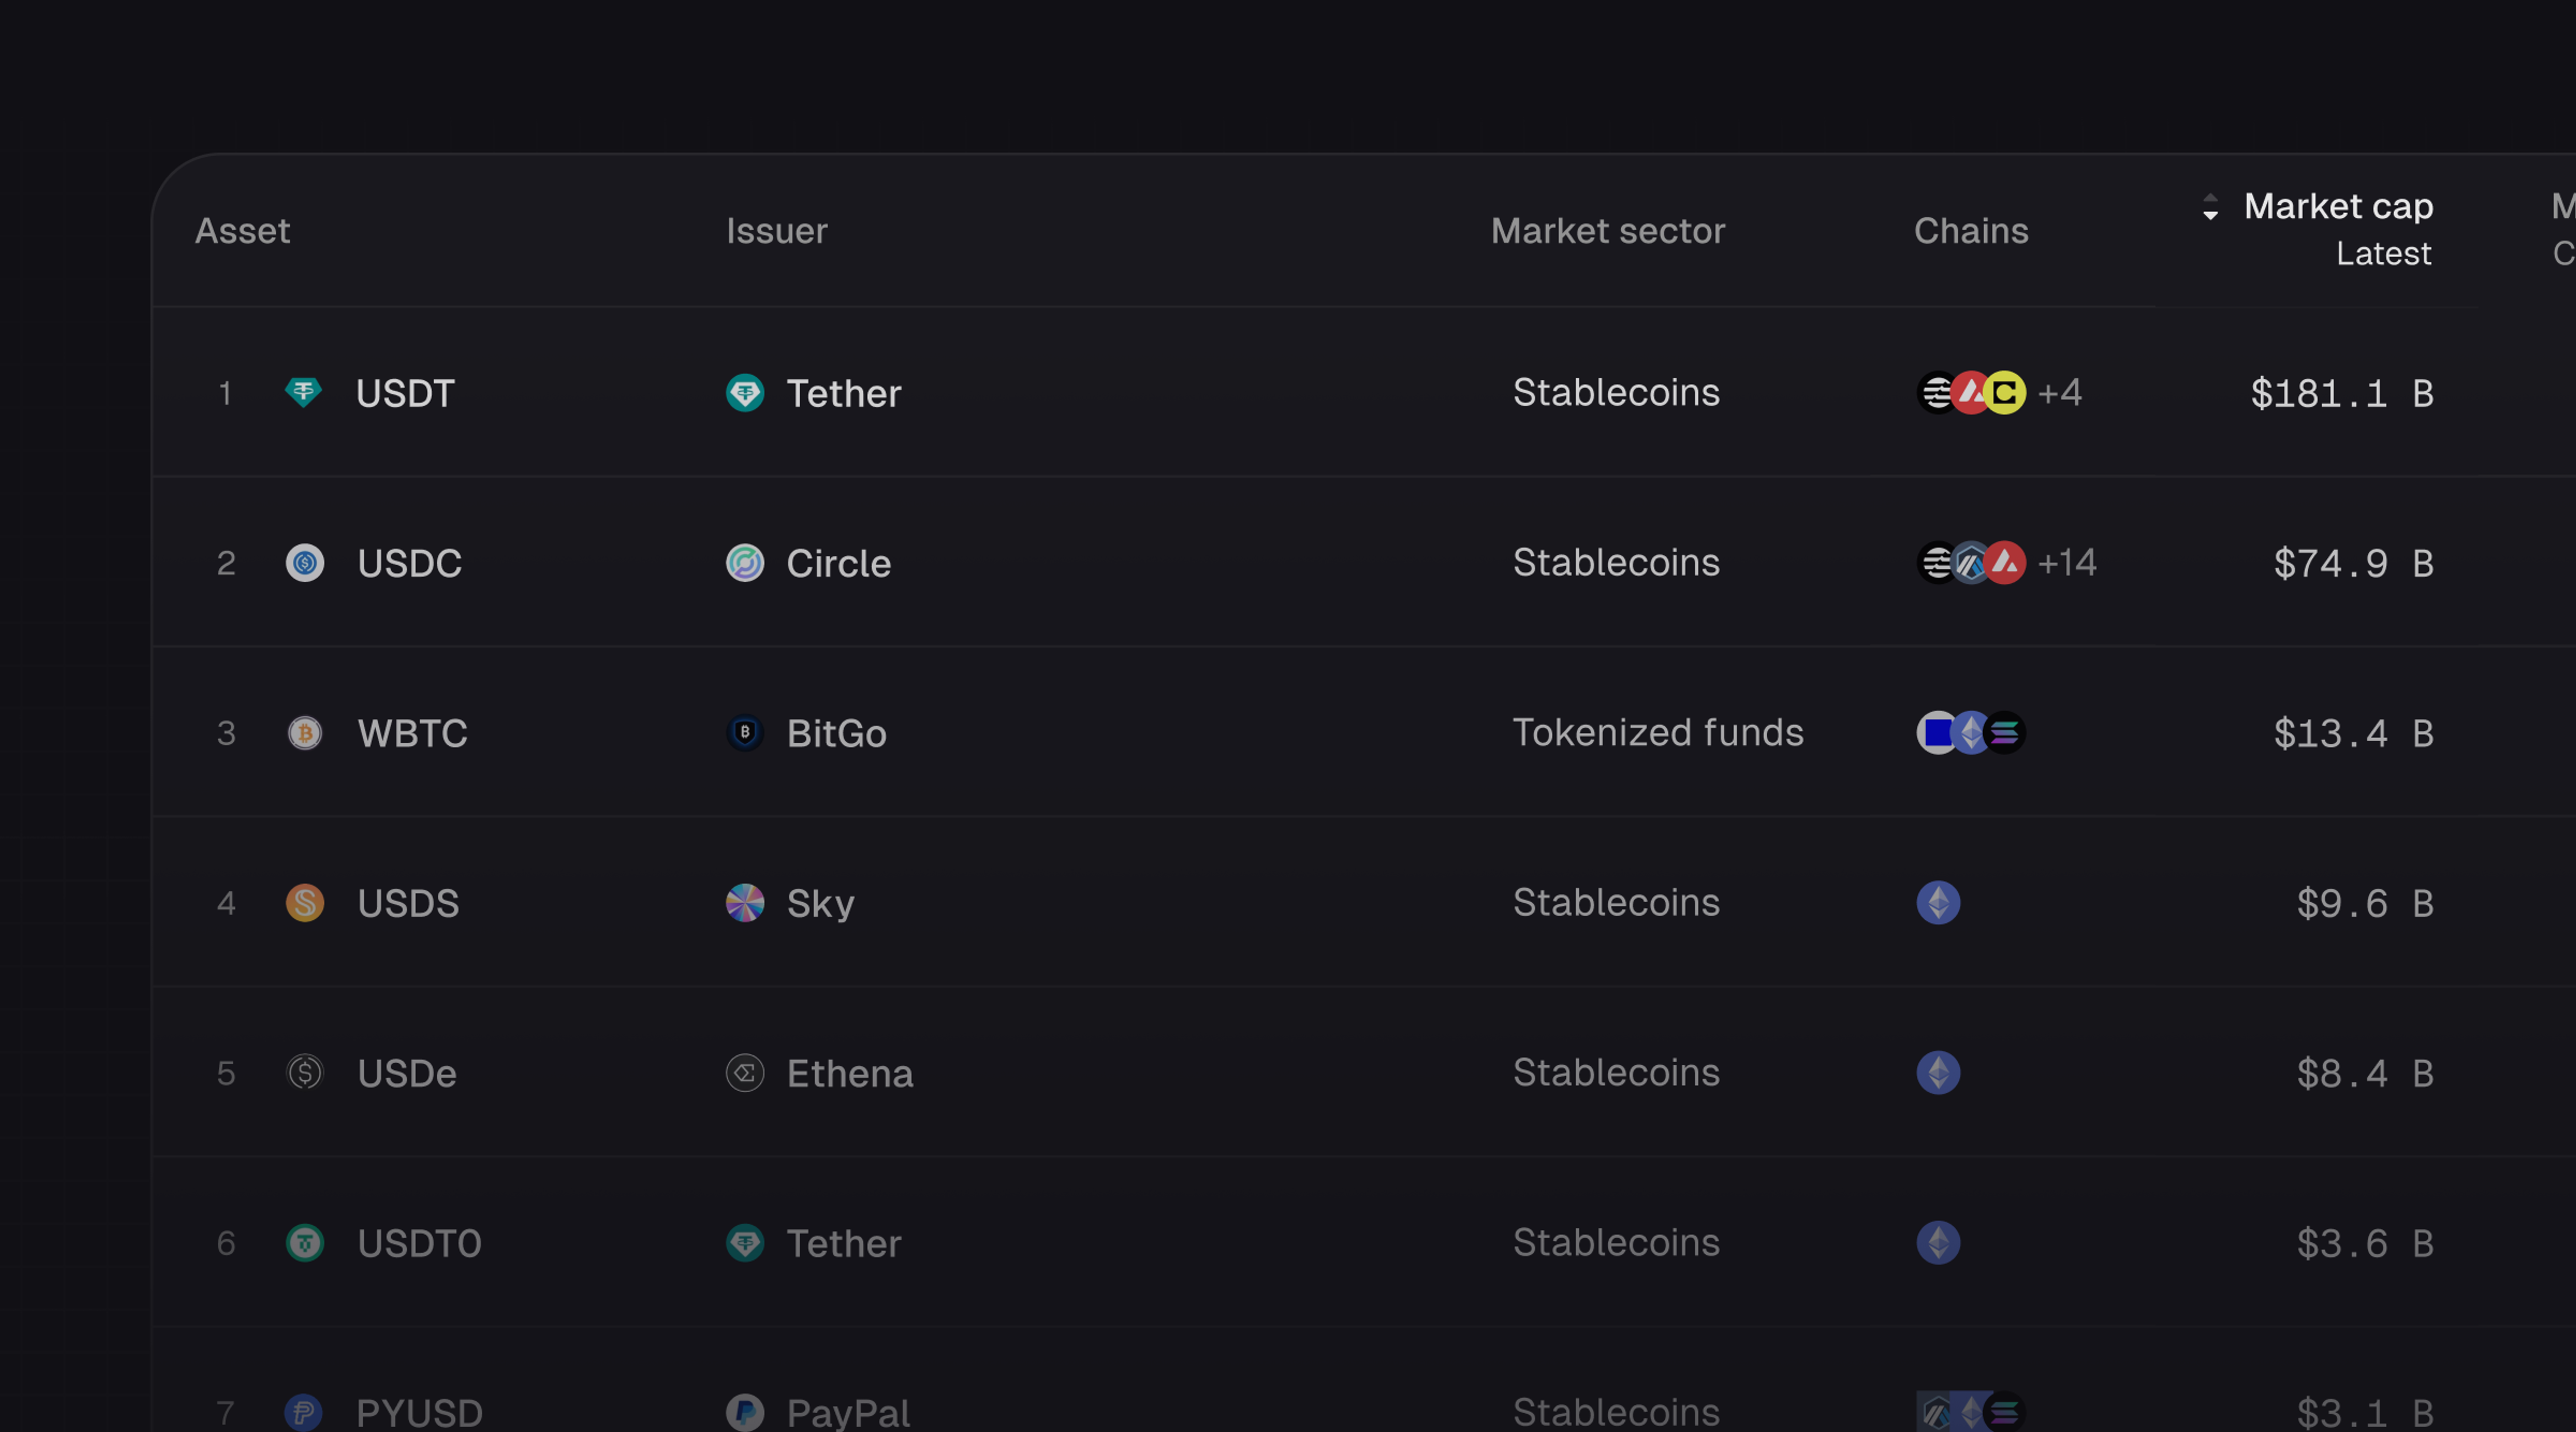
Introducing Tokenized Assets
Token Terminal is expanding its standardized onchain analytics to cover the rapidly growing category of tokenized real-world assets (RWAs) – starting with stablecoins, tokenized funds, and tokenized stocks.
Customer stories: Token Terminal’s Data Partnership with EigenCloud
Through its partnership with Token Terminal, EigenCloud turns transparency into a competitive advantage and continues to build trust with its growing community.