News
An Analyst's Guide to the Terminal
Token Terminal
•
This week we launched our new data portal: the Terminal.
An Analyst's Guide to the Terminal
The definitive resource for all cryptoasset investors
After a few months of heads-down building, it's time for us to reveal the first version of the Terminal. Our long-term goal is to work together with our users – the project teams and communities, investors, analysts, and other stakeholders – to build out the most robust and useful investment analysis toolkit for the crypto markets.
"Launched in 1982, long before PCs and the Internet became ubiquitous, the Bloomberg Terminal brought transparency to financial markets. It connected market participants to groundbreaking data, analytics, and information-delivery service and revolutionized an industry."
Now, some forty years later, it feels like the Internet-native capital markets are on the verge of their Bloomberg moment.
In a nascent market like crypto, the lack of standards makes it hard to conduct relative analysis on the performance of crypto projects. With this initial release of the Terminal, we hope to provide tools for investors and analysts alike to tackle this issue. In this article, we go through the initial layout for the project-specific dashboards that can be found in the Terminal. We hope to engage the community to work together with us in improving this initial framework.
P.S. Even if crypto is still largely associated with cryptocurrencies and Bitcoin, we hope that the Terminal sheds light on the promise of Internet-native financial markets, especially for those who still believe currency to be the only viable use case for cryptoassets.
Metrics initially available in the Terminal
- Market cap - what is a project valued at? Calculated based on a project's fully-diluted token supply.
- Price to sales ratio (P/S) - how is a project valued in relation to its revenues? Calculated as a project's market cap divided by its annualized revenue. Annualized revenue is a forward-looking revenue estimate that is calculated based on a simple 30-day moving average.
- Token trading volume to market cap ratio (VOL/MC) - how efficient is the price discovery for a project’s native token? Calculated as the daily trading volume for the project's native token divided by its market cap.
- Total value locked (TVL) - how much money has been deposited into a project’s smart contracts? Calculated as the liquidity deposited to a project's smart contracts (exchange) or as the difference between the assets deposited and borrowed (lending).
- Gross merchandise volume (GMV) - what is the demand for a project’s service? Calculated as the project's trading (exchange) or borrowing (lending) volume.
- Revenue - how much are users paying to use a project’s service? Calculated as GMV* Take rate. For now, revenue refers to the total fees paid by the project's users. Where available, we’ve also included data on how the total revenues are split between the supply-side participants and the owners (tokenholders) of a protocol.
- Take rate - what does it cost to use a project’s service? Refers to the fee charged on the GMV, either in the form of a trading fee (exchange) or an interest rate (lending).
How to get the most out of the charts
General tips
When going through an individual project's dashboard, it's useful to write down the:
- launch date for the project's native token,
- dates for potential token incentive distributions, and
- dates for when new assets (trading pools or lending markets) have been included to the project's platform.
These events are usually clearly visible in the GMV and revenue composition charts. For example, the launch of token incentives can temporarily increase the demand for the project's service (increase its GMV).
Counter charts
The counter charts focus on current values, benchmarked against the project's peer group (currently other DeFi projects listed on Token Terminal). In addition, they include month over month changes and compounded monthly growth rates (CMGR) for longer time periods. When looking at the counter charts, it is useful to think about what could explain the upward or downward movement month over month? Is the movement inline or in contrast with the project's peer group, why?
Historical charts
The historical charts provide deeper insight into a project's development over time. In historical charts, it's useful to look for patterns (stable, volatile, one-off spikes or drops, correlation with the peer group, etc.) and the underlying events that could explain them, such as token incentive launches. The toggle feature enables the user to focus the view on either the project or the peer group (DeFi average).
Composition and normalized charts
The composition charts reveal the underlying dynamics of a project's business. For GMV, which trading pools or lending markets are most used? For take rates, which trading pools or lending markets charge the highest or lowest fees? For revenue, which trading pools or lending markets generate the most fees? Normalized versions of composition charts show how the relationships between the different trading pools or lending markets have evolved over time. The toggle feature enables the user to focus the view on specific trading pools or lending markets.
Charts with multiple trading pools or lending markets
For projects that have multiple different GMV and revenue components, we've chosen to visualize the nine components with the most GMV and revenue during the relevant time period (i.e. 30-days, 180-days or since launch) in addition to an "Other" category. A large "Other" category would indicate that the long-tail of trading pools or lending markets generate significant GMV or revenue and vice versa. The toggle feature enables the user to focus the view on specific trading pools or lending markets.
If you can imagine spending your days creating and analyzing charts similar to those in the Terminal, shoot us a DM on Twitter or email people@tokenterminal.xyz, and let's figure out a way to work together!
The authors of this content, or members, affiliates, or stakeholders of Token Terminal may be participating or are invested in protocols or tokens mentioned herein. The foregoing statement acts as a disclosure of potential conflicts of interest and is not a recommendation to purchase or invest in any token or participate in any protocol. Token Terminal does not recommend any particular course of action in relation to any token or protocol. The content herein is meant purely for educational and informational purposes only, and should not be relied upon as financial, investment, legal, tax or any other professional or other advice. None of the content and information herein is presented to induce or to attempt to induce any reader or other person to buy, sell or hold any token or participate in any protocol or enter into, or offer to enter into, any agreement for or with a view to buying or selling any token or participating in any protocol. Statements made herein (including statements of opinion, if any) are wholly generic and not tailored to take into account the personal needs and unique circumstances of any reader or any other person. Readers are strongly urged to exercise caution and have regard to their own personal needs and circumstances before making any decision to buy or sell any token or participate in any protocol. Observations and views expressed herein may be changed by Token Terminal at any time without notice. Token Terminal accepts no liability whatsoever for any losses or liabilities arising from the use of or reliance on any of this content.
Stay in the loop
Join our mailing list to get the latest insights!
Continue reading
Customer stories: Token Terminal’s Data Partnership with Linea
Through its partnership with Token Terminal, Linea turns transparency into a competitive advantage and continues to build trust with its growing community.
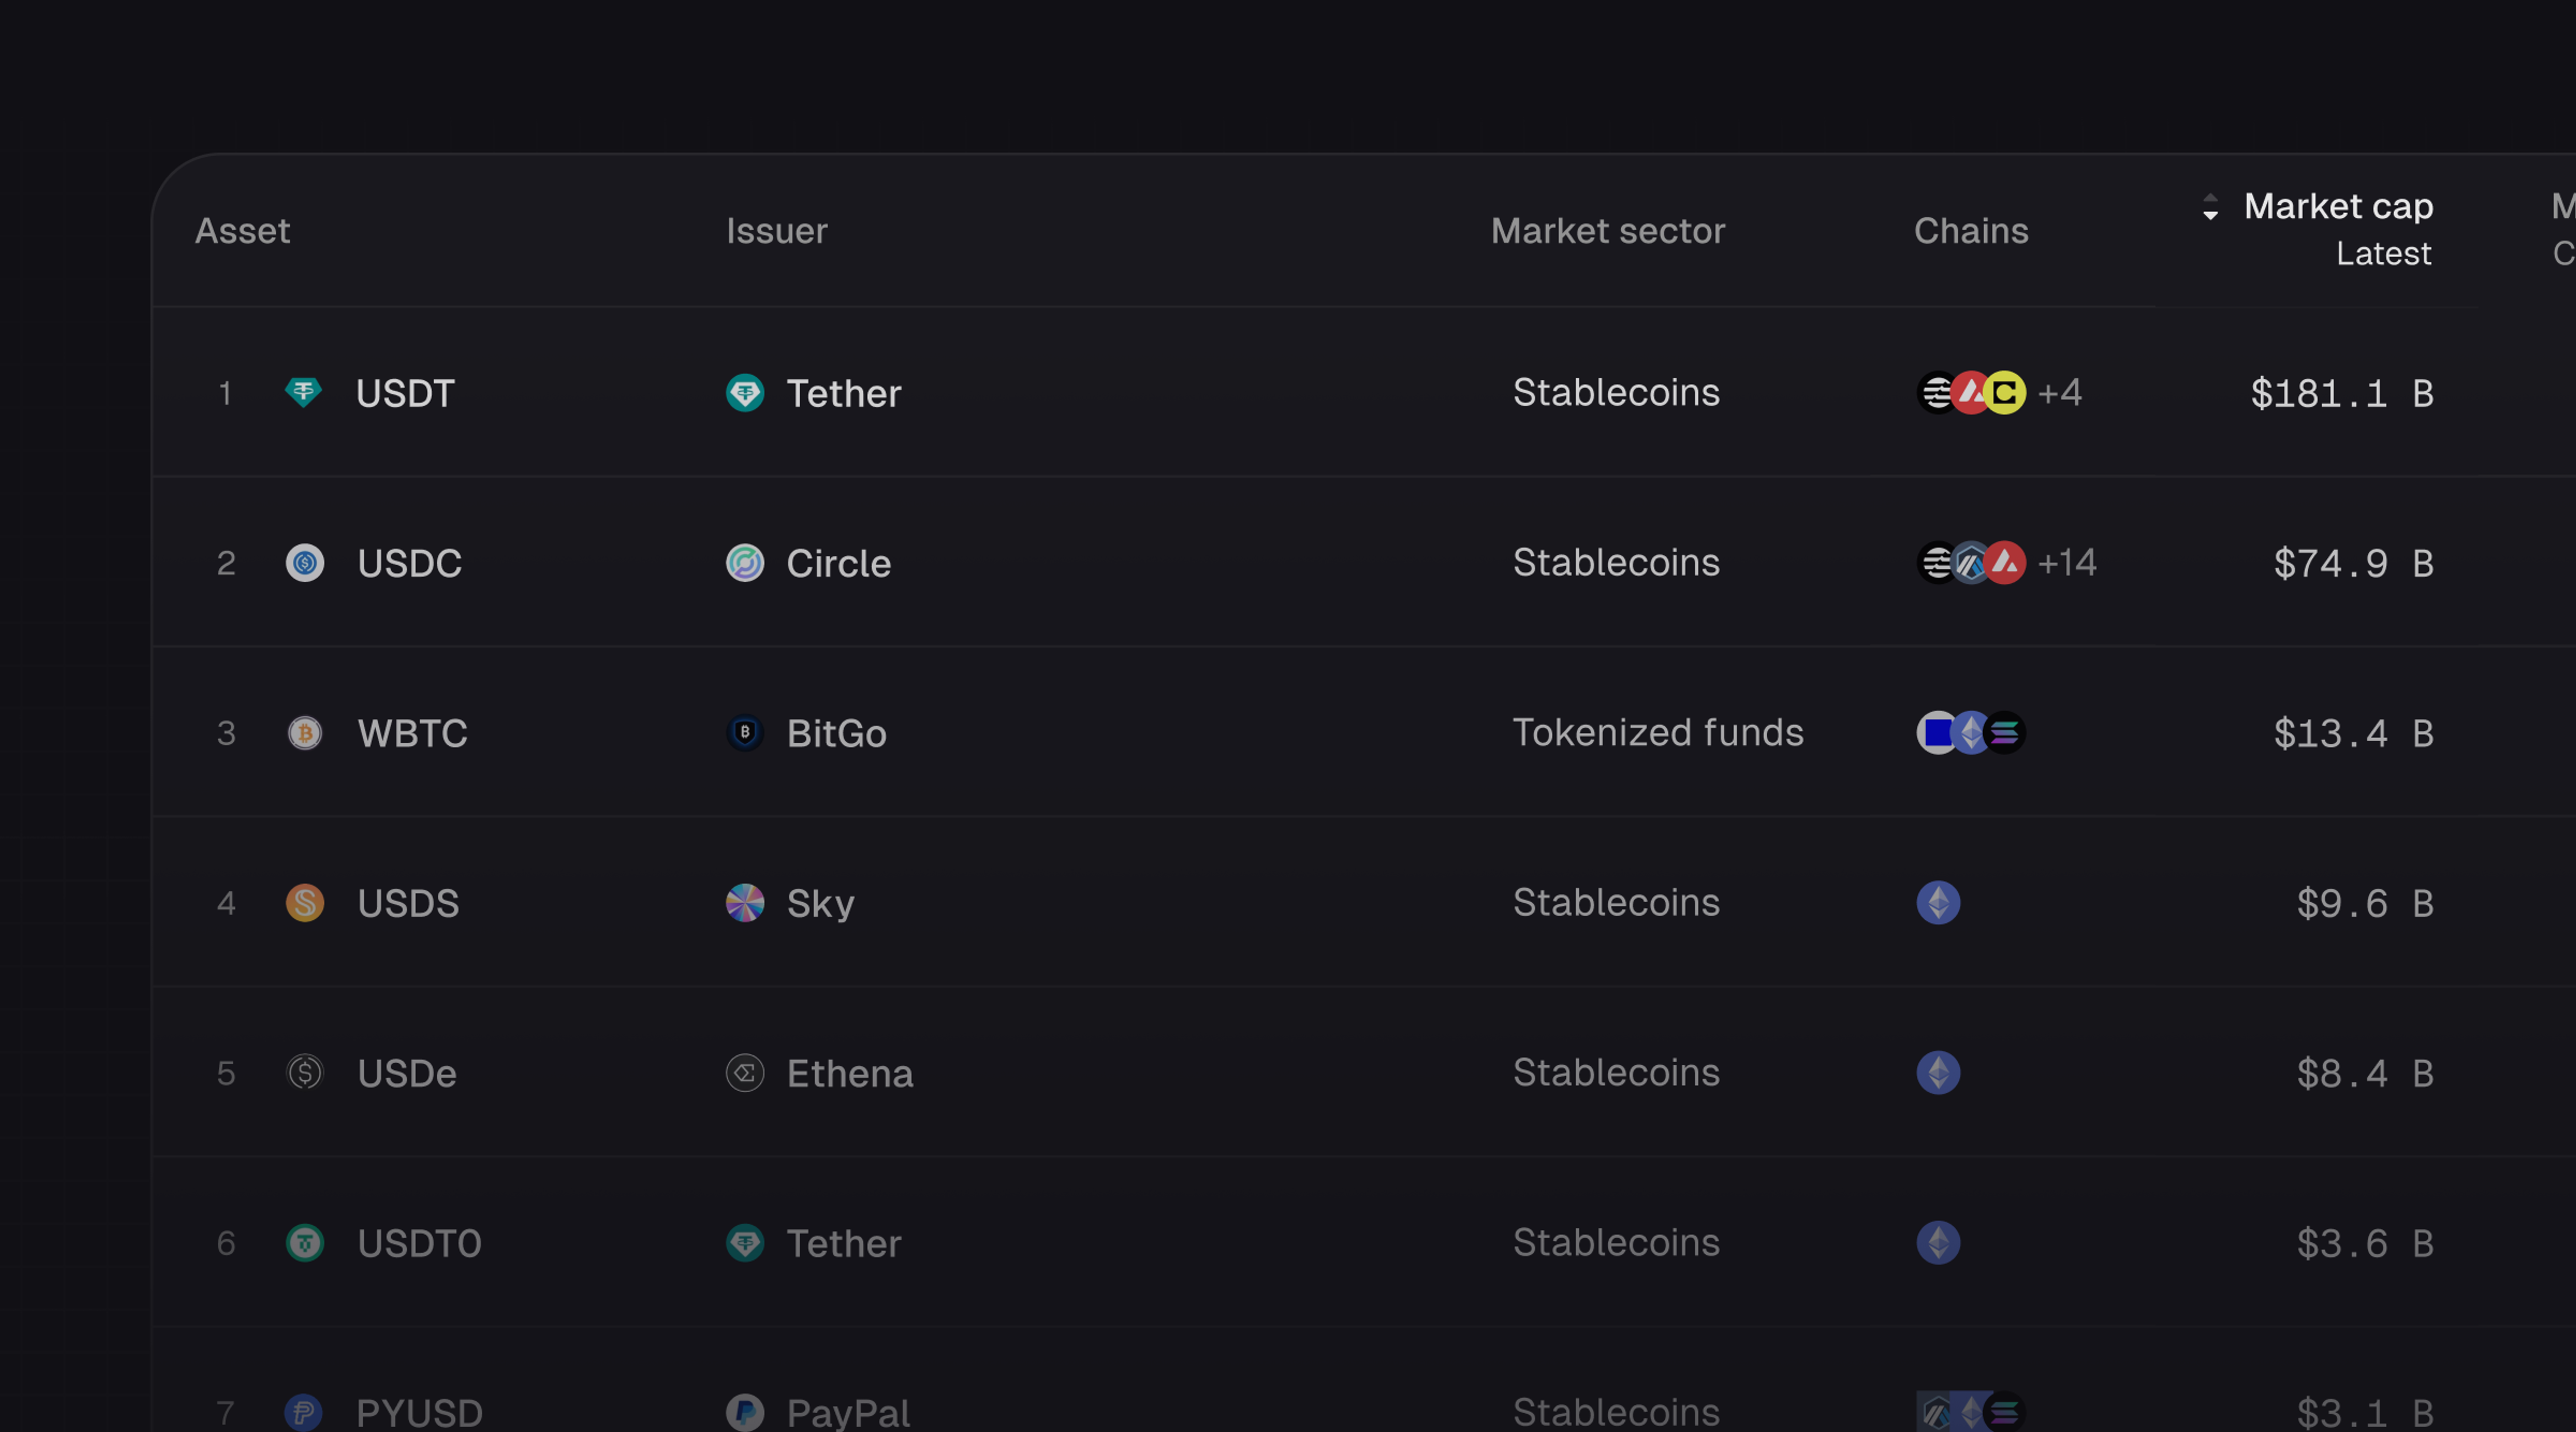
Introducing Tokenized Assets
Token Terminal is expanding its standardized onchain analytics to cover the rapidly growing category of tokenized real-world assets (RWAs) – starting with stablecoins, tokenized funds, and tokenized stocks.
Customer stories: Token Terminal’s Data Partnership with EigenCloud
Through its partnership with Token Terminal, EigenCloud turns transparency into a competitive advantage and continues to build trust with its growing community.