Newsletter
Uniswap’s Multichain Expansion Is Ethereum-Aligned
A weekly data digest for the leading crypto investors and operators.

Introduction
This week’s newsletter visualizes Uniswap’s growth and expansion from a single-chain to a multichain DEX. We go through Uniswap’s key financial and usage metrics, and break down the aggregate figures by chain. The chain-level datasets on Token Terminal offer valuable depth to the analysis of individual projects.
Let’s dive in!
1. Net deposits
Net deposits represents the value of assets that Liquidity Providers (LPs) have deposited into Uniswap’s liquidity pools. It is against these assets that Traders on the DEX make their trades. As a rule of thumb, the more liquidity there is, the better the trading experience.
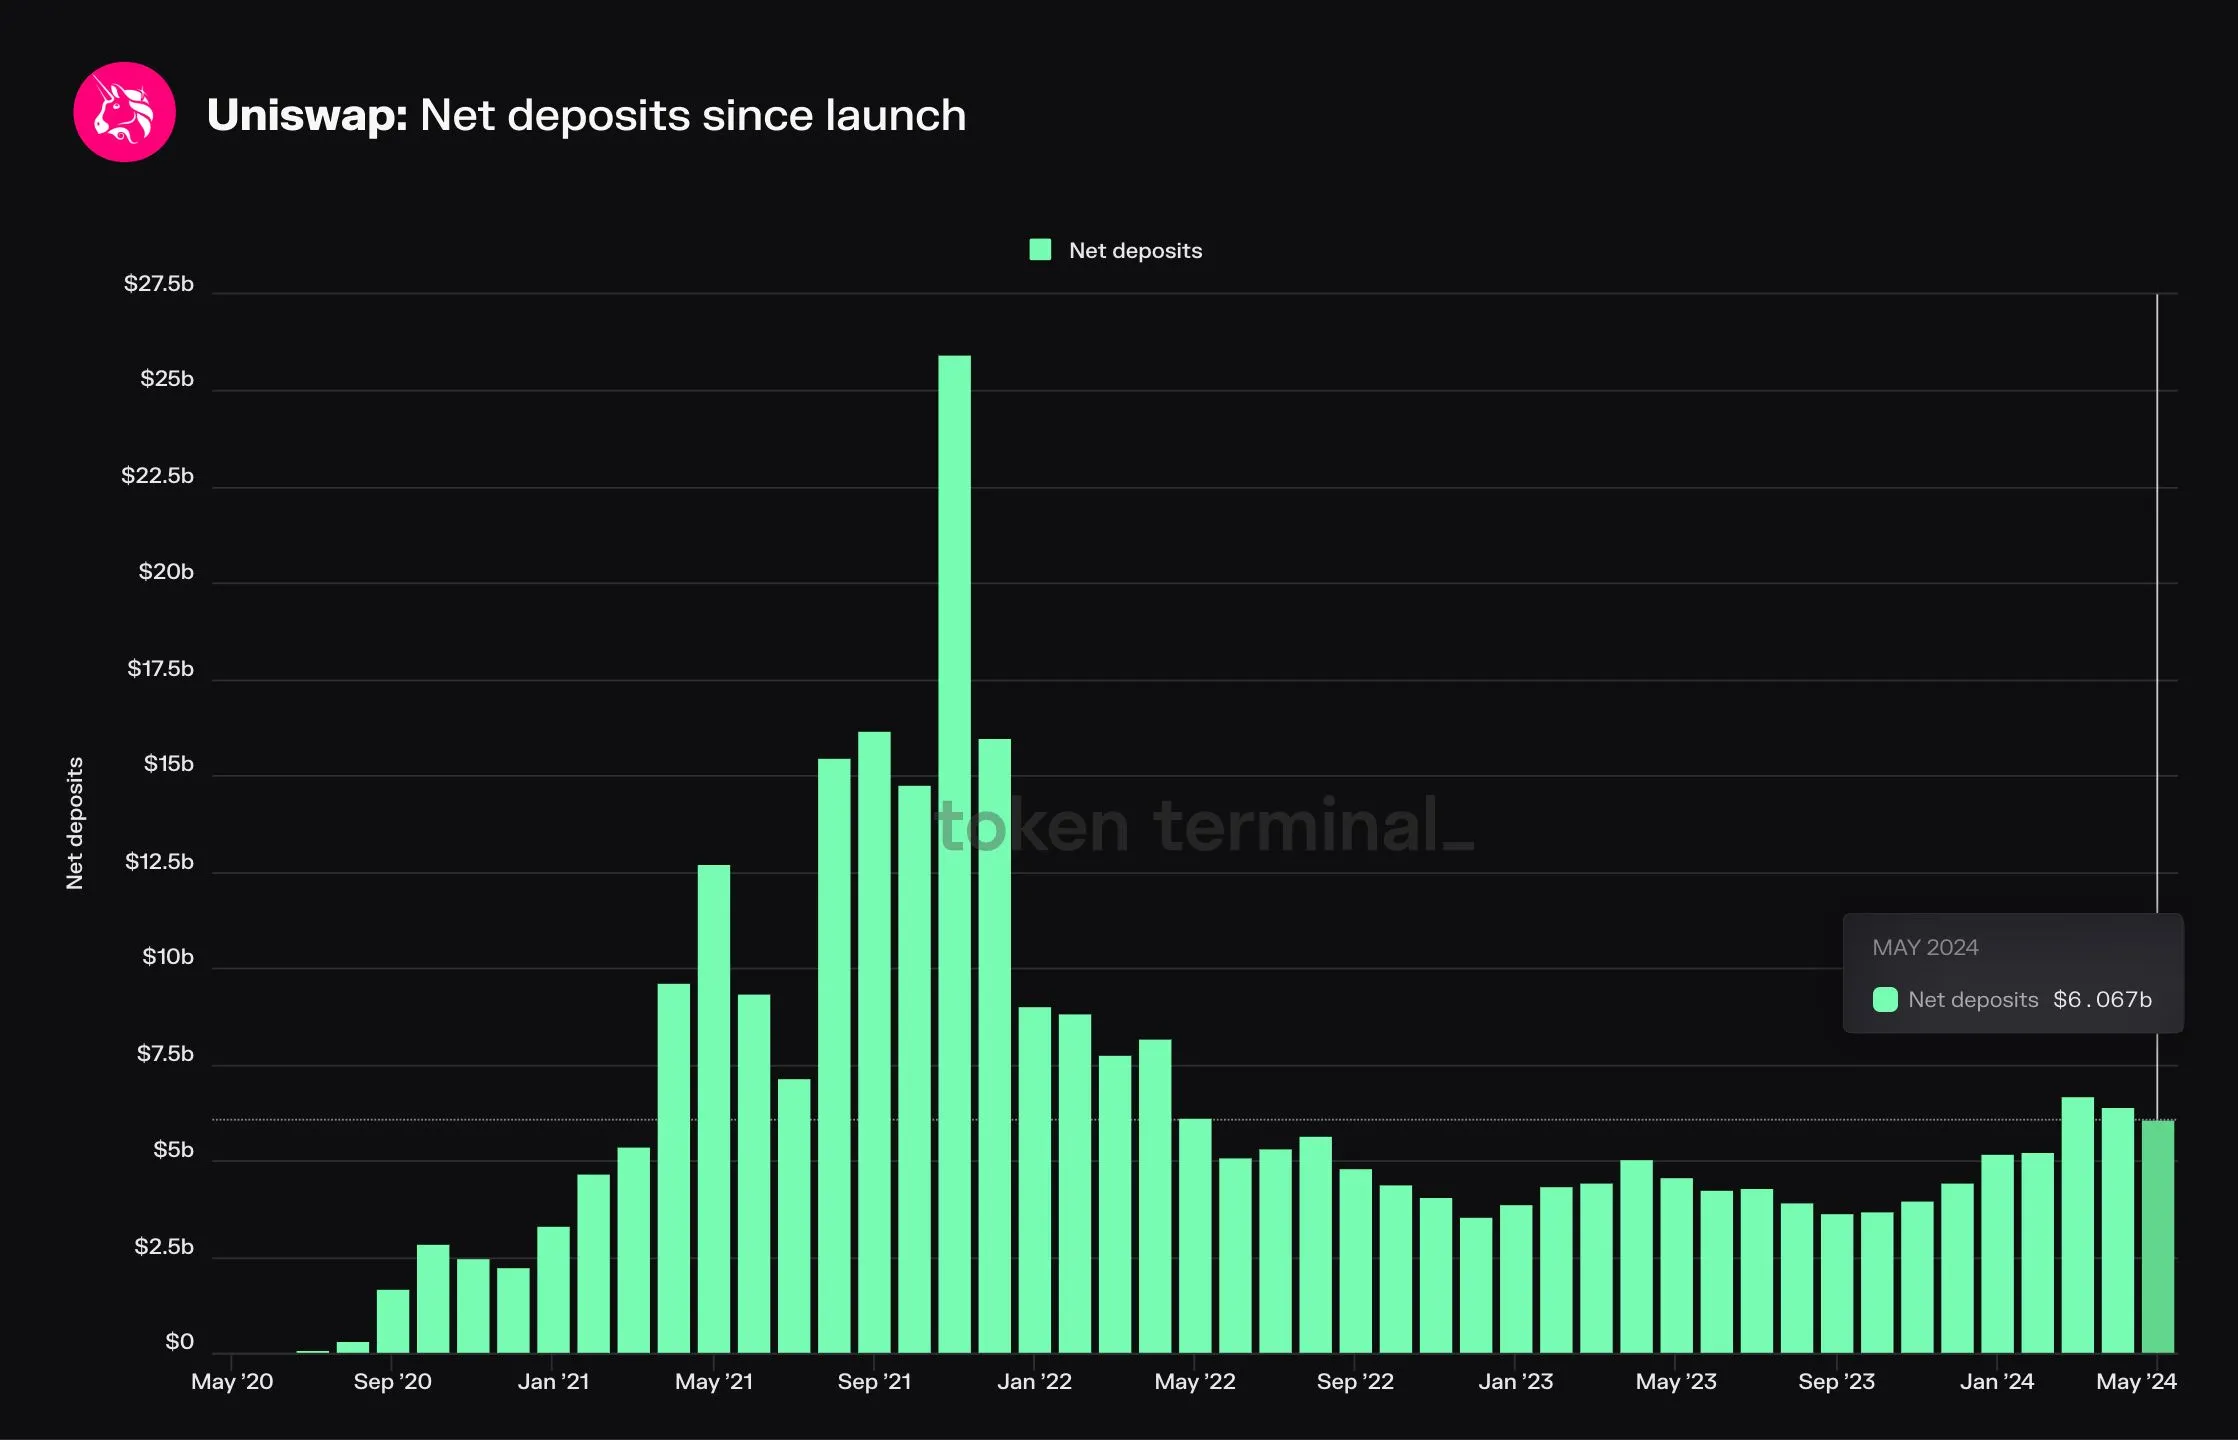 Monthly average Net deposits on Uniswap (aggregate).
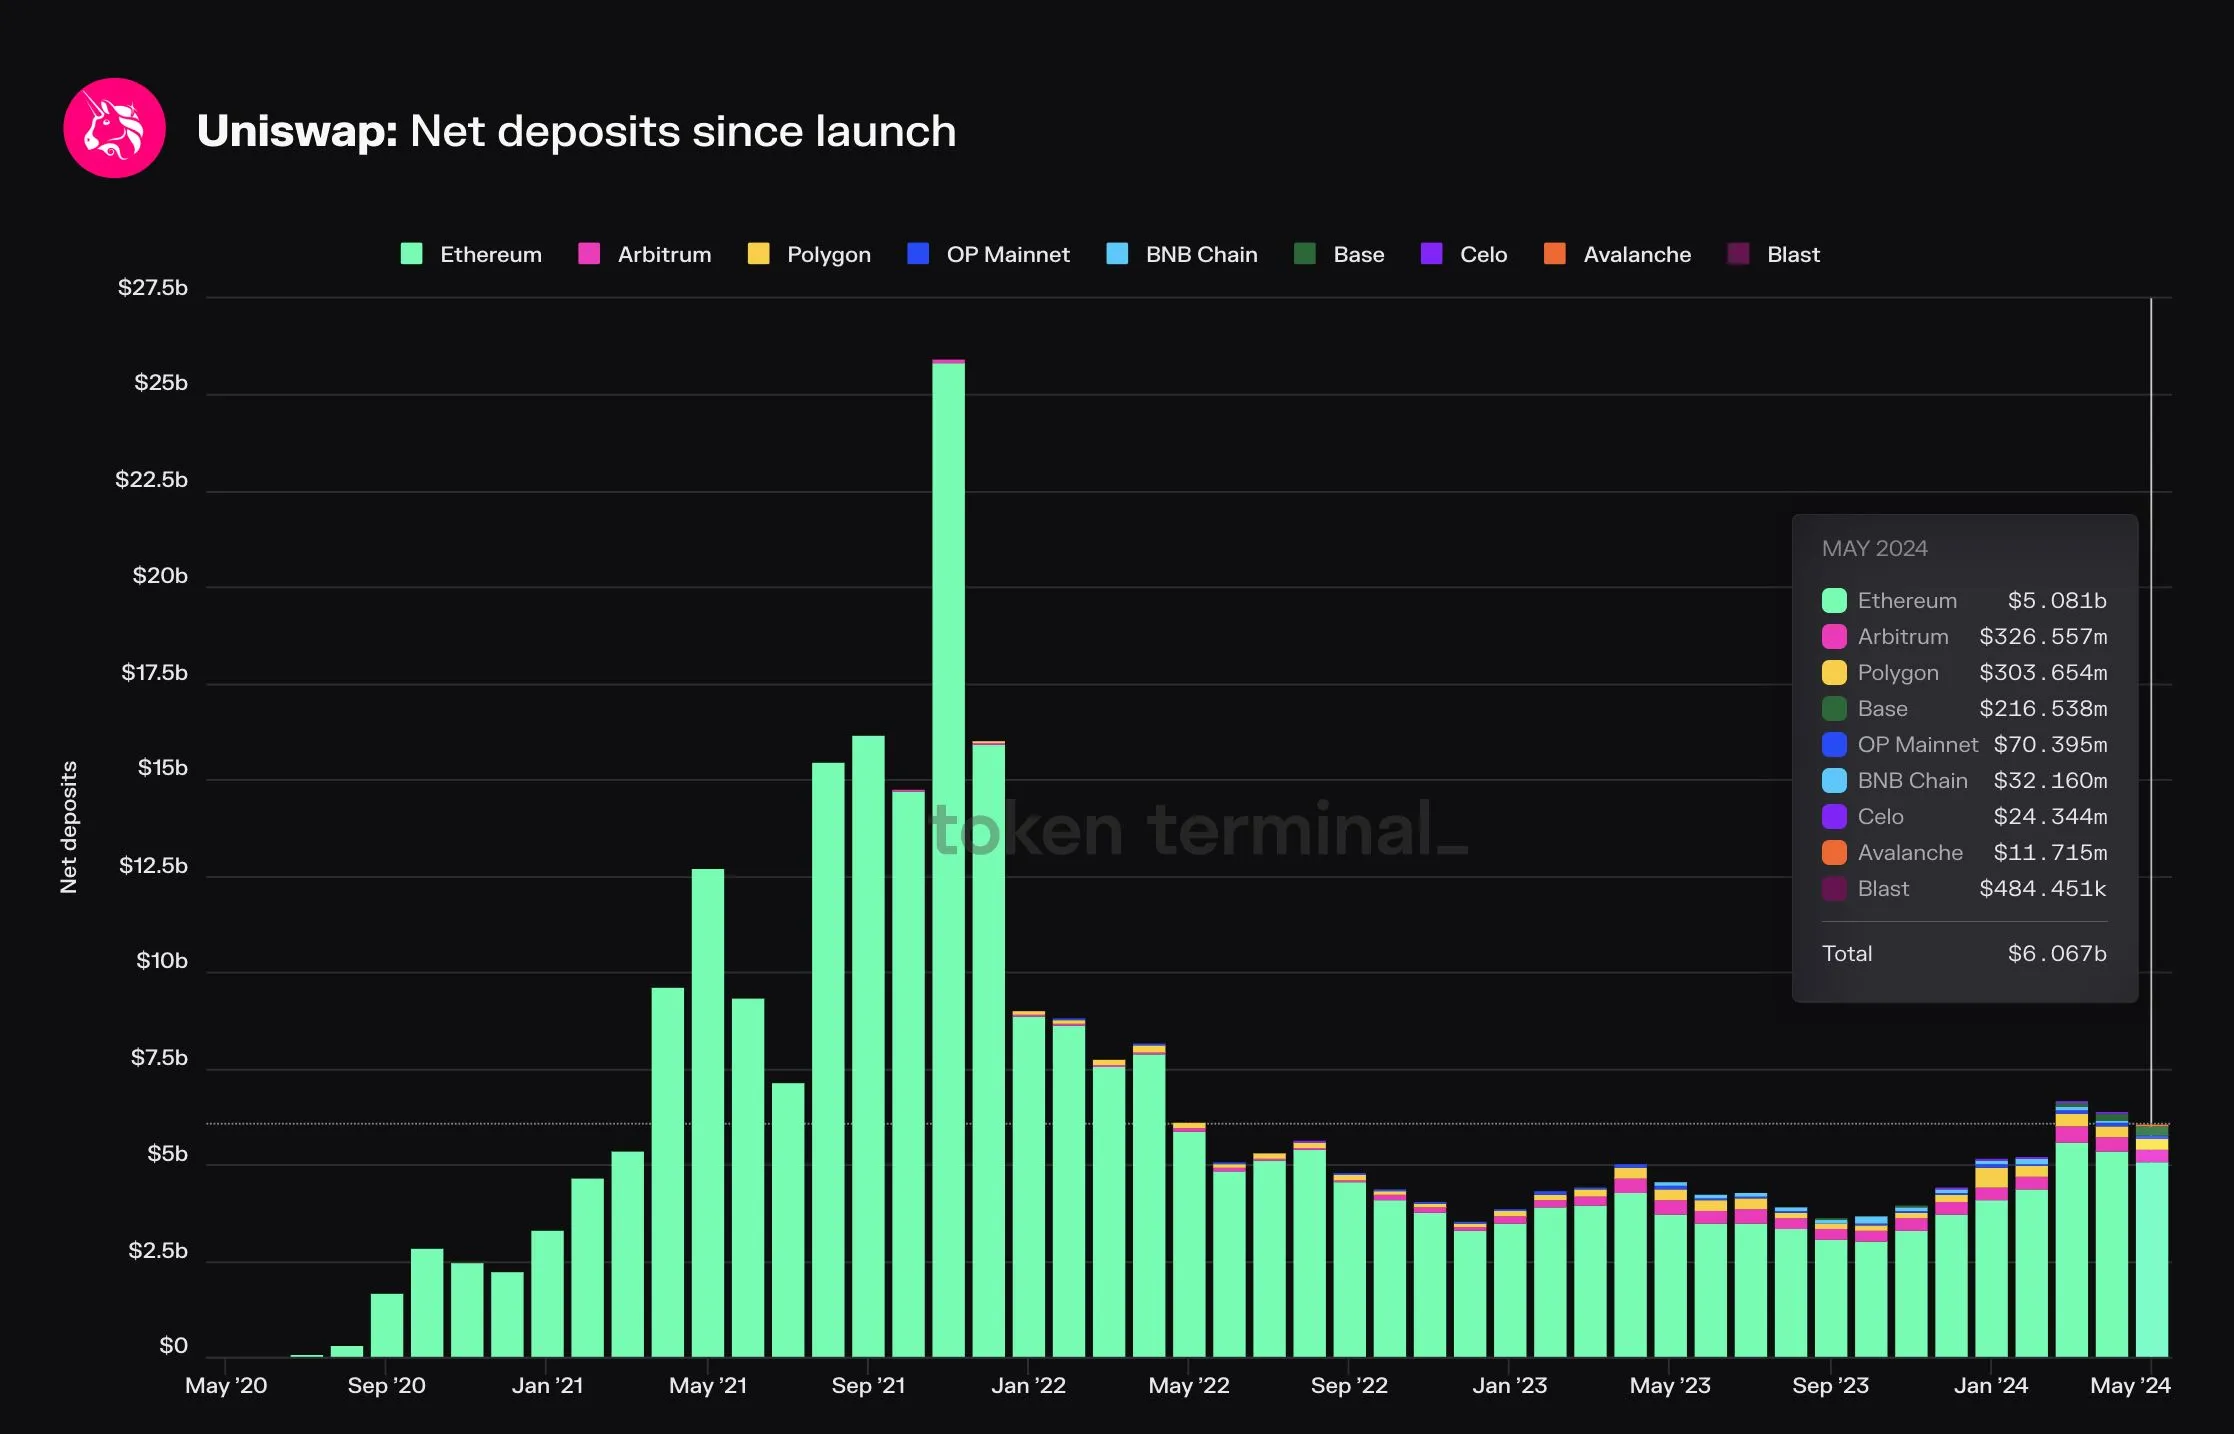 Monthly average Net deposits on Uniswap (by chain).
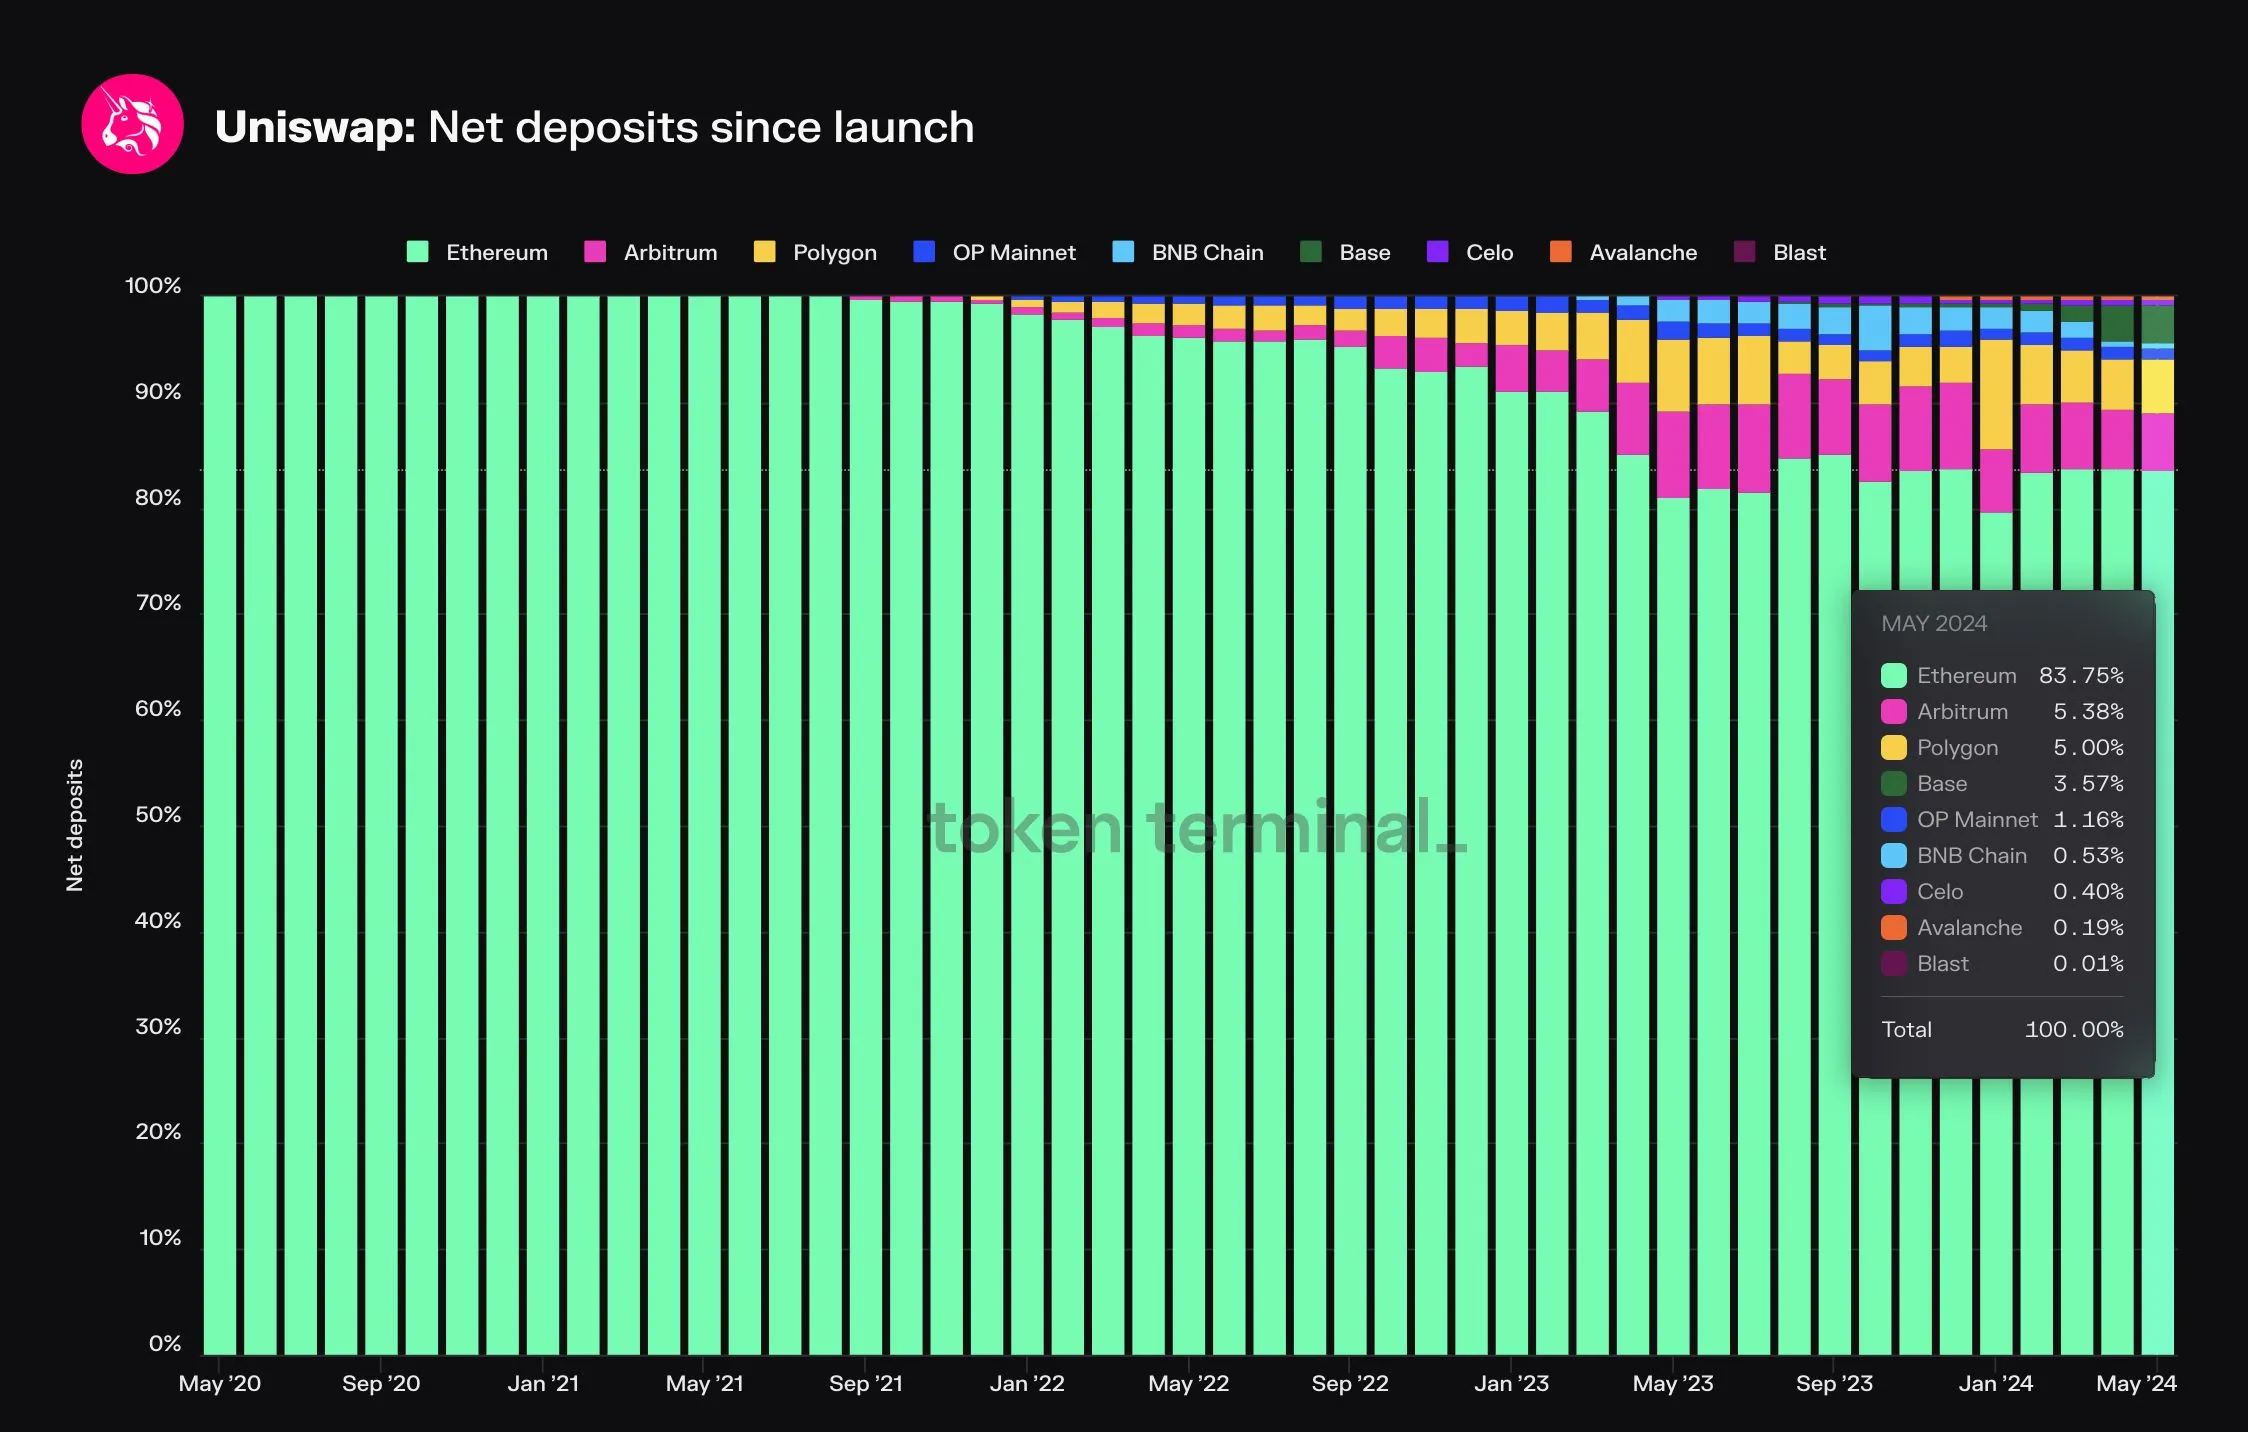 Monthly average Net deposits on Uniswap (by chain, market share view).
A vast majority of the liquidity resides on the Ethereum Mainnet
- Even if Uniswap is deployed to 9 different EVM chains, 84% of the liquidity is still available only on the Ethereum Mainnet.
- Arbitrum, Polygon, and Base are the top 3 L2s in terms of Net deposits.
- 4/9 chains represent ~1% of total Net deposits, with 3 of them being alternative layer 1 chains (BNB Chain, Celo, and Avalanche.).
2. Trading volume
Trading volume represents the value of assets traded through Uniswap’s liquidity pools within the relevant time period. By comparing the Trading volume against the Net deposits, investors can get a sense of the capital efficiency of the DEX. Ideally, the DEX is able to facilitate a high Trading volume with a relatively low Net deposit base.
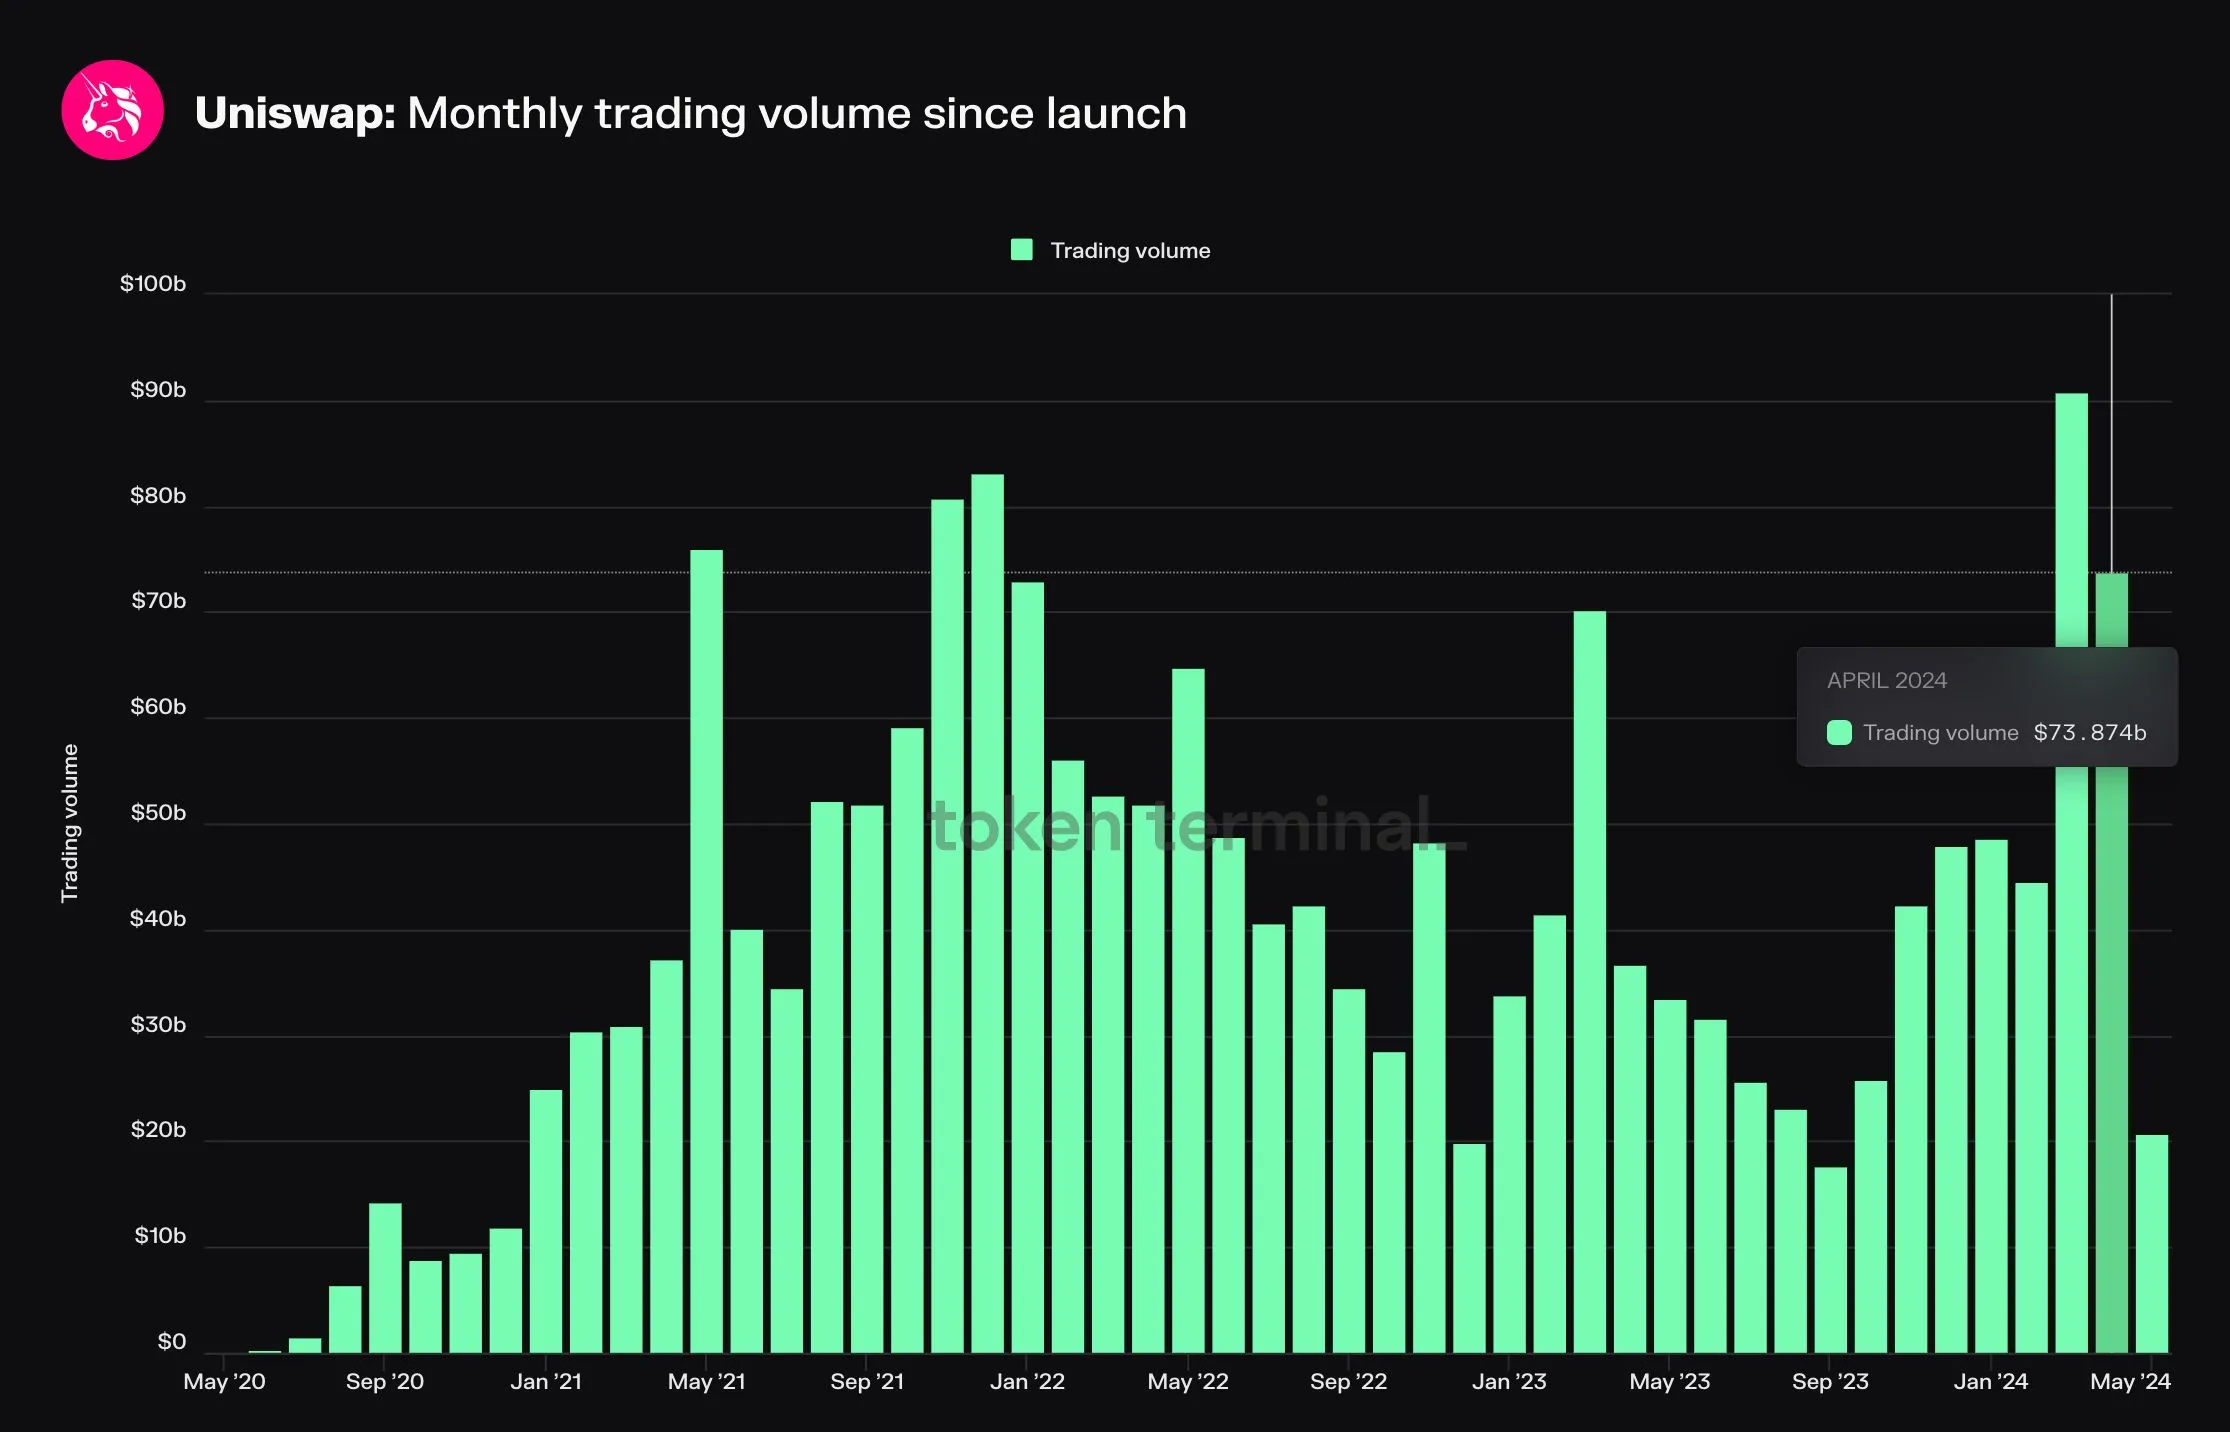 Monthly Trading volume on Uniswap (aggregate).
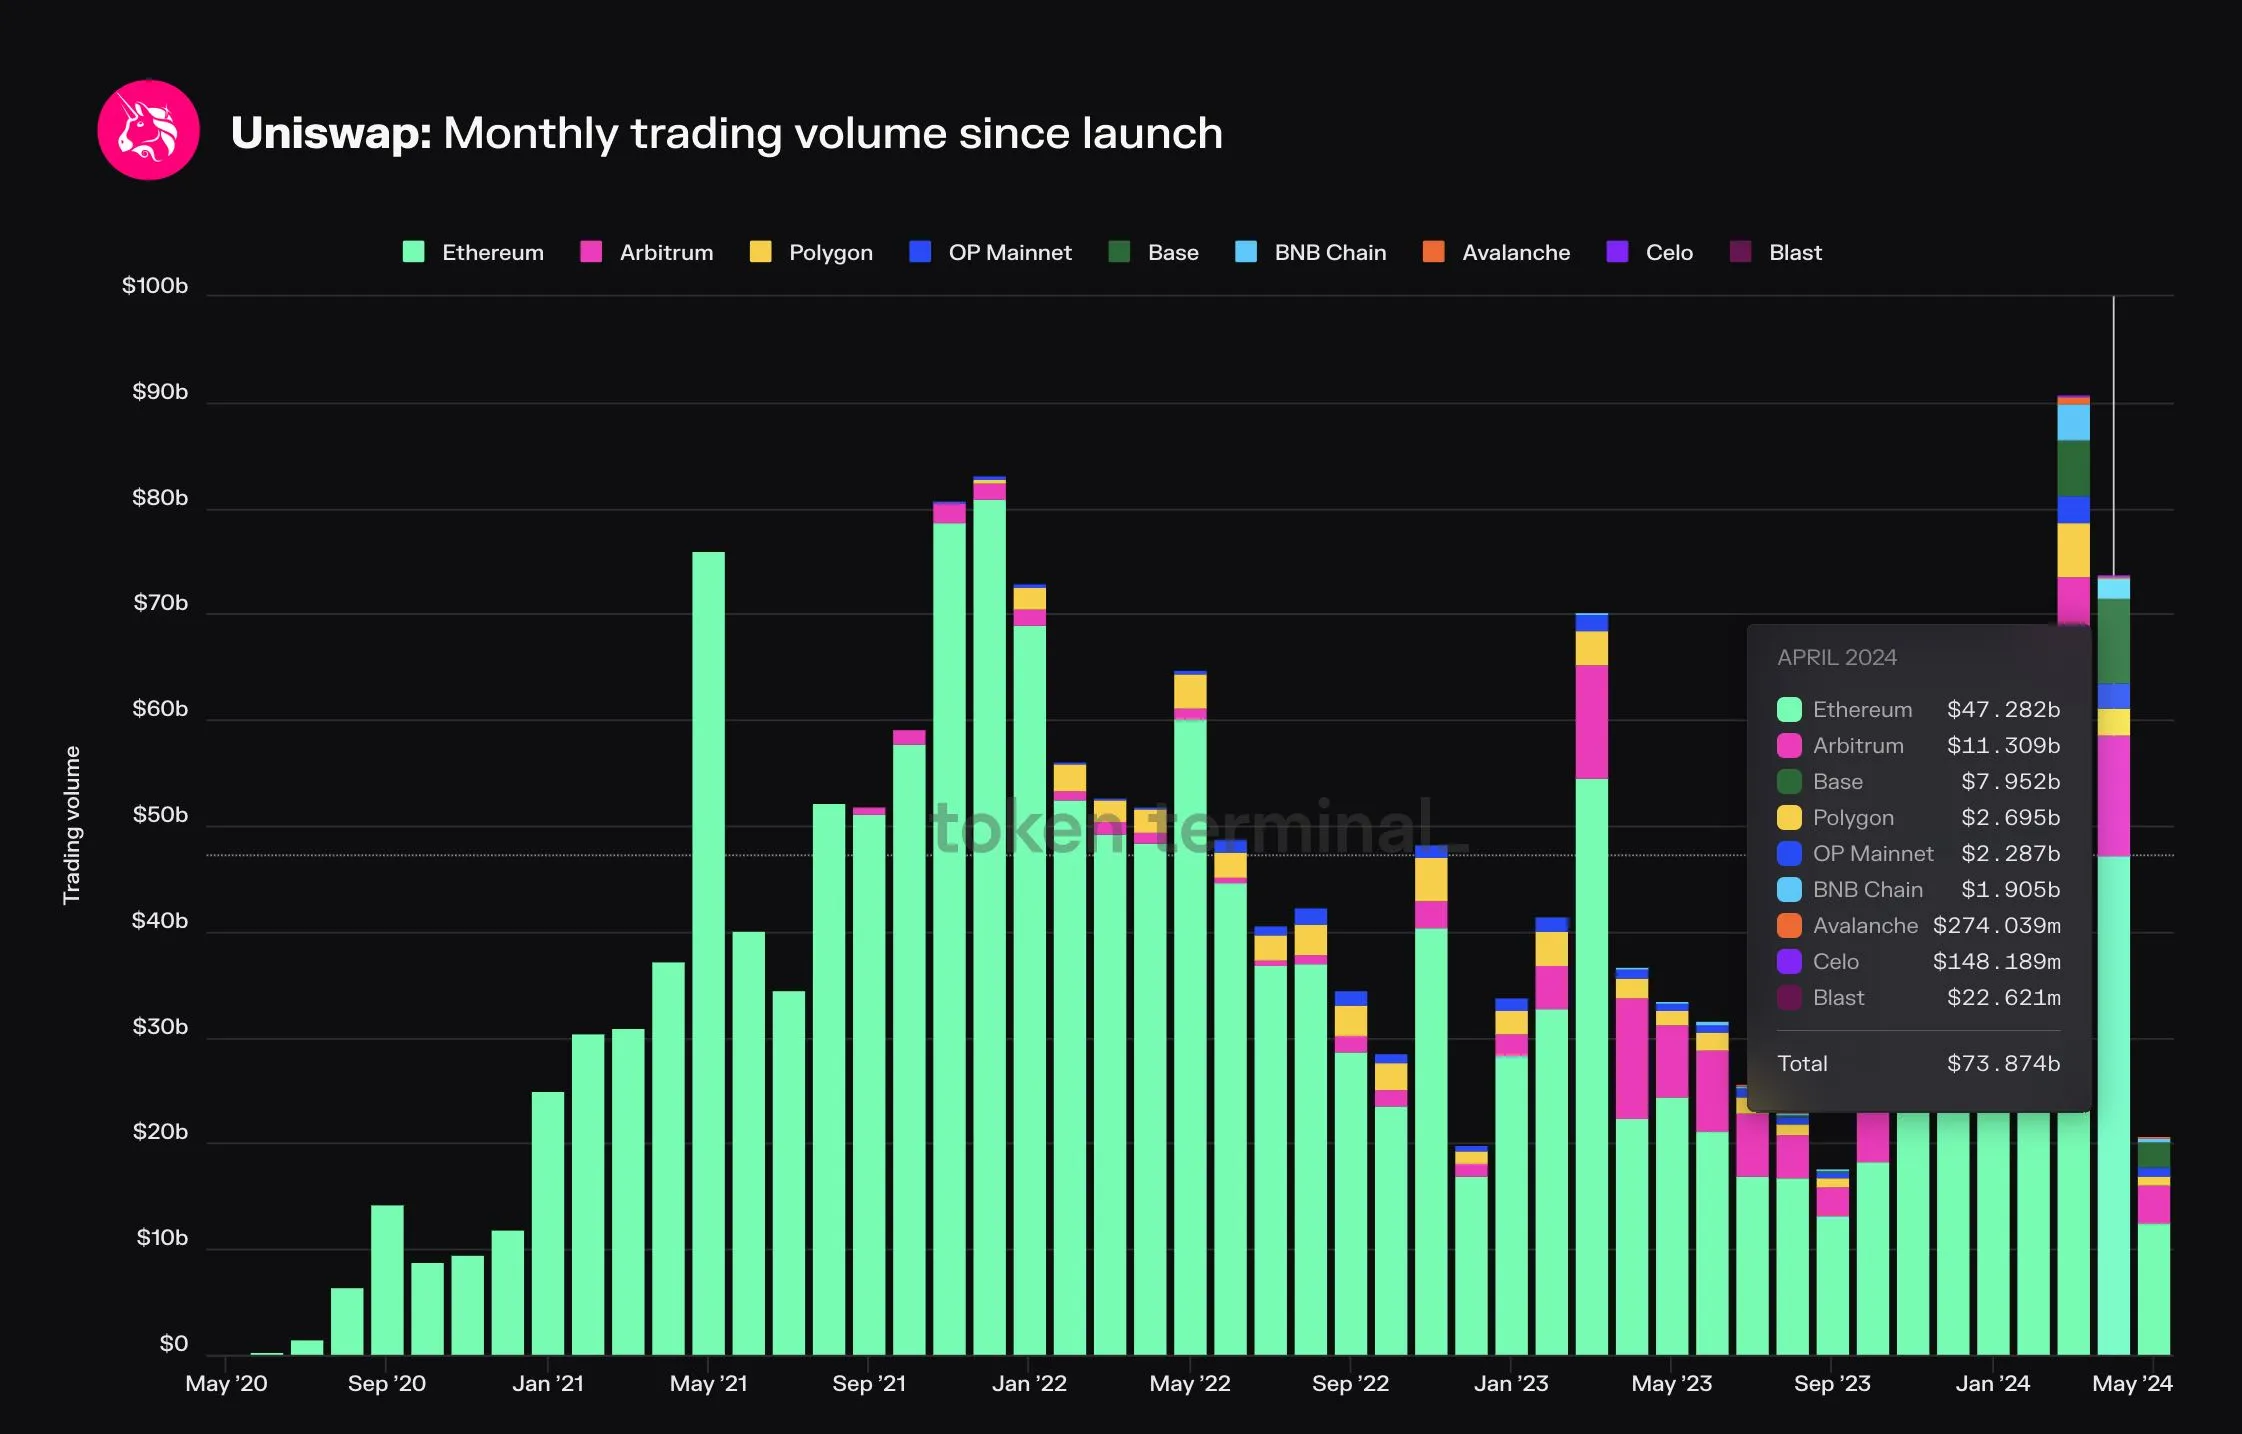 Monthly Trading volume on Uniswap (by chain).
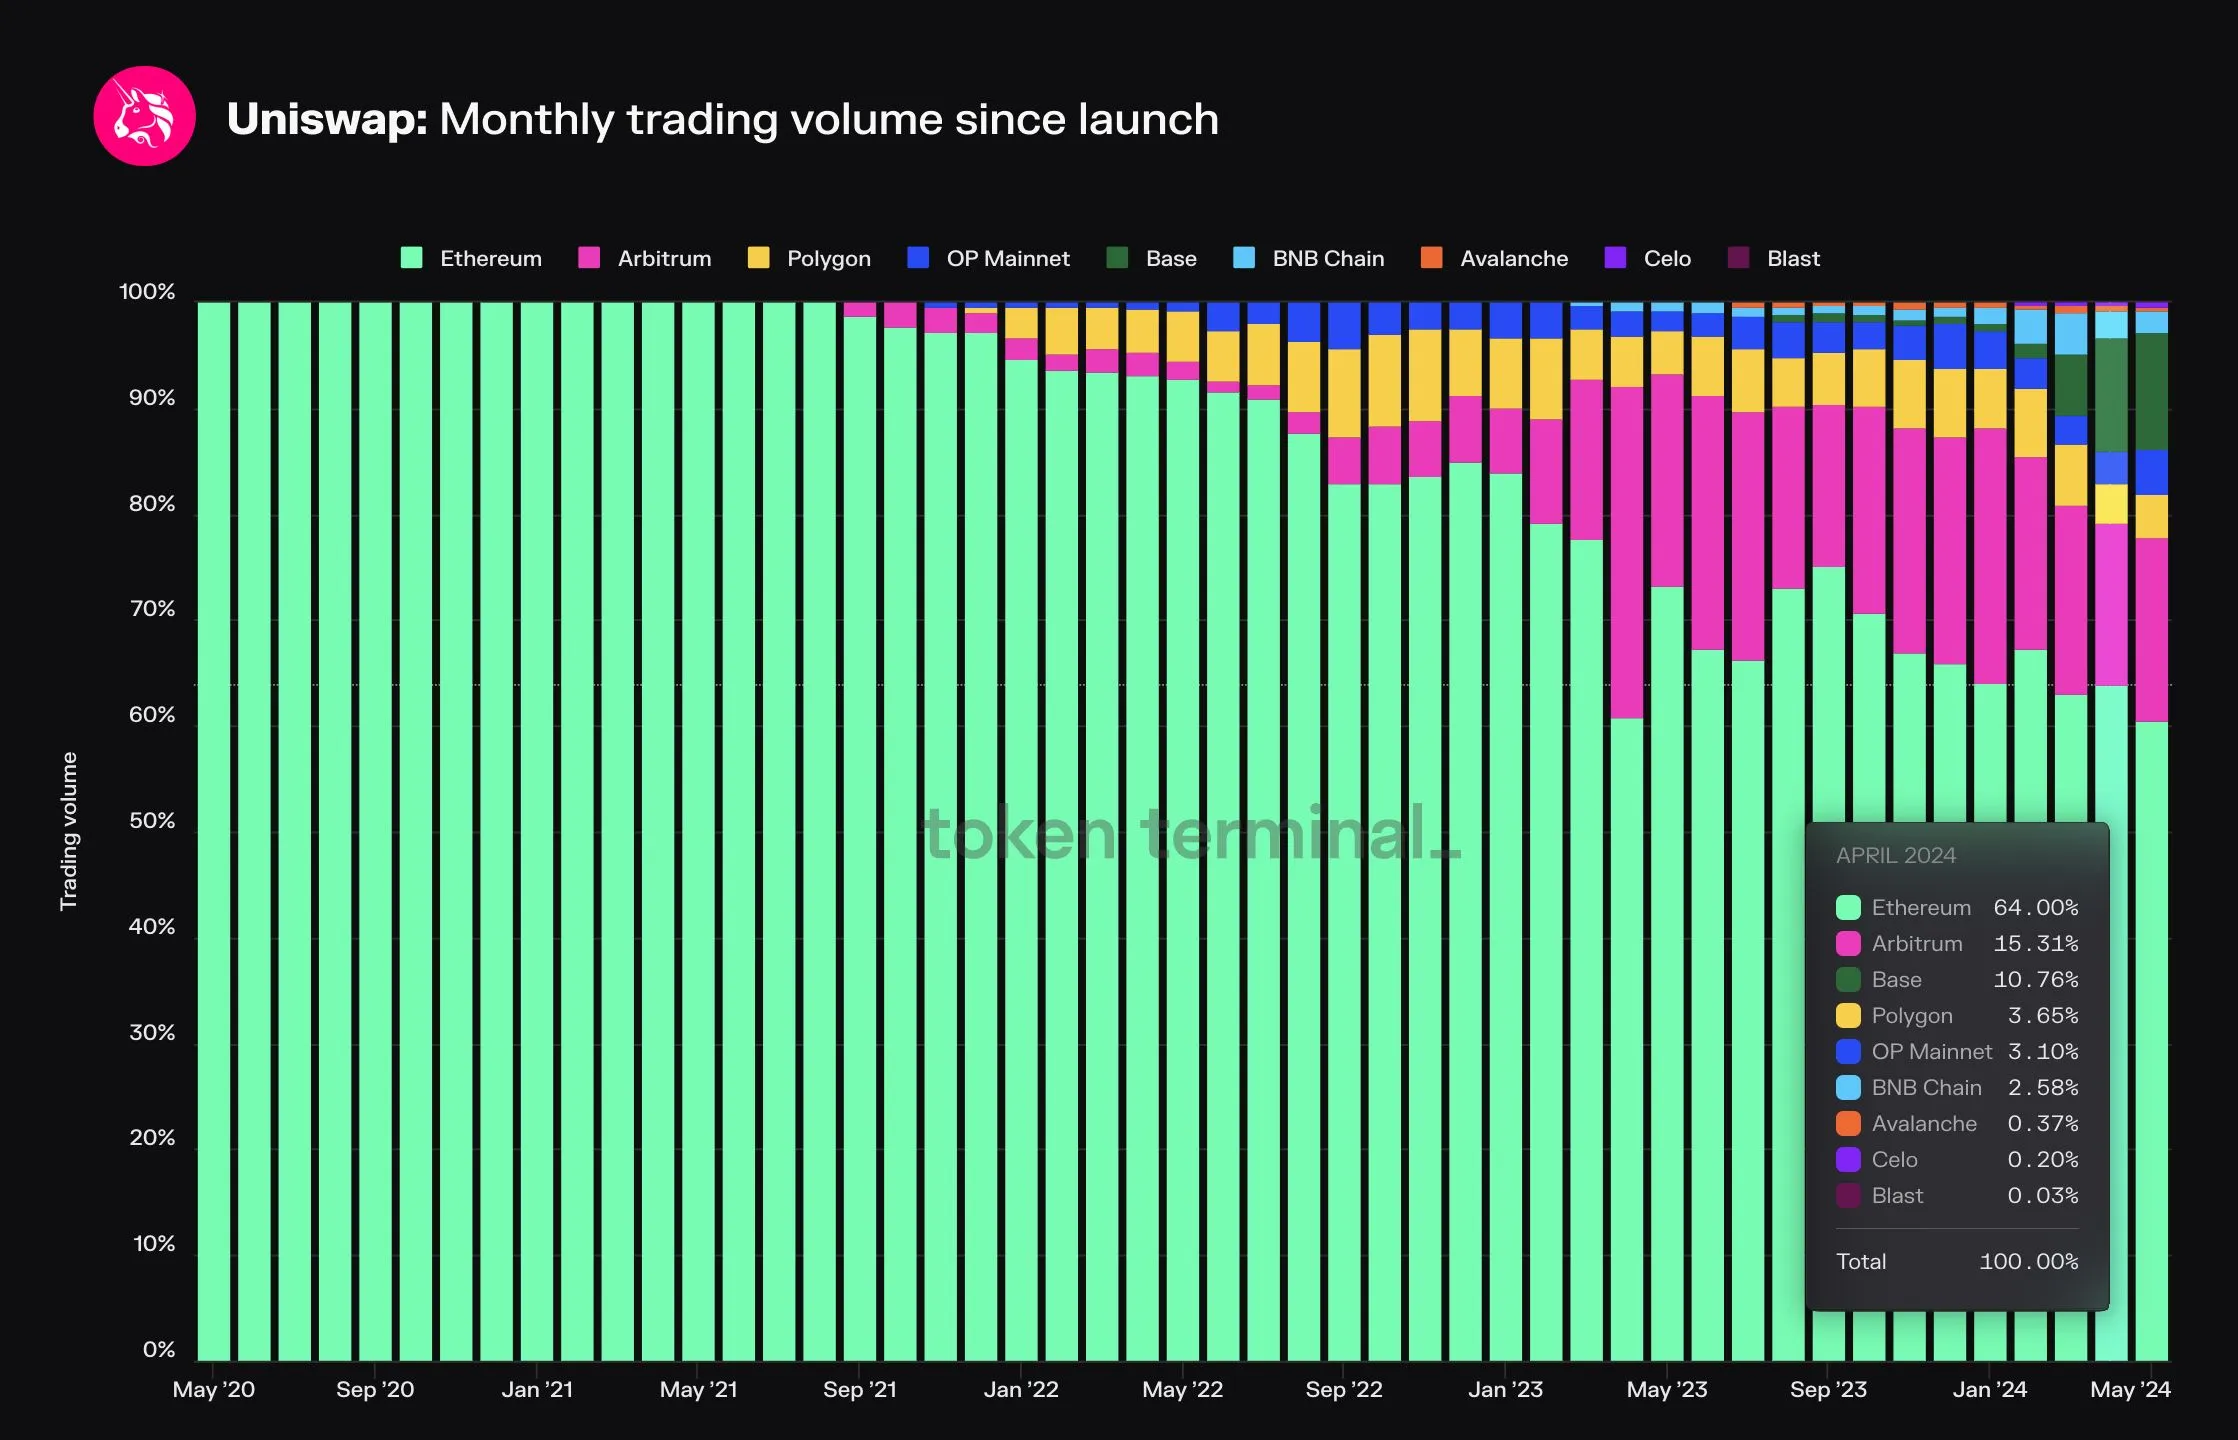 Monthly Trading volume on Uniswap (by chain, market share view).
Arbitrum and Base are the fastest growing trading venues for Uniswap
- Over 50% of the Trading volume comes from Ethereum Mainnet.
- Arbitrum and Base are the fastest growing trading venues for Uniswap, making up ~25% of the total Trading volume on Uniswap.
- 3/9 chains represent under 1% of total Trading volume.
3. Fees
Fees represents the trading fees paid by Traders to Liquidity Providers (LPs) for each trade on Uniswap. The Fees are paid in addition to the gas fee (transaction fee) on respective chain. Ideally, the DEX allows the LPs to earn enough in Fees, while retaining the Traders by not charging them too much.
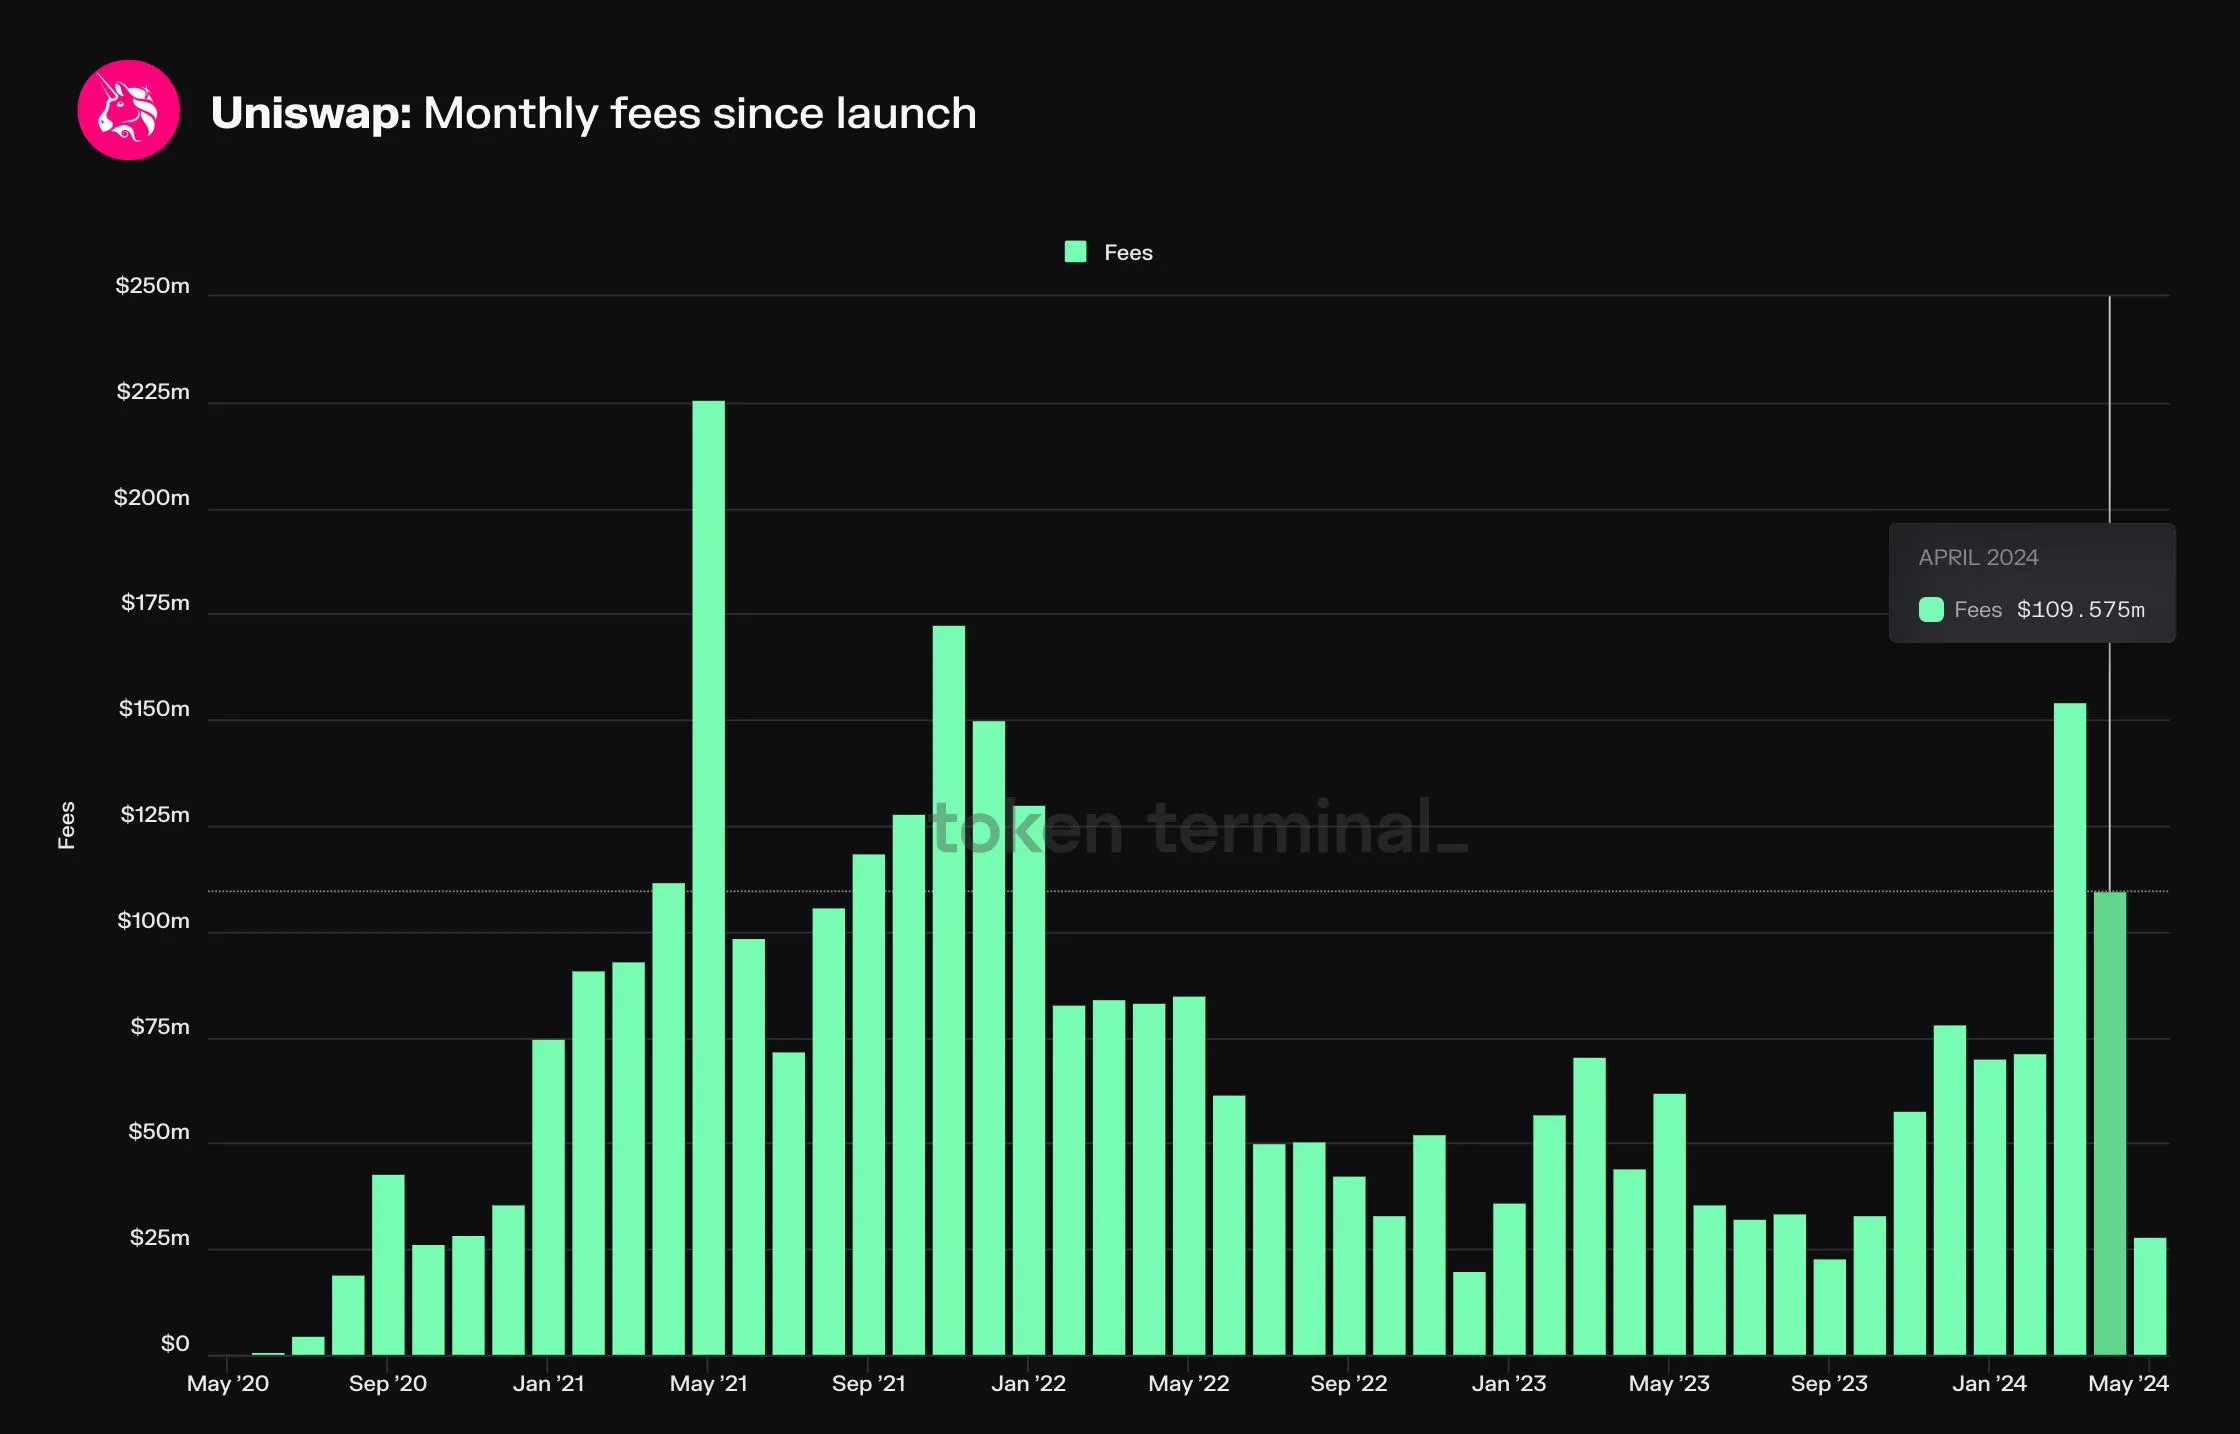 Monthly Fees on Uniswap (aggregate).
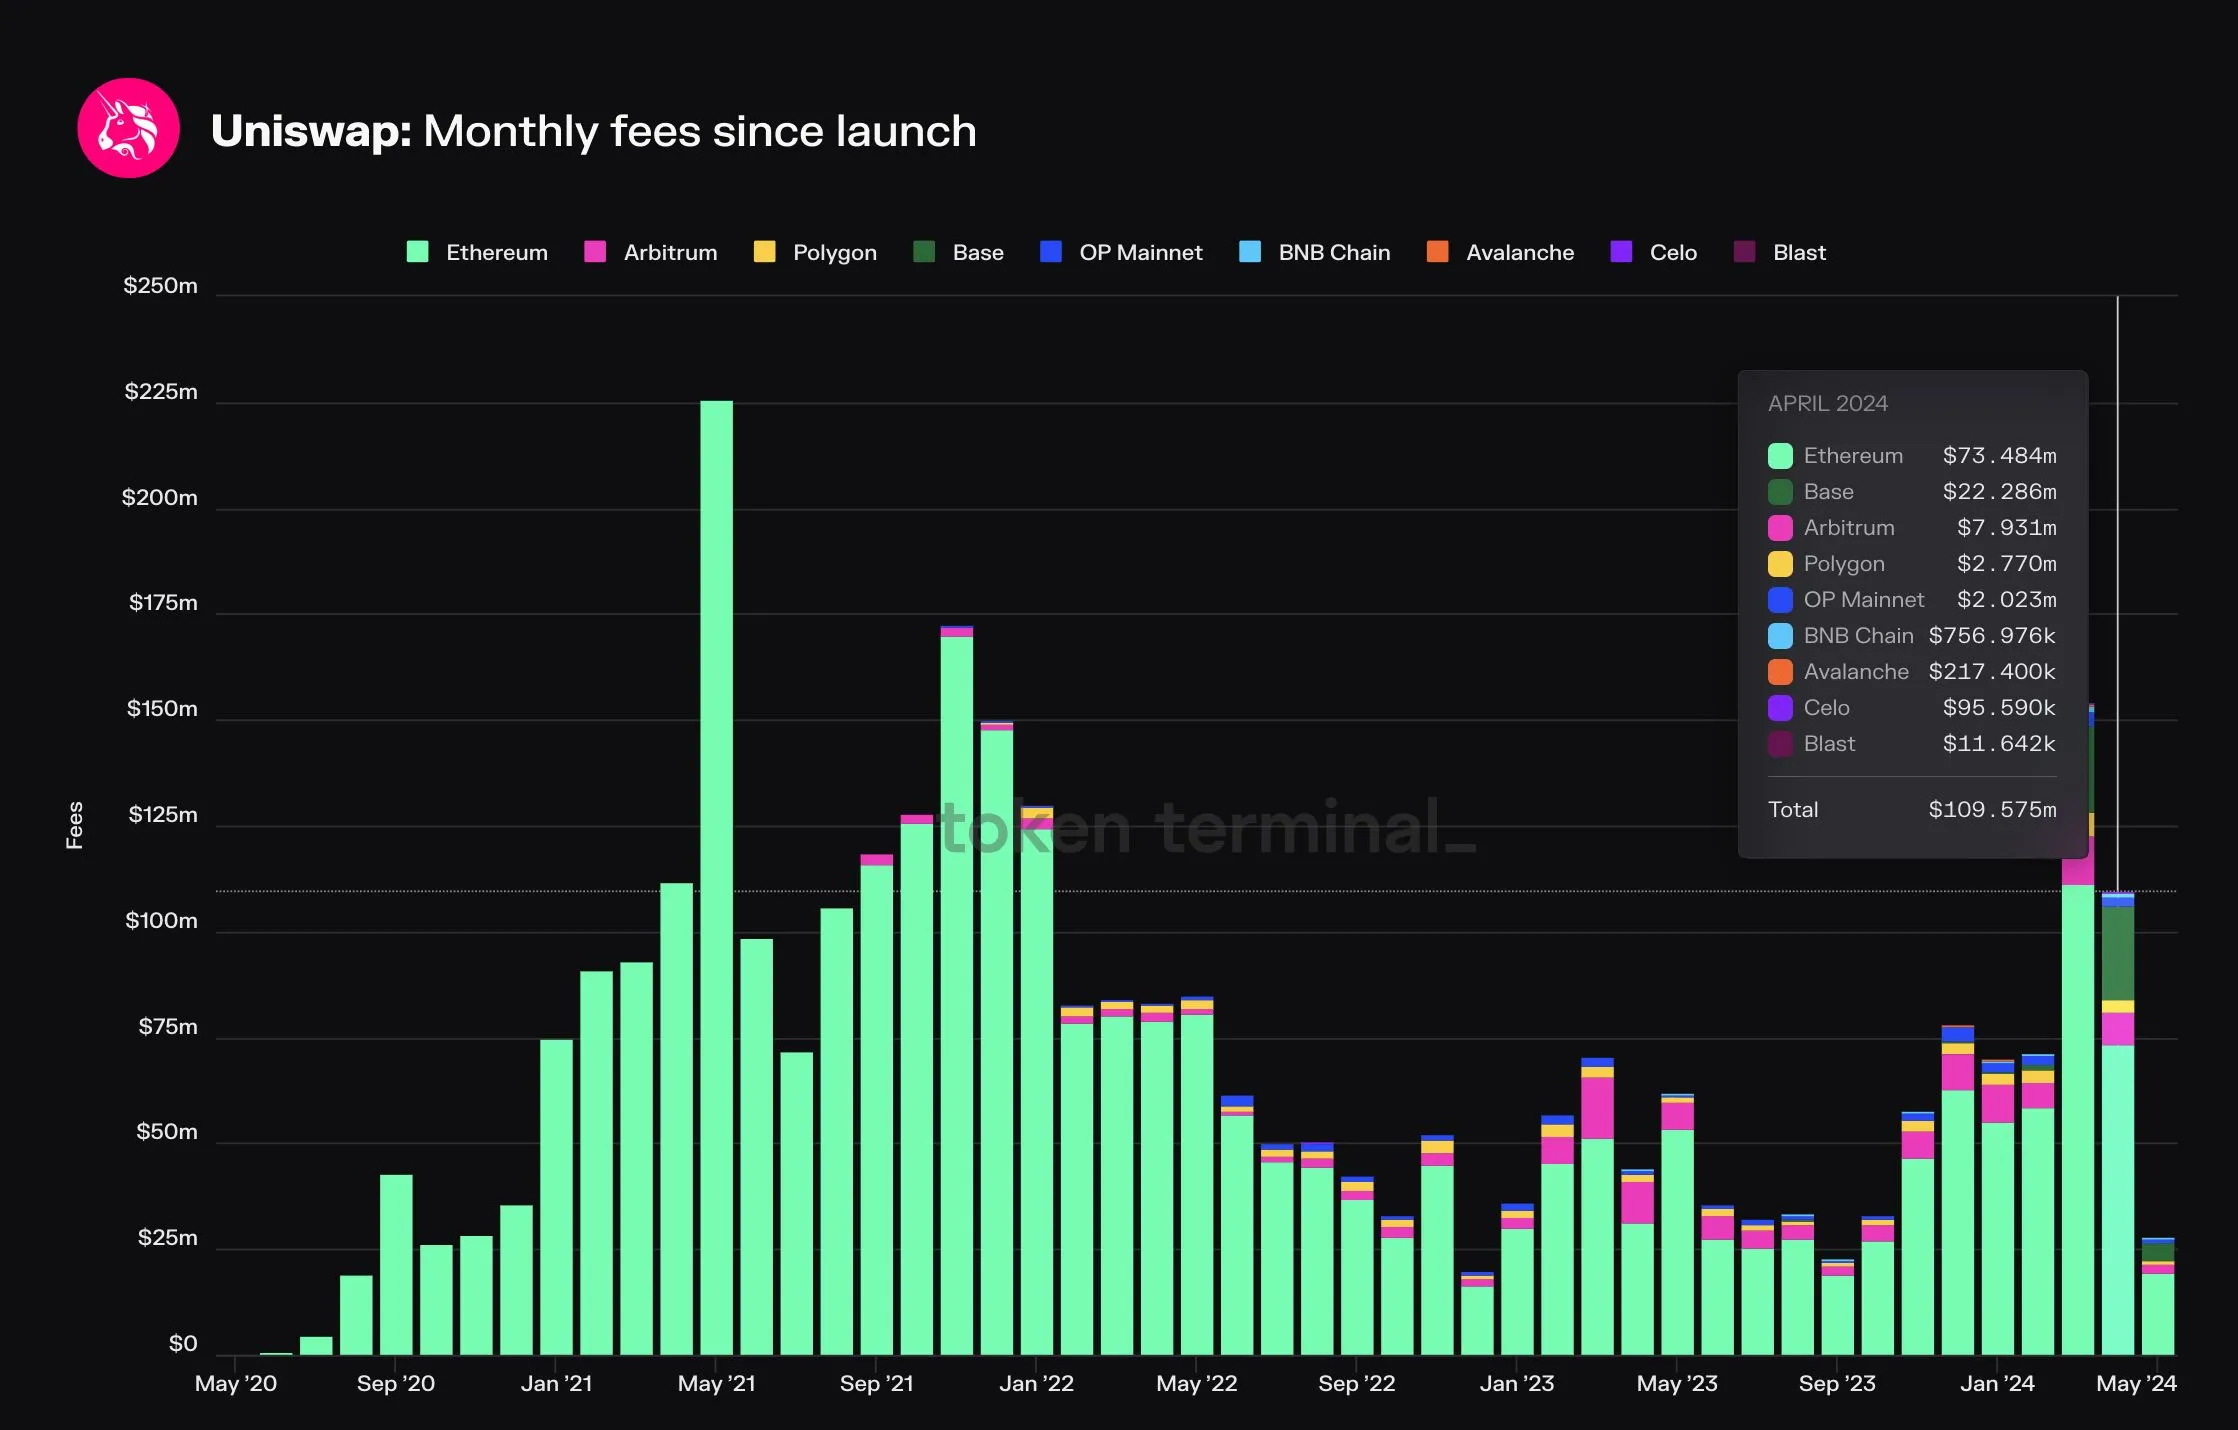 Monthly Fees on Uniswap (by chain).
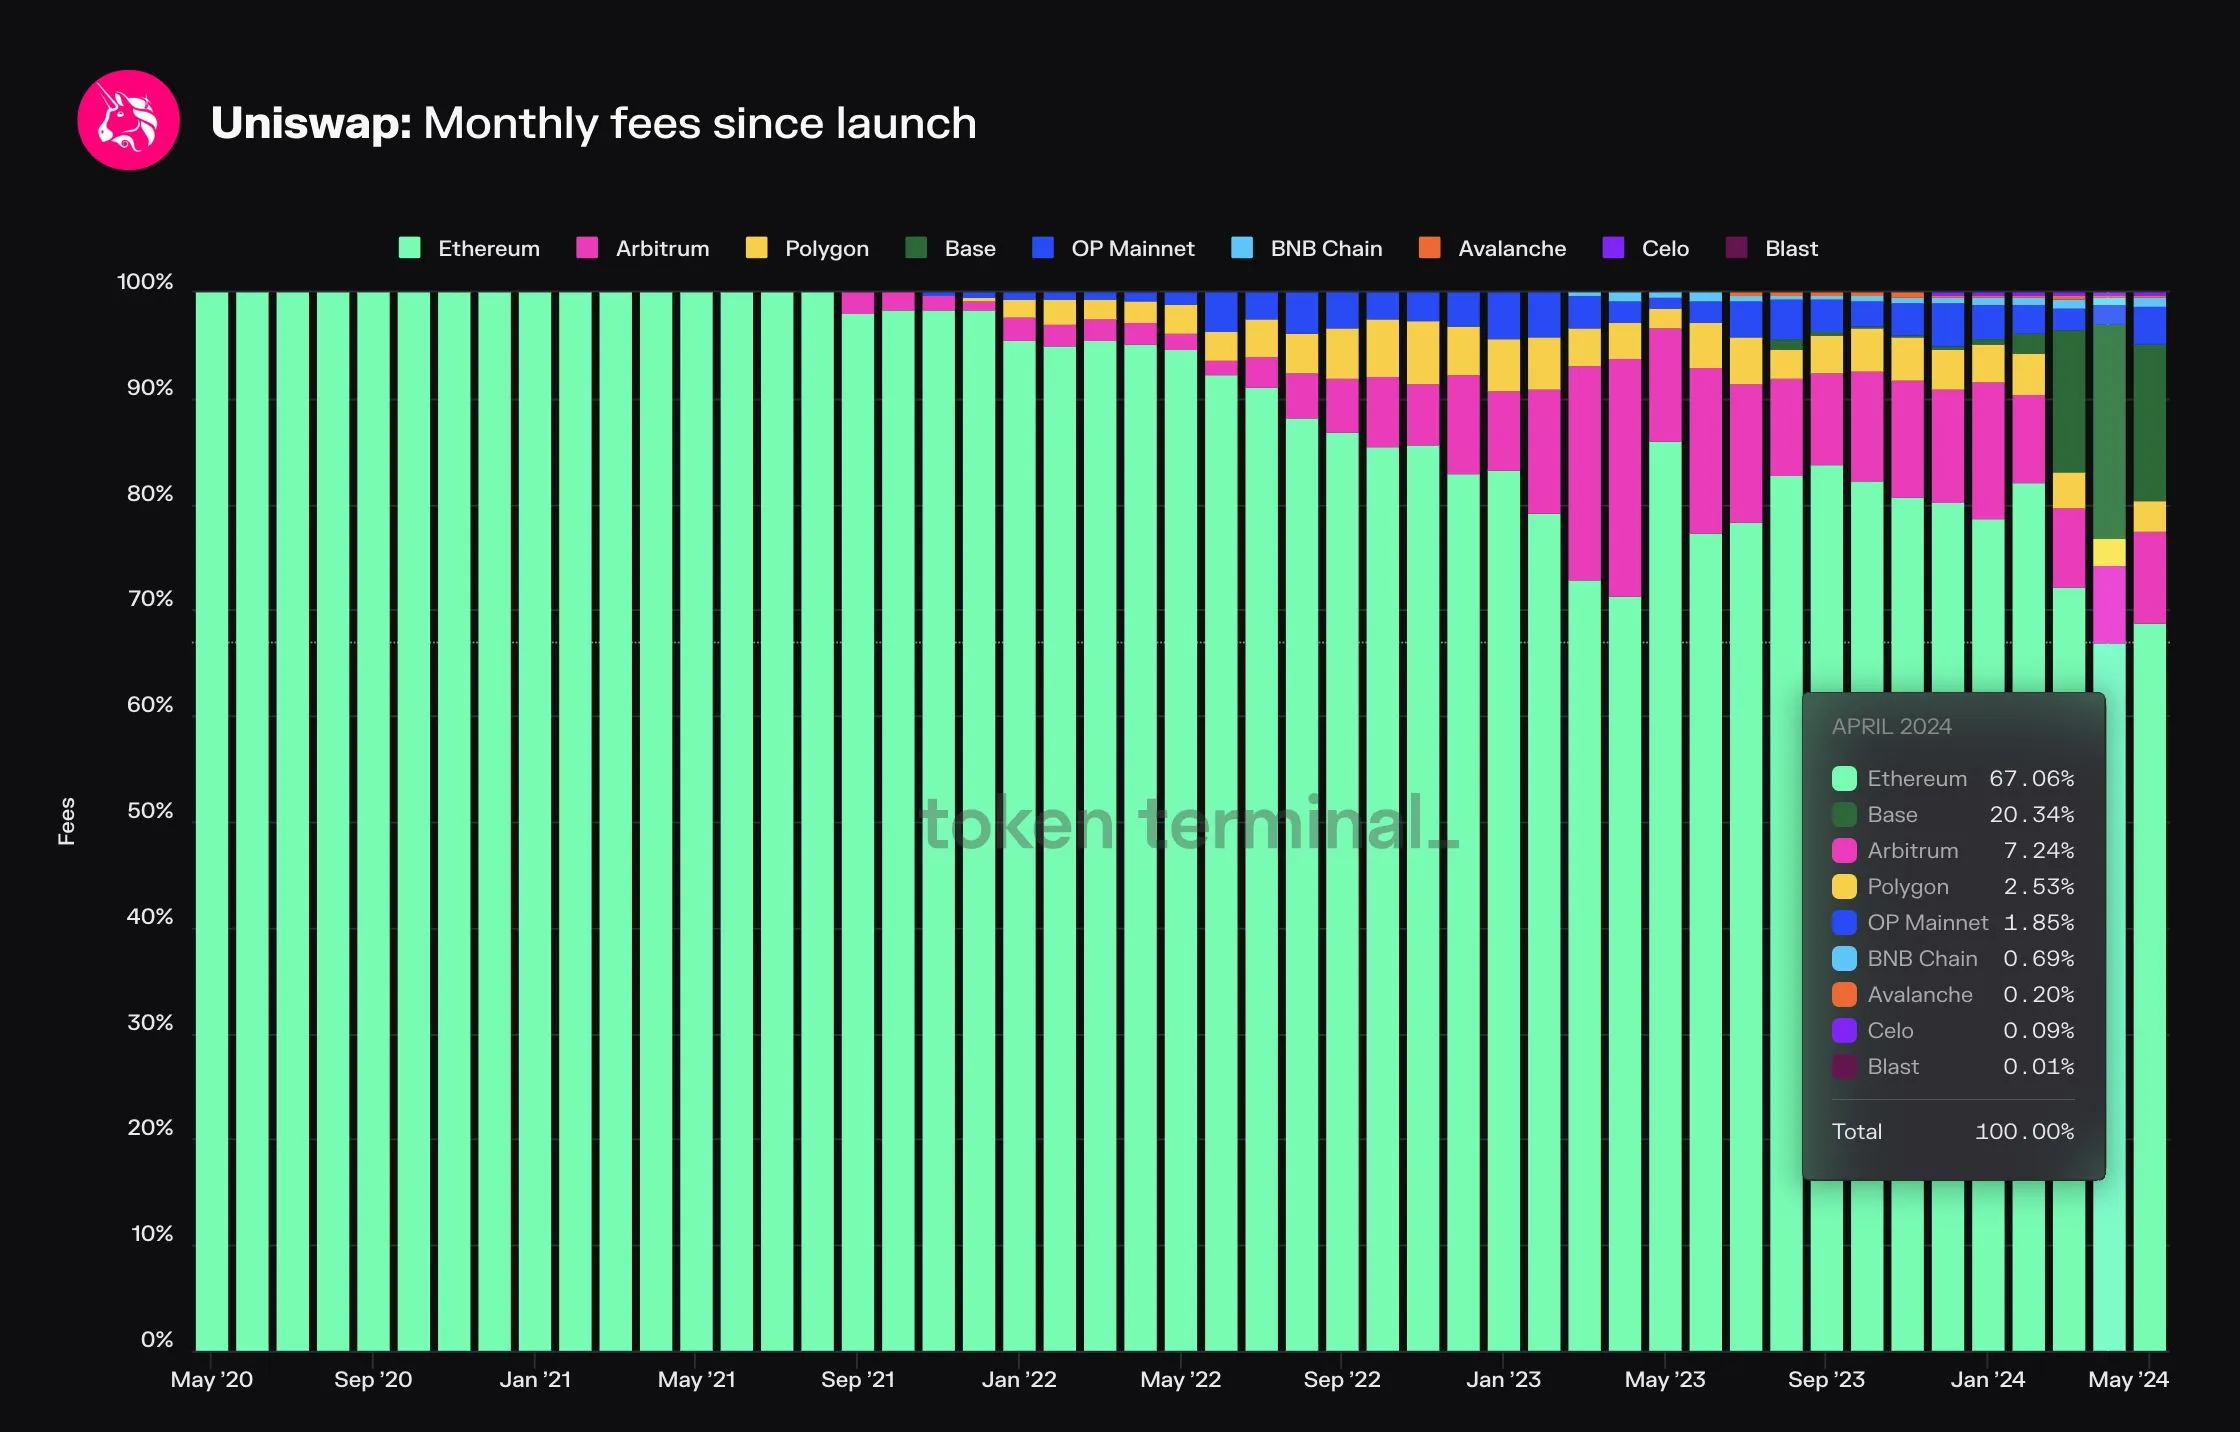 Monthly Fees on Uniswap (by chain, market share view).
Base is an outlier in terms of Fees generated
- Ethereum accounts for almost 70% of total Fees generated.
- It’s worth noting that Uniswap’s Base deployment grew to account for ~20% of total Fees generated within a few months from launch.
- 4/9 chains account for ~1% of total Fees generated.
4. Monthly active users
Monthly active users represents the number of unique addresses that have made more than 1 trade over a rolling 30d period. A higher Monthly active user figure means that there are more active Traders on the DEX, all of whom pay Fees to the Liquidity Providers.
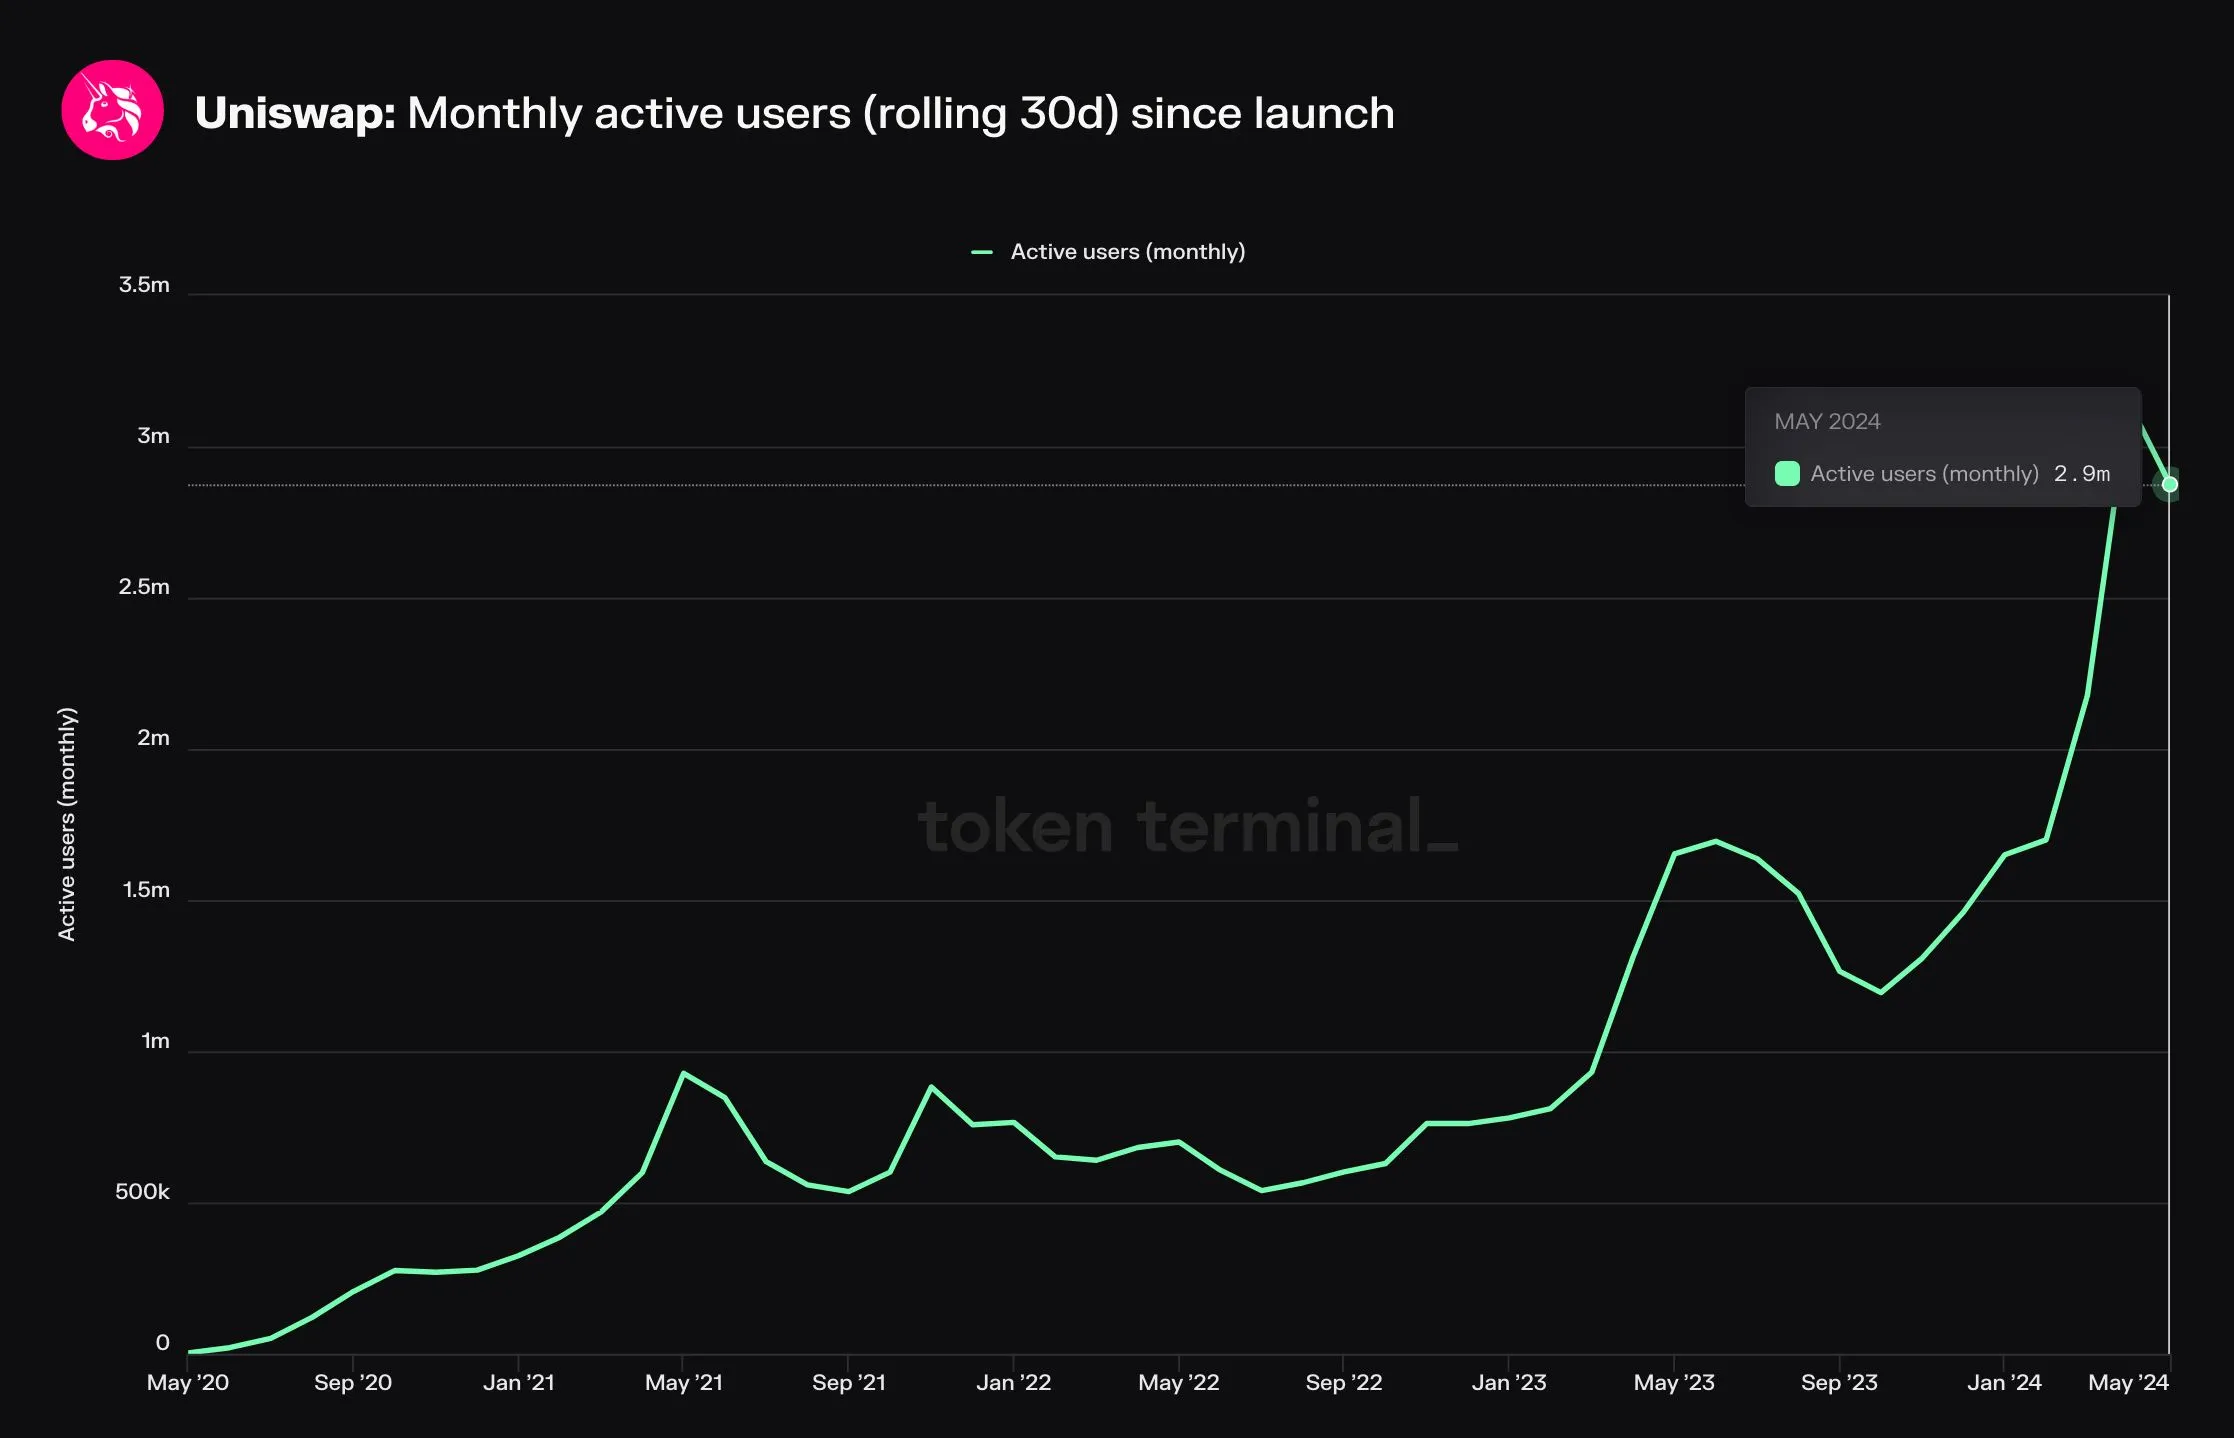 Monthly active users on Uniswap (aggregate).
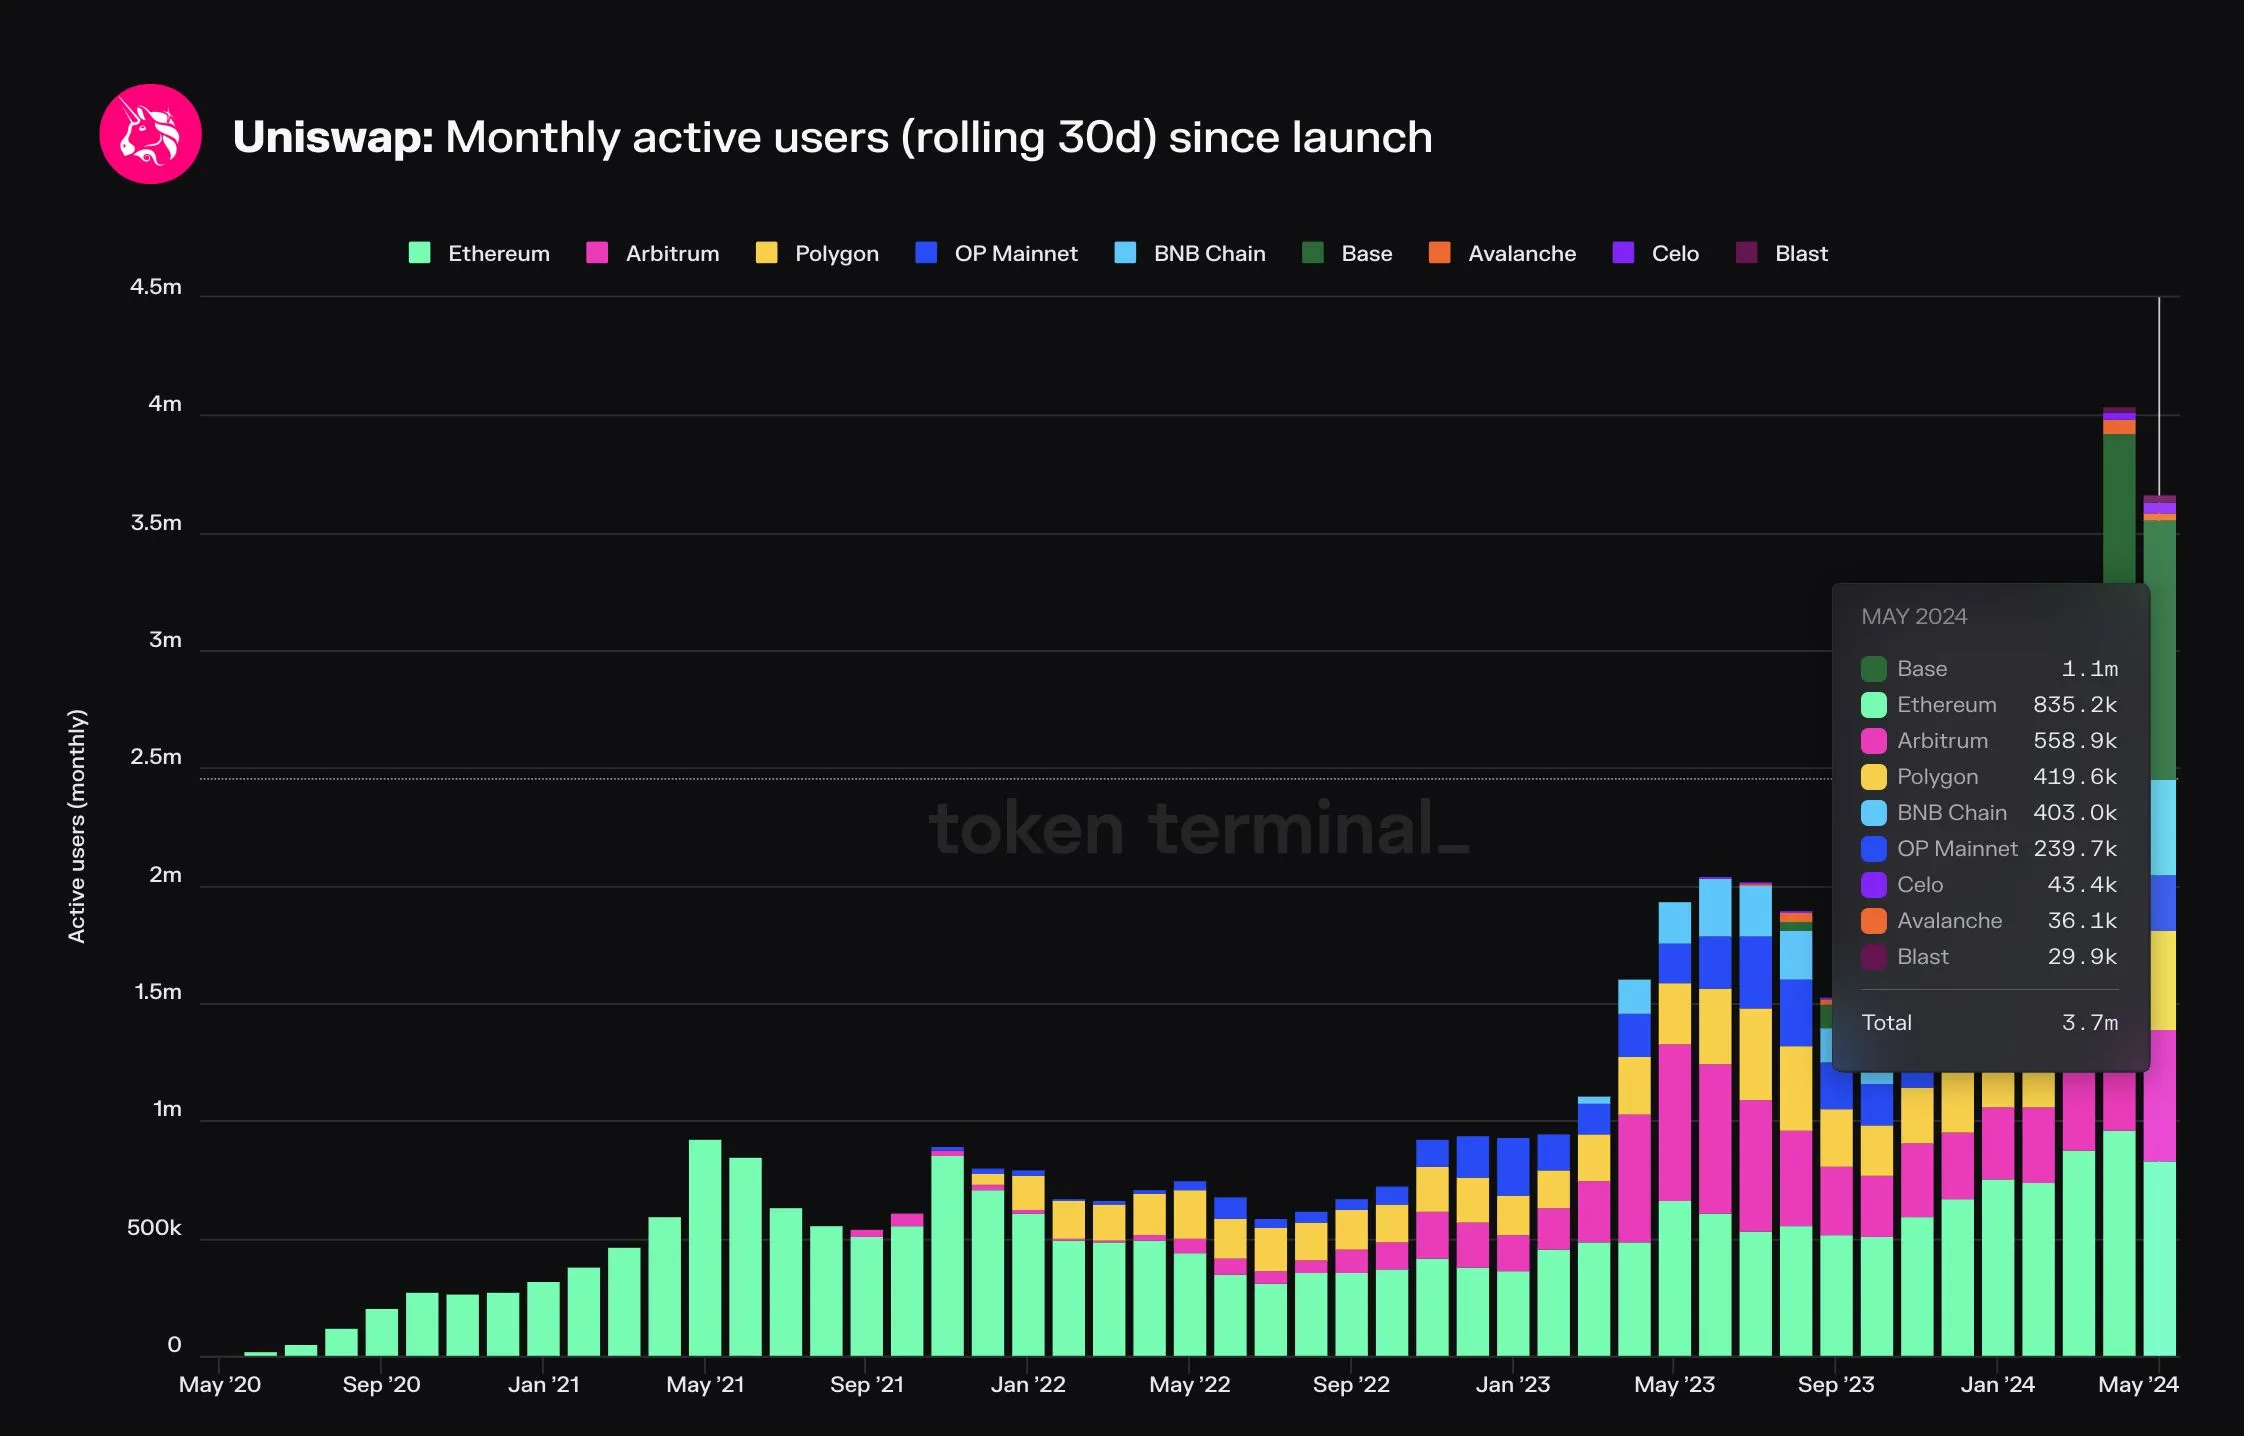 Monthly active users on Uniswap (by chain).
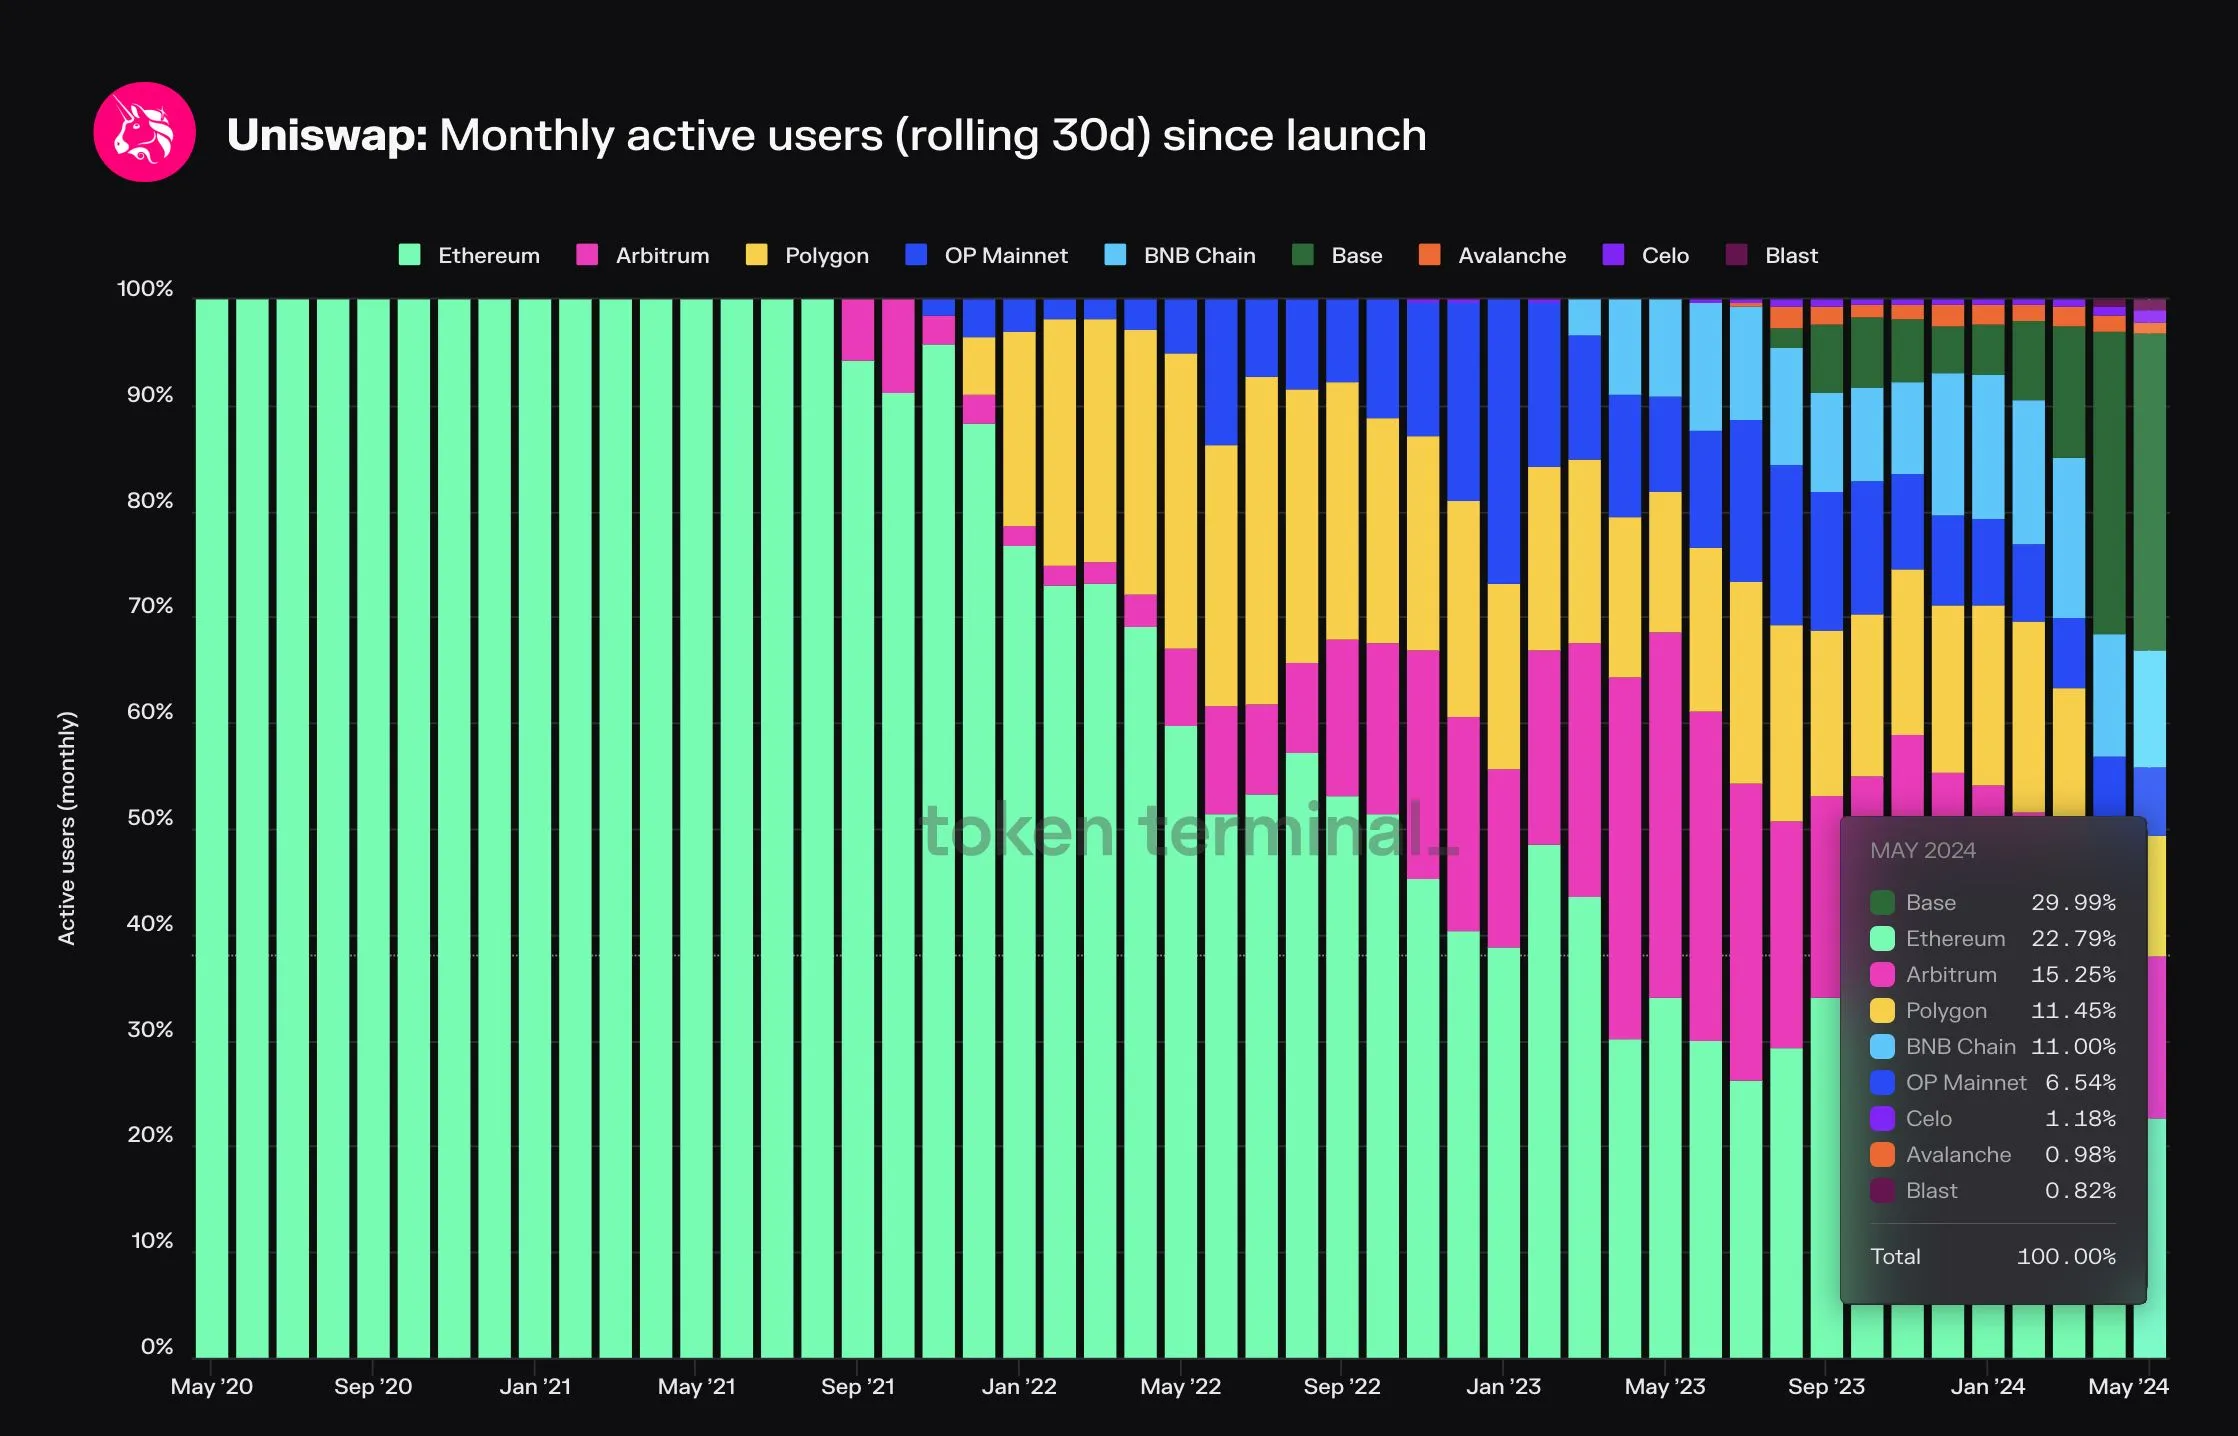 Monthly active users on Uniswap (by chain, market share view).
Compared to Net deposits, MAU figures are more widely spread out across chains
- Ethereum Mainnet accounts for “only” 23% of all MAUs on Uniswap (compared to 84% of Net deposits).
- The aggregate MAU figure is 2.9m, whereas the sum of MAUs by chain is 3.7m. This means that some users are active on more than 1 Uniswap trading venue. As a result, they’re counted as active users on multiple chains in the composition by chain charts.
- Base is the fastest growing Uniswap deployment, with ~30% MAU market share.
5. Trade count
Trade count represents the number of successful trades made on Uniswap within the relevant time period. By looking at DAUs and daily Trade counts, investors can get a sense of the activity levels on the platform, i.e. how many trades individual users make on average each day.
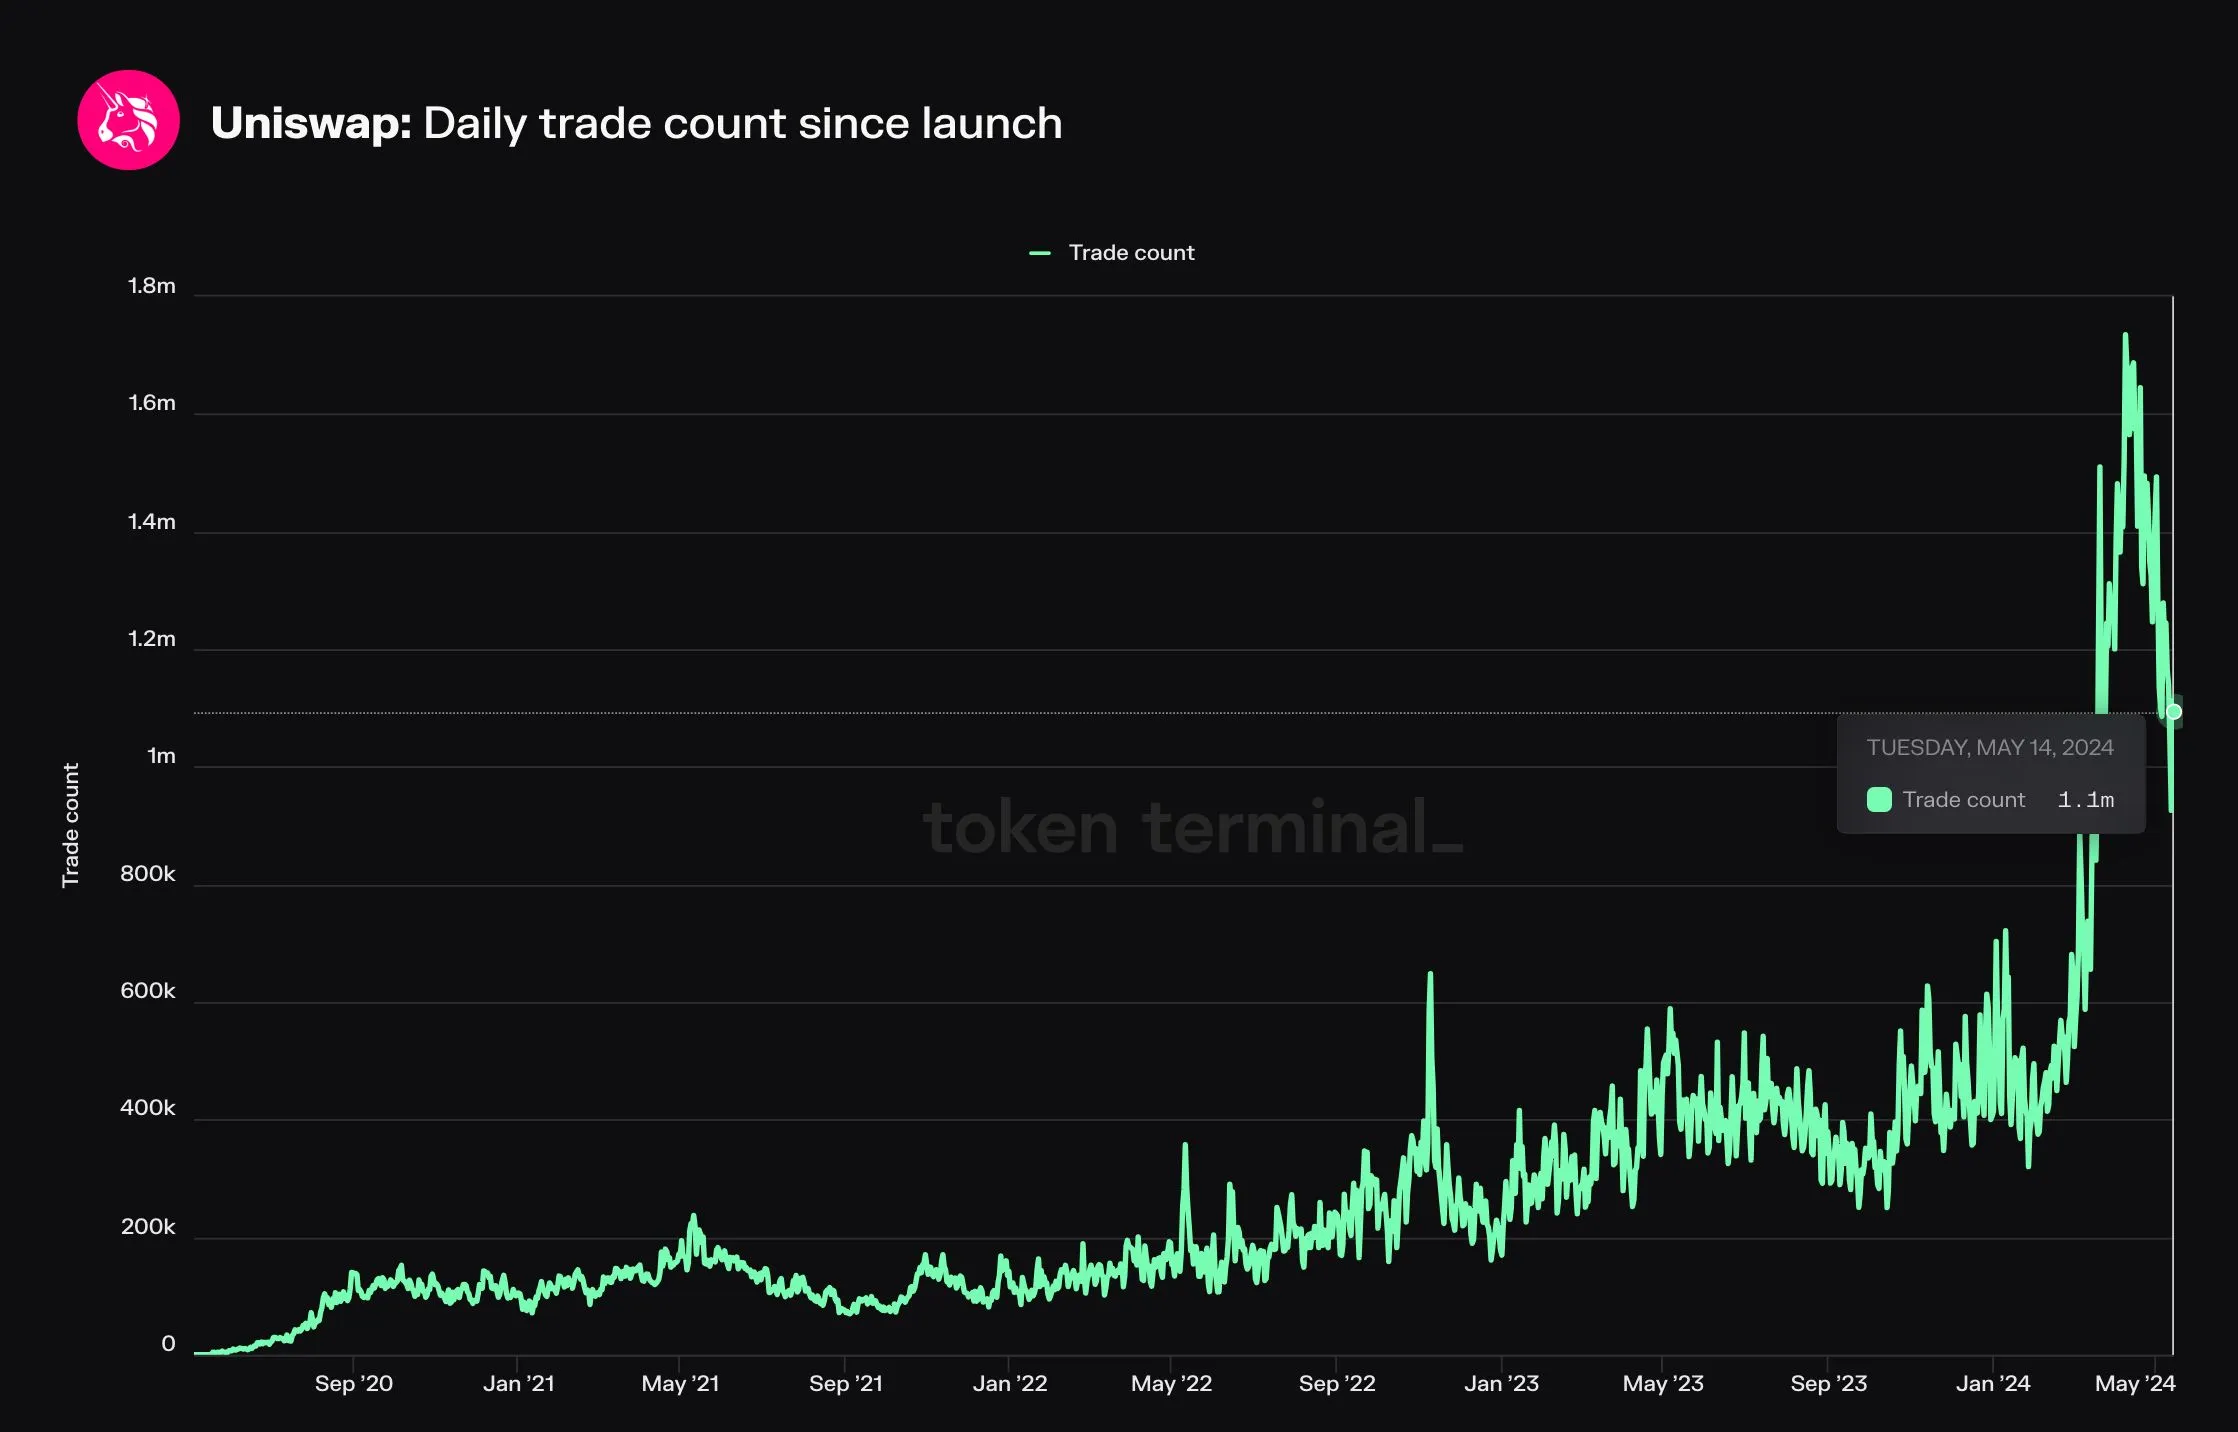 Daily Trade count on Uniswap (aggregate).
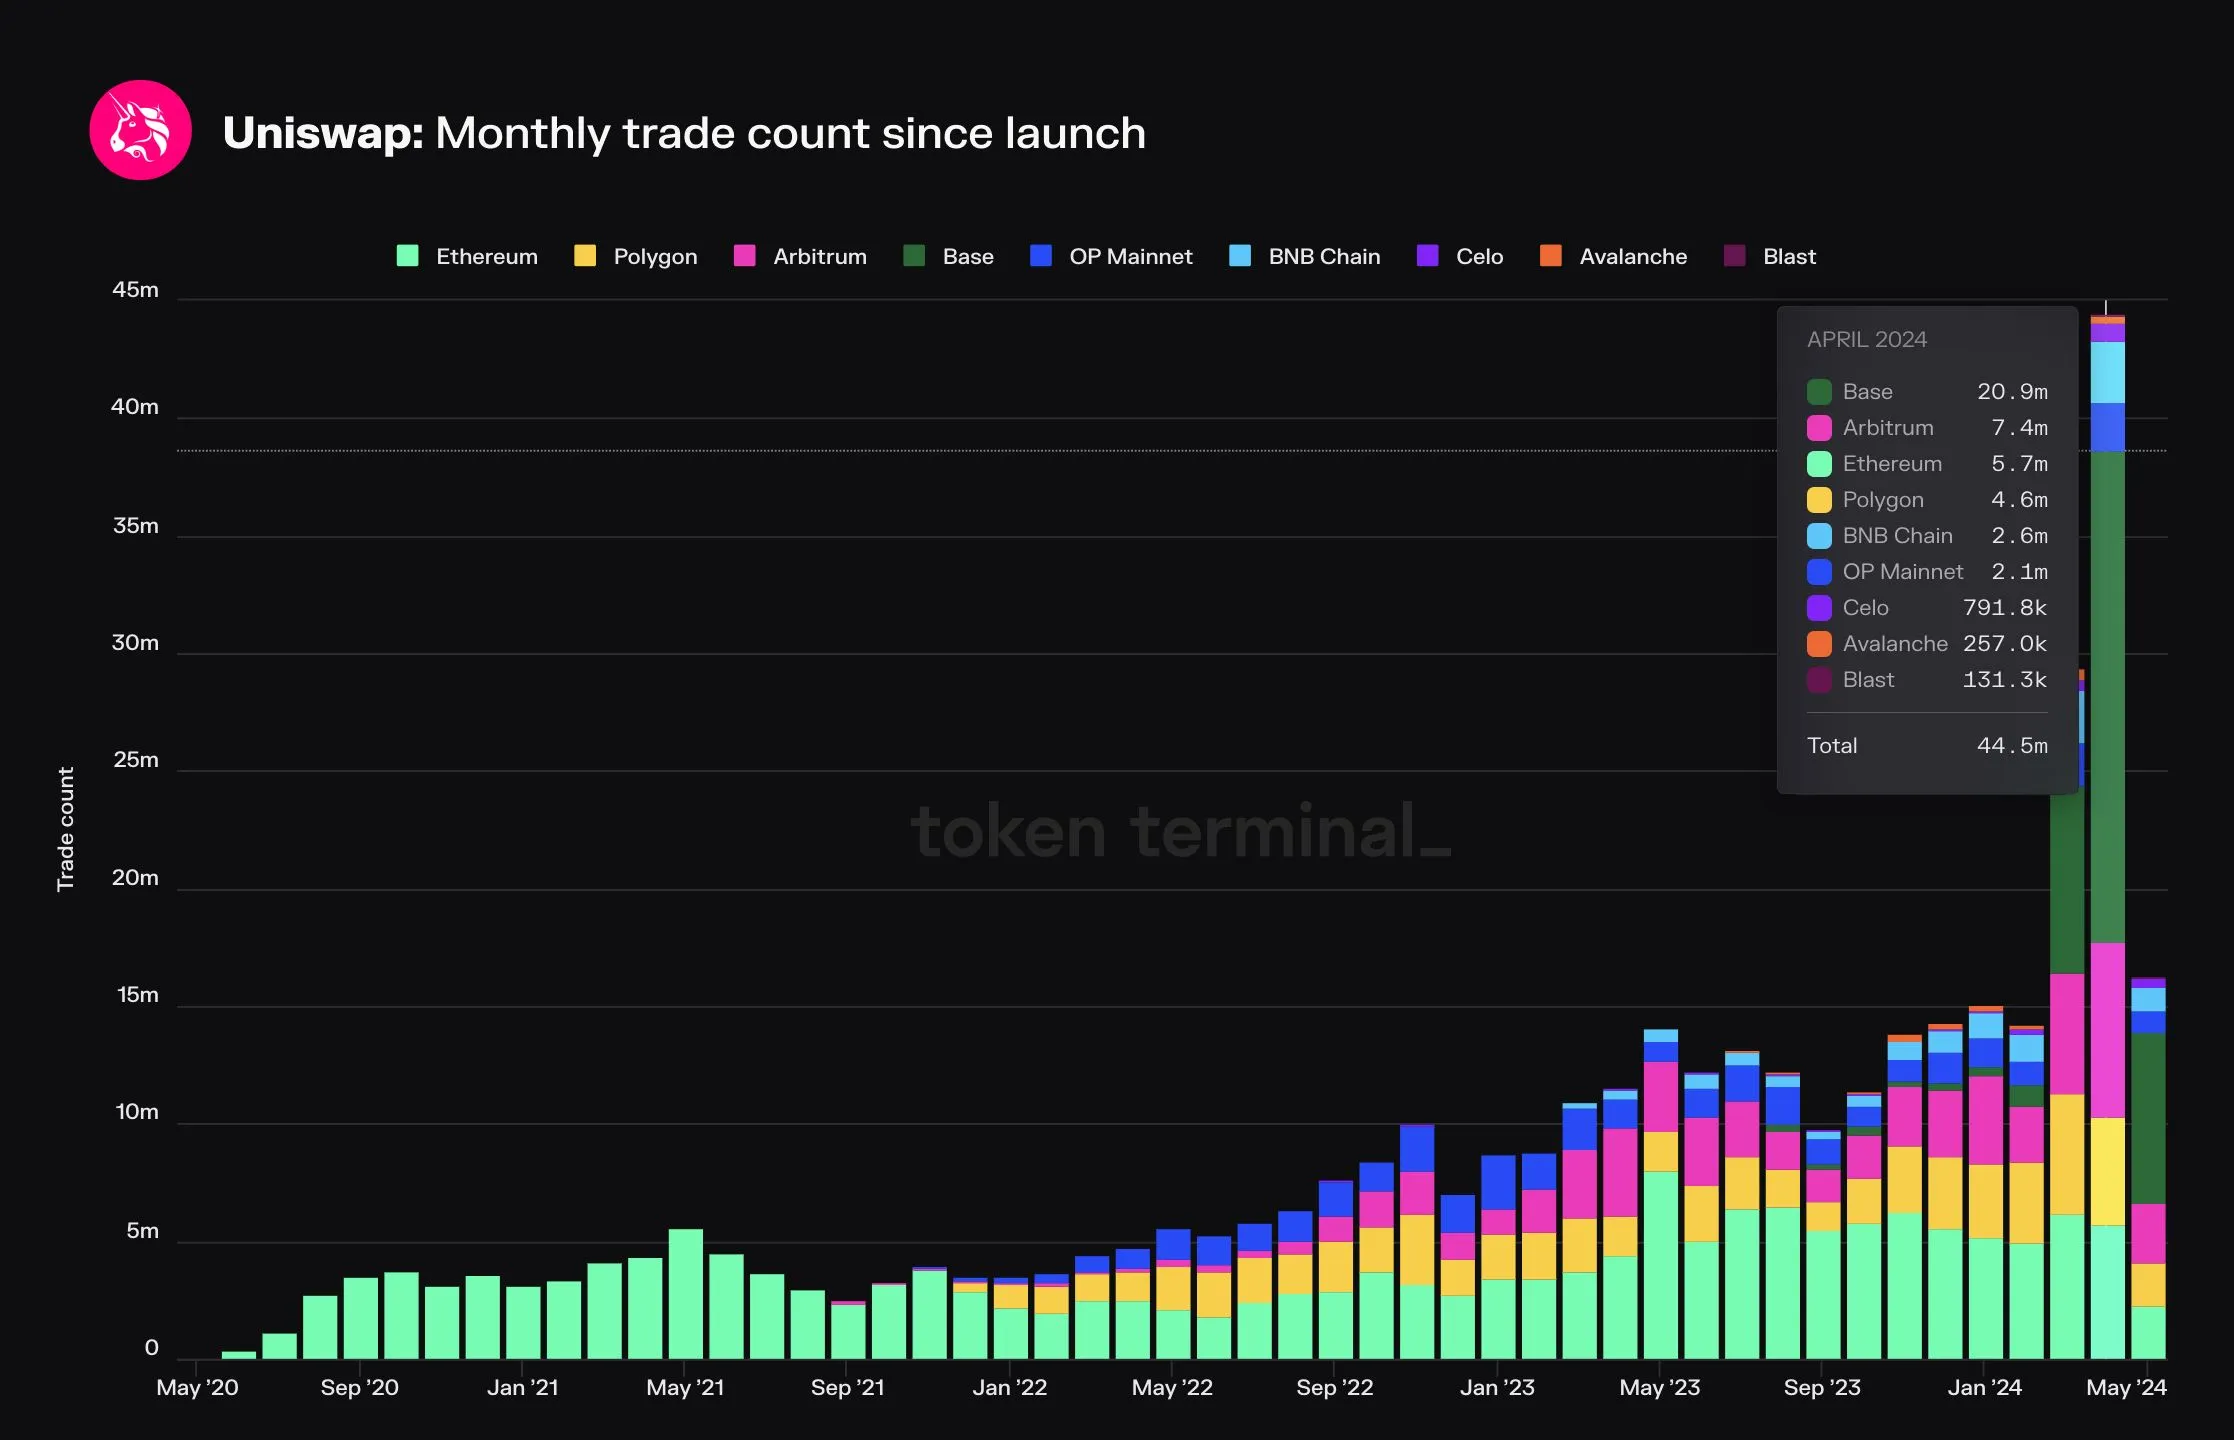 Monthly Trade count on Uniswap (by chain).
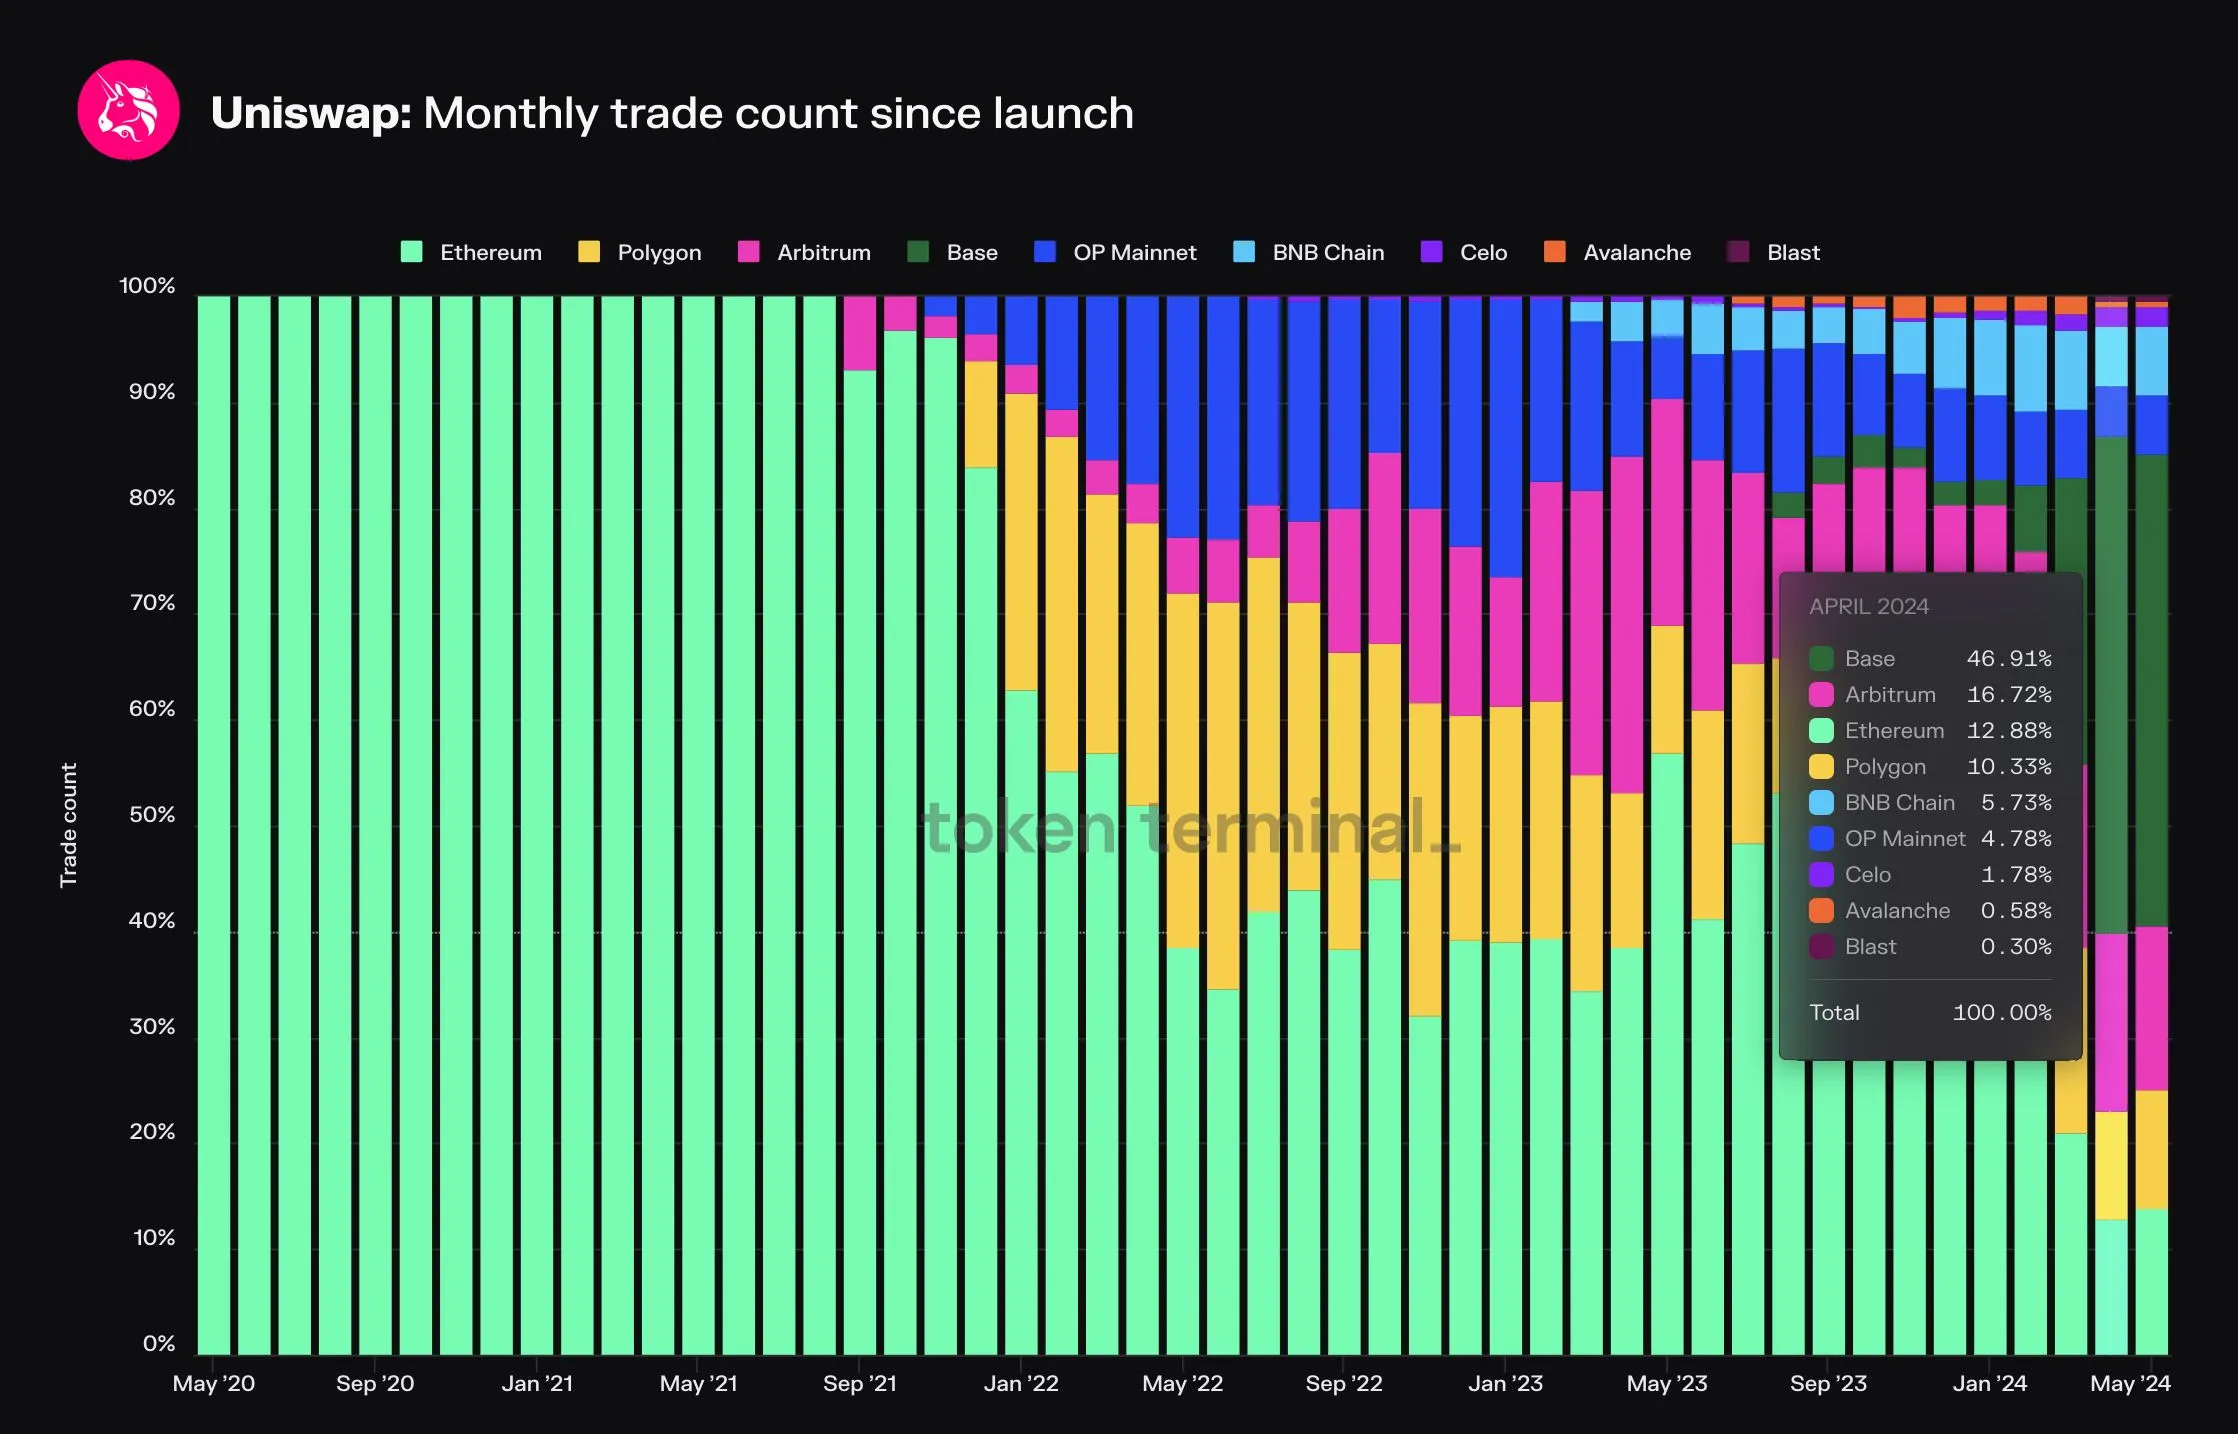 Monthly Trade count on Uniswap (by chain, market share view).
Base accounted for almost 50% of all trades on Uniswap in April
- Ethereum Mainnet accounted for “only” ~13% of all trades on Uniswap in April.
- Similar to Monthly active users, the Trade count figures are also more diversified across chains vs. Net deposits. This indicates that the use cases are different between chains.
- 2/9 chains account for ~1% of all trades.
6. Tradeable pairs
Tradeable pairs represents the number of unique trading pairs on Uniswap. The more assets there are to trade, the more interesting the platform is for Traders (and thereby Liquidity Providers). A wide asset base is also good from a revenue diversification perspective; ideally the DEX generates fees on multiple pairs vs. only a few ones.
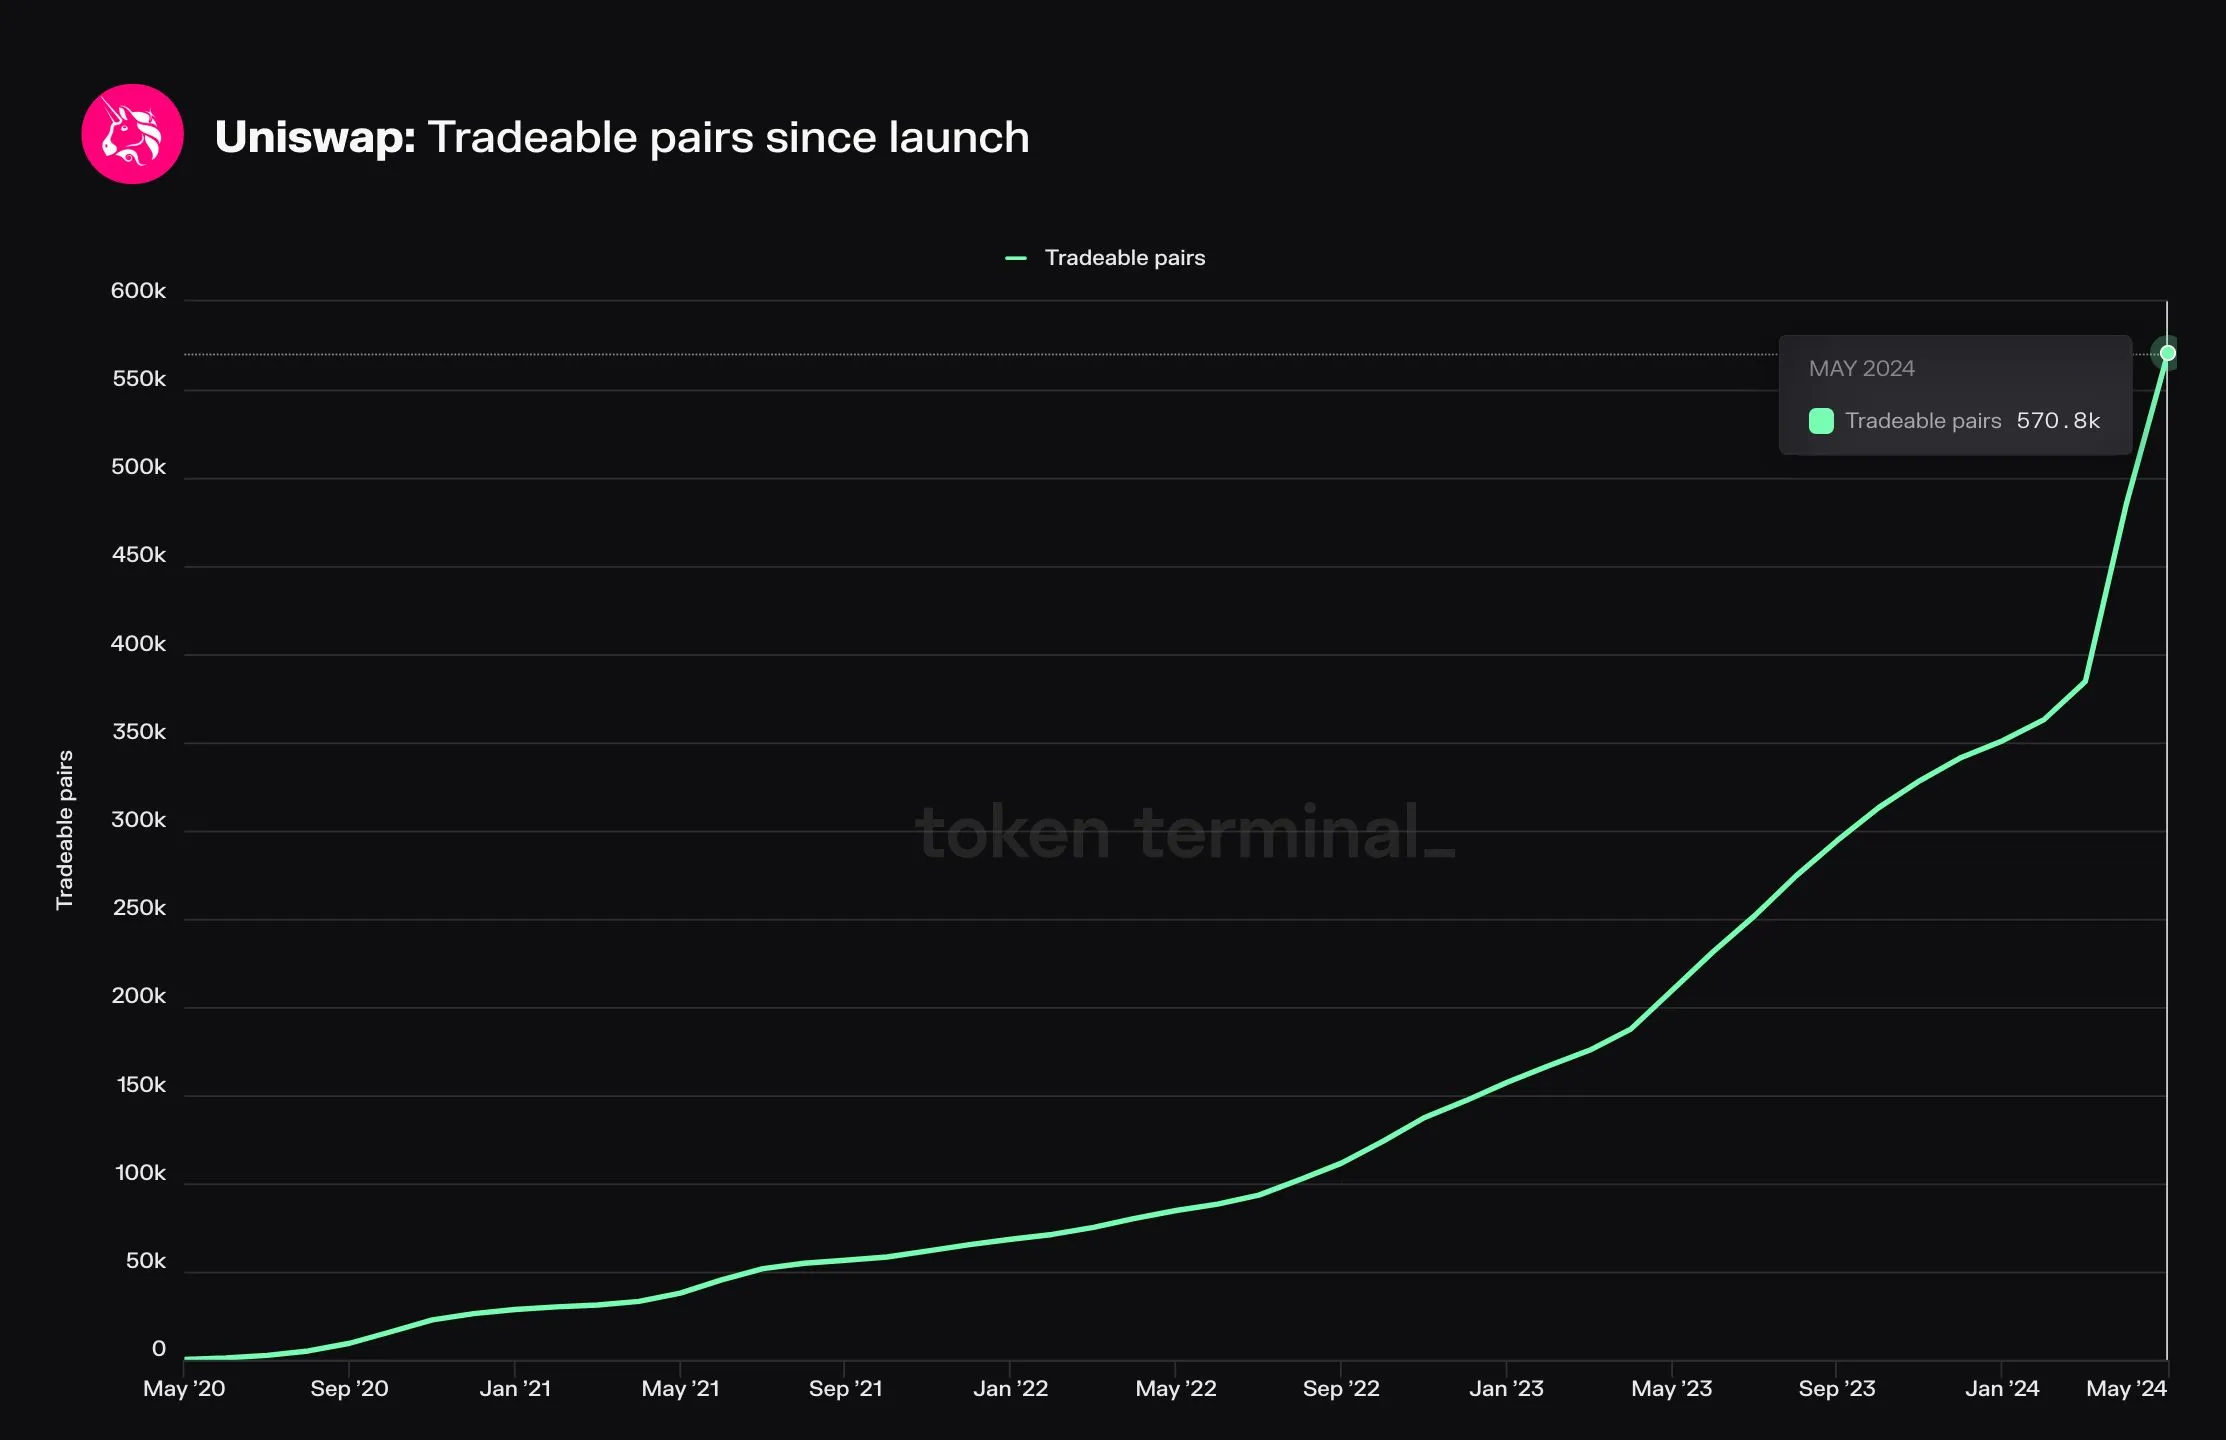 Tradeable pairs on Uniswap (aggregate).
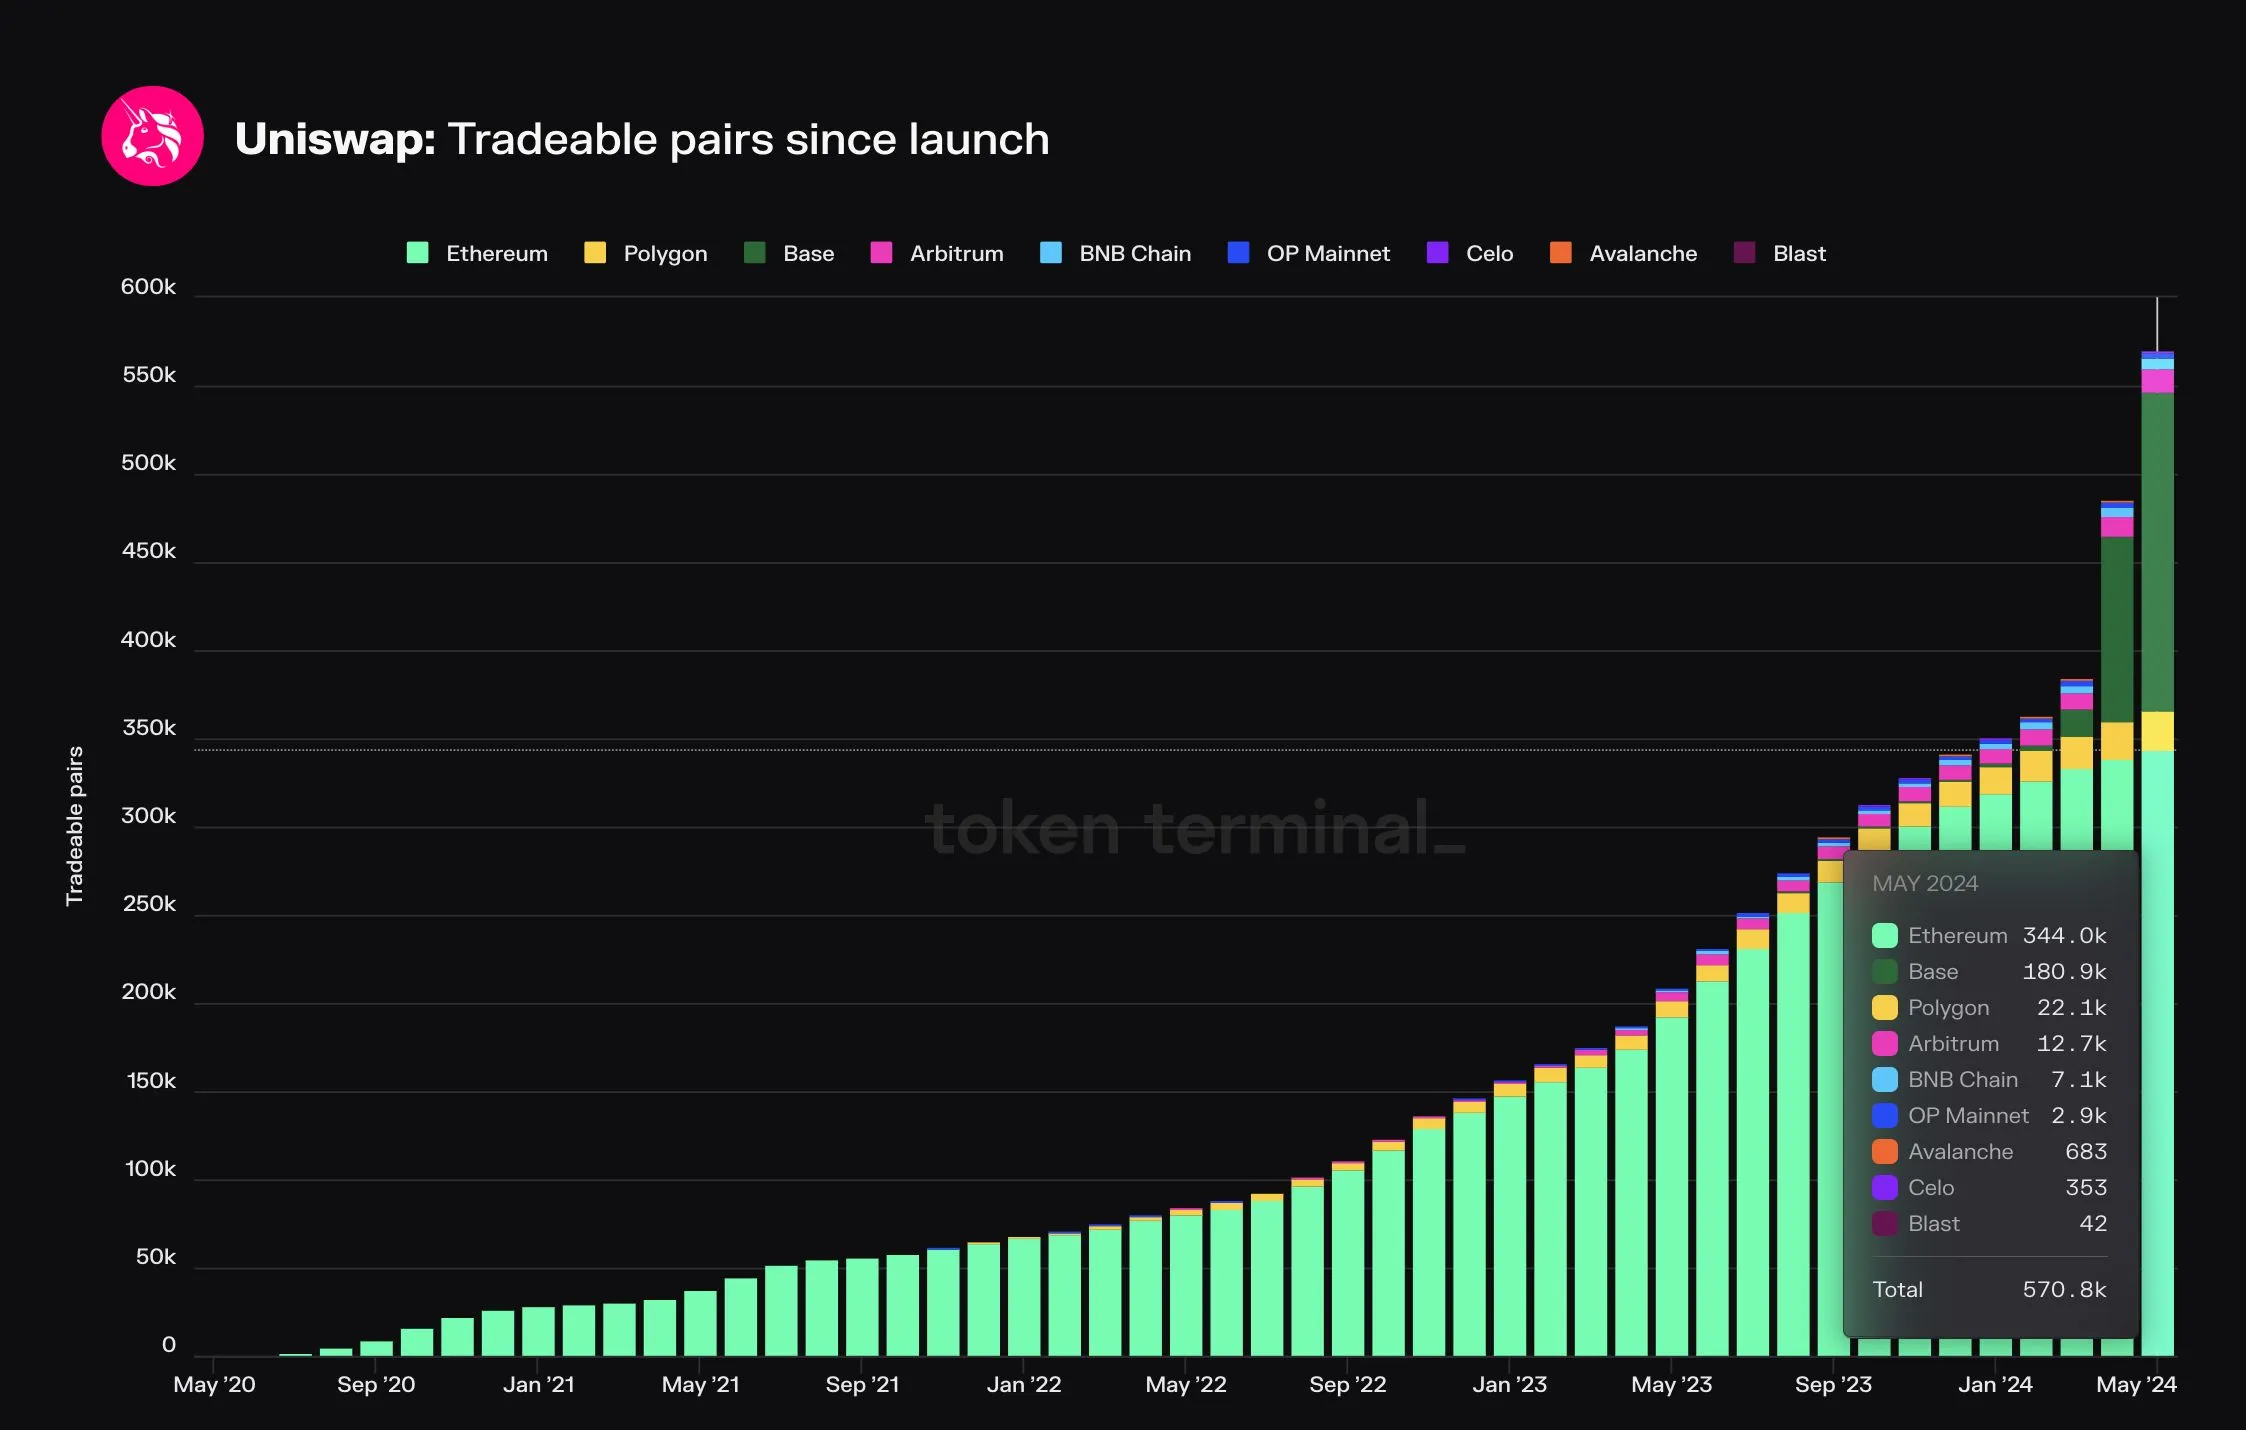 Tradeable pairs on Uniswap (by chain).
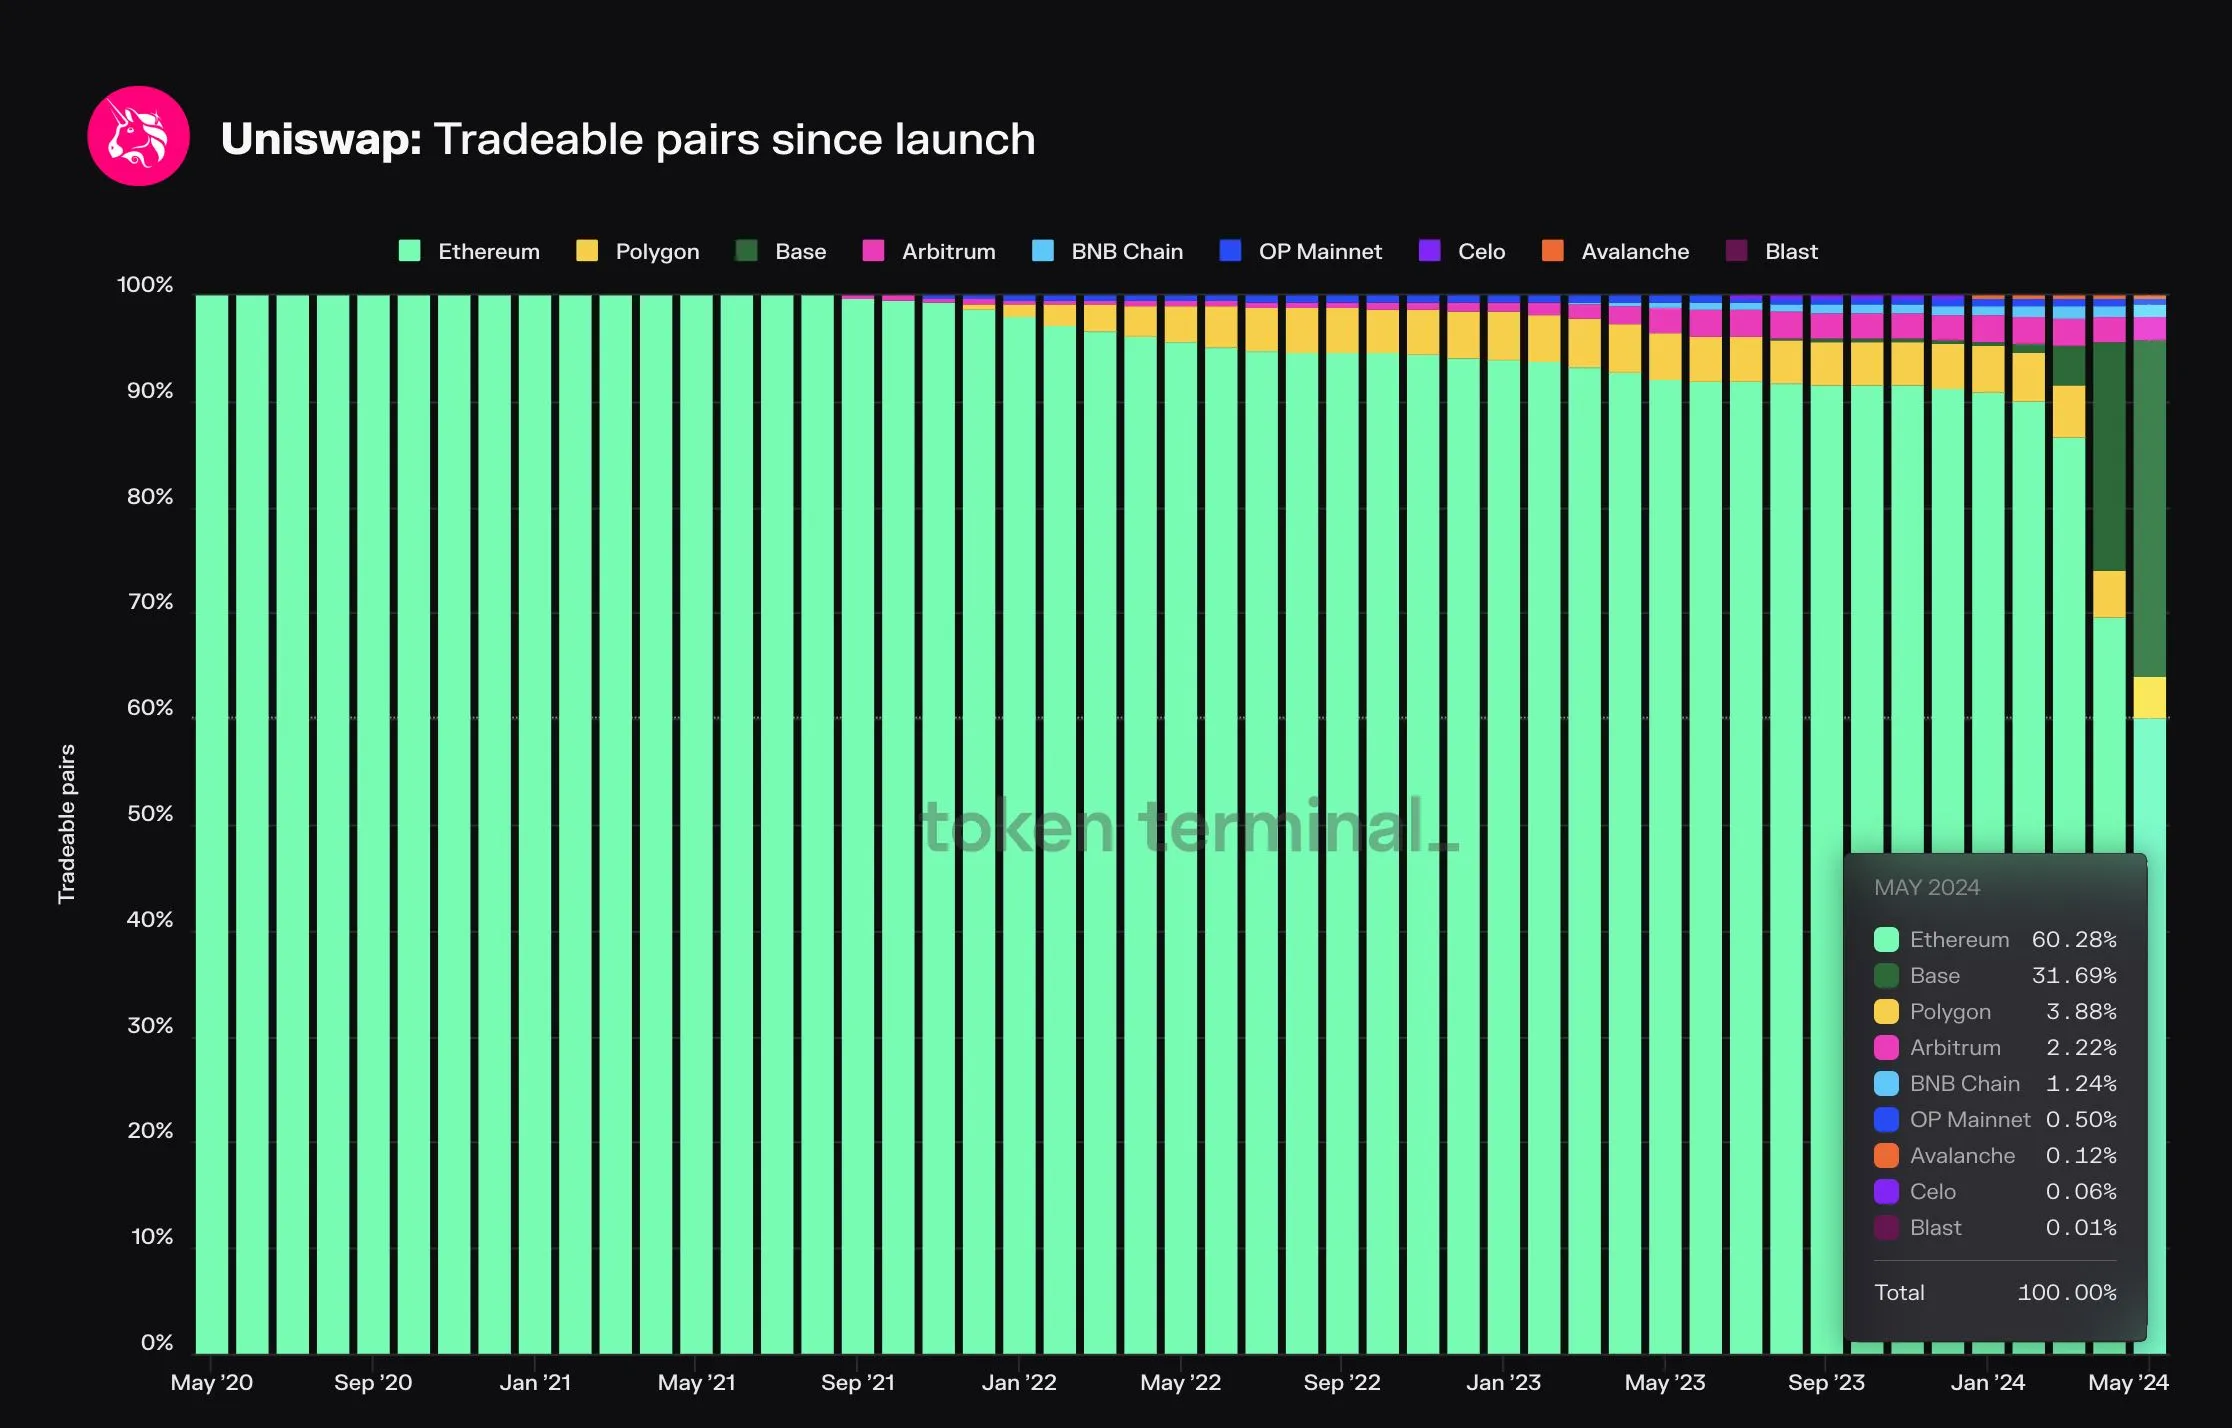 Tradeable pairs on Uniswap (by chain, market share view).
Base has attracted a significant number of new pairs in the past two months
- Base accounts for almost one third of all Tradeable pairs on Uniswap.
- Ethereum Mainnet and Base make up over 90% of all Tradeable pairs on Uniswap.
- 4/9 chains account for ~1% of all Tradeable pairs on Uniswap.
📣 Insights from our community
Data-driven insights from analysts using Token Terminal PRO
The market and our MarketVector Token Terminal Index has taken notice. 😉@tokenterminal https://t.co/ZJ9acdvnto
— Martin Leinweber (@mleinweber2) May 15, 2024
Telegram has:
- Over 900 million active users
- A trusted brand that stands for something while aligning with crypto: 1) freedom to communicate privately, 2) freedom to express yourself publicly, 3) freedom to build your apps and businesses.
- A 10x lead on its closest… pic.twitter.com/CVAQ4FaiXh— Michael Nadeau | The DeFi Report (@JustDeauIt) May 14, 2024
Token distribution is one of the most overlooked aspects of token design, especially with some of the more recently launched projects. Over the past year, the number of $TON holders has increased by 613% (to 15.7M) and is up 33% since last month. @ton_blockchain now has more… pic.twitter.com/AtKxfmSk3G
— David Alexander II (@Mega_Fund) May 13, 2024
The authors of this content, or members, affiliates, or stakeholders of Token Terminal may be participating or are invested in protocols or tokens mentioned herein. The foregoing statement acts as a disclosure of potential conflicts of interest and is not a recommendation to purchase or invest in any token or participate in any protocol. Token Terminal does not recommend any particular course of action in relation to any token or protocol. The content herein is meant purely for educational and informational purposes only, and should not be relied upon as financial, investment, legal, tax or any other professional or other advice. None of the content and information herein is presented to induce or to attempt to induce any reader or other person to buy, sell or hold any token or participate in any protocol or enter into, or offer to enter into, any agreement for or with a view to buying or selling any token or participating in any protocol. Statements made herein (including statements of opinion, if any) are wholly generic and not tailored to take into account the personal needs and unique circumstances of any reader or any other person. Readers are strongly urged to exercise caution and have regard to their own personal needs and circumstances before making any decision to buy or sell any token or participate in any protocol. Observations and views expressed herein may be changed by Token Terminal at any time without notice. Token Terminal accepts no liability whatsoever for any losses or liabilities arising from the use of or reliance on any of this content.
Stay in the loop
Join our mailing list to get the latest insights!
Continue reading
The Rainmakers of the Crypto Market
This week’s newsletter focuses on protocols (blockchains & decentralized applications) that generate the most fees. We’ll learn that analyzing only one chart from the Terminal can tell us a lot about the industry dynamics in the crypto market.
Asset Tokenization, the Return of the Incumbents?
This week’s newsletter focuses on asset tokenization and the impact it could end up having on the crypto markets. We explore (i) how asset tokenization works, (ii) why incumbent companies might have an edge in leveraging blockchains, and (iii) what’s actually happening onchain today.
Ethereum – The “Dividend” King of Crypto
This week's newsletter dives into the economics of Ethereum. We provide a step-by-step explanation of how the Ethereum network is able to turn a profit. Further, we take a look at how Ethereum benchmarks against some of the leading financial services and technology companies in terms of dividend and buyback yields – two profit distribution-related metrics that are well-known in traditional finance, but rarely talked about in crypto.