
Blockchain comparison
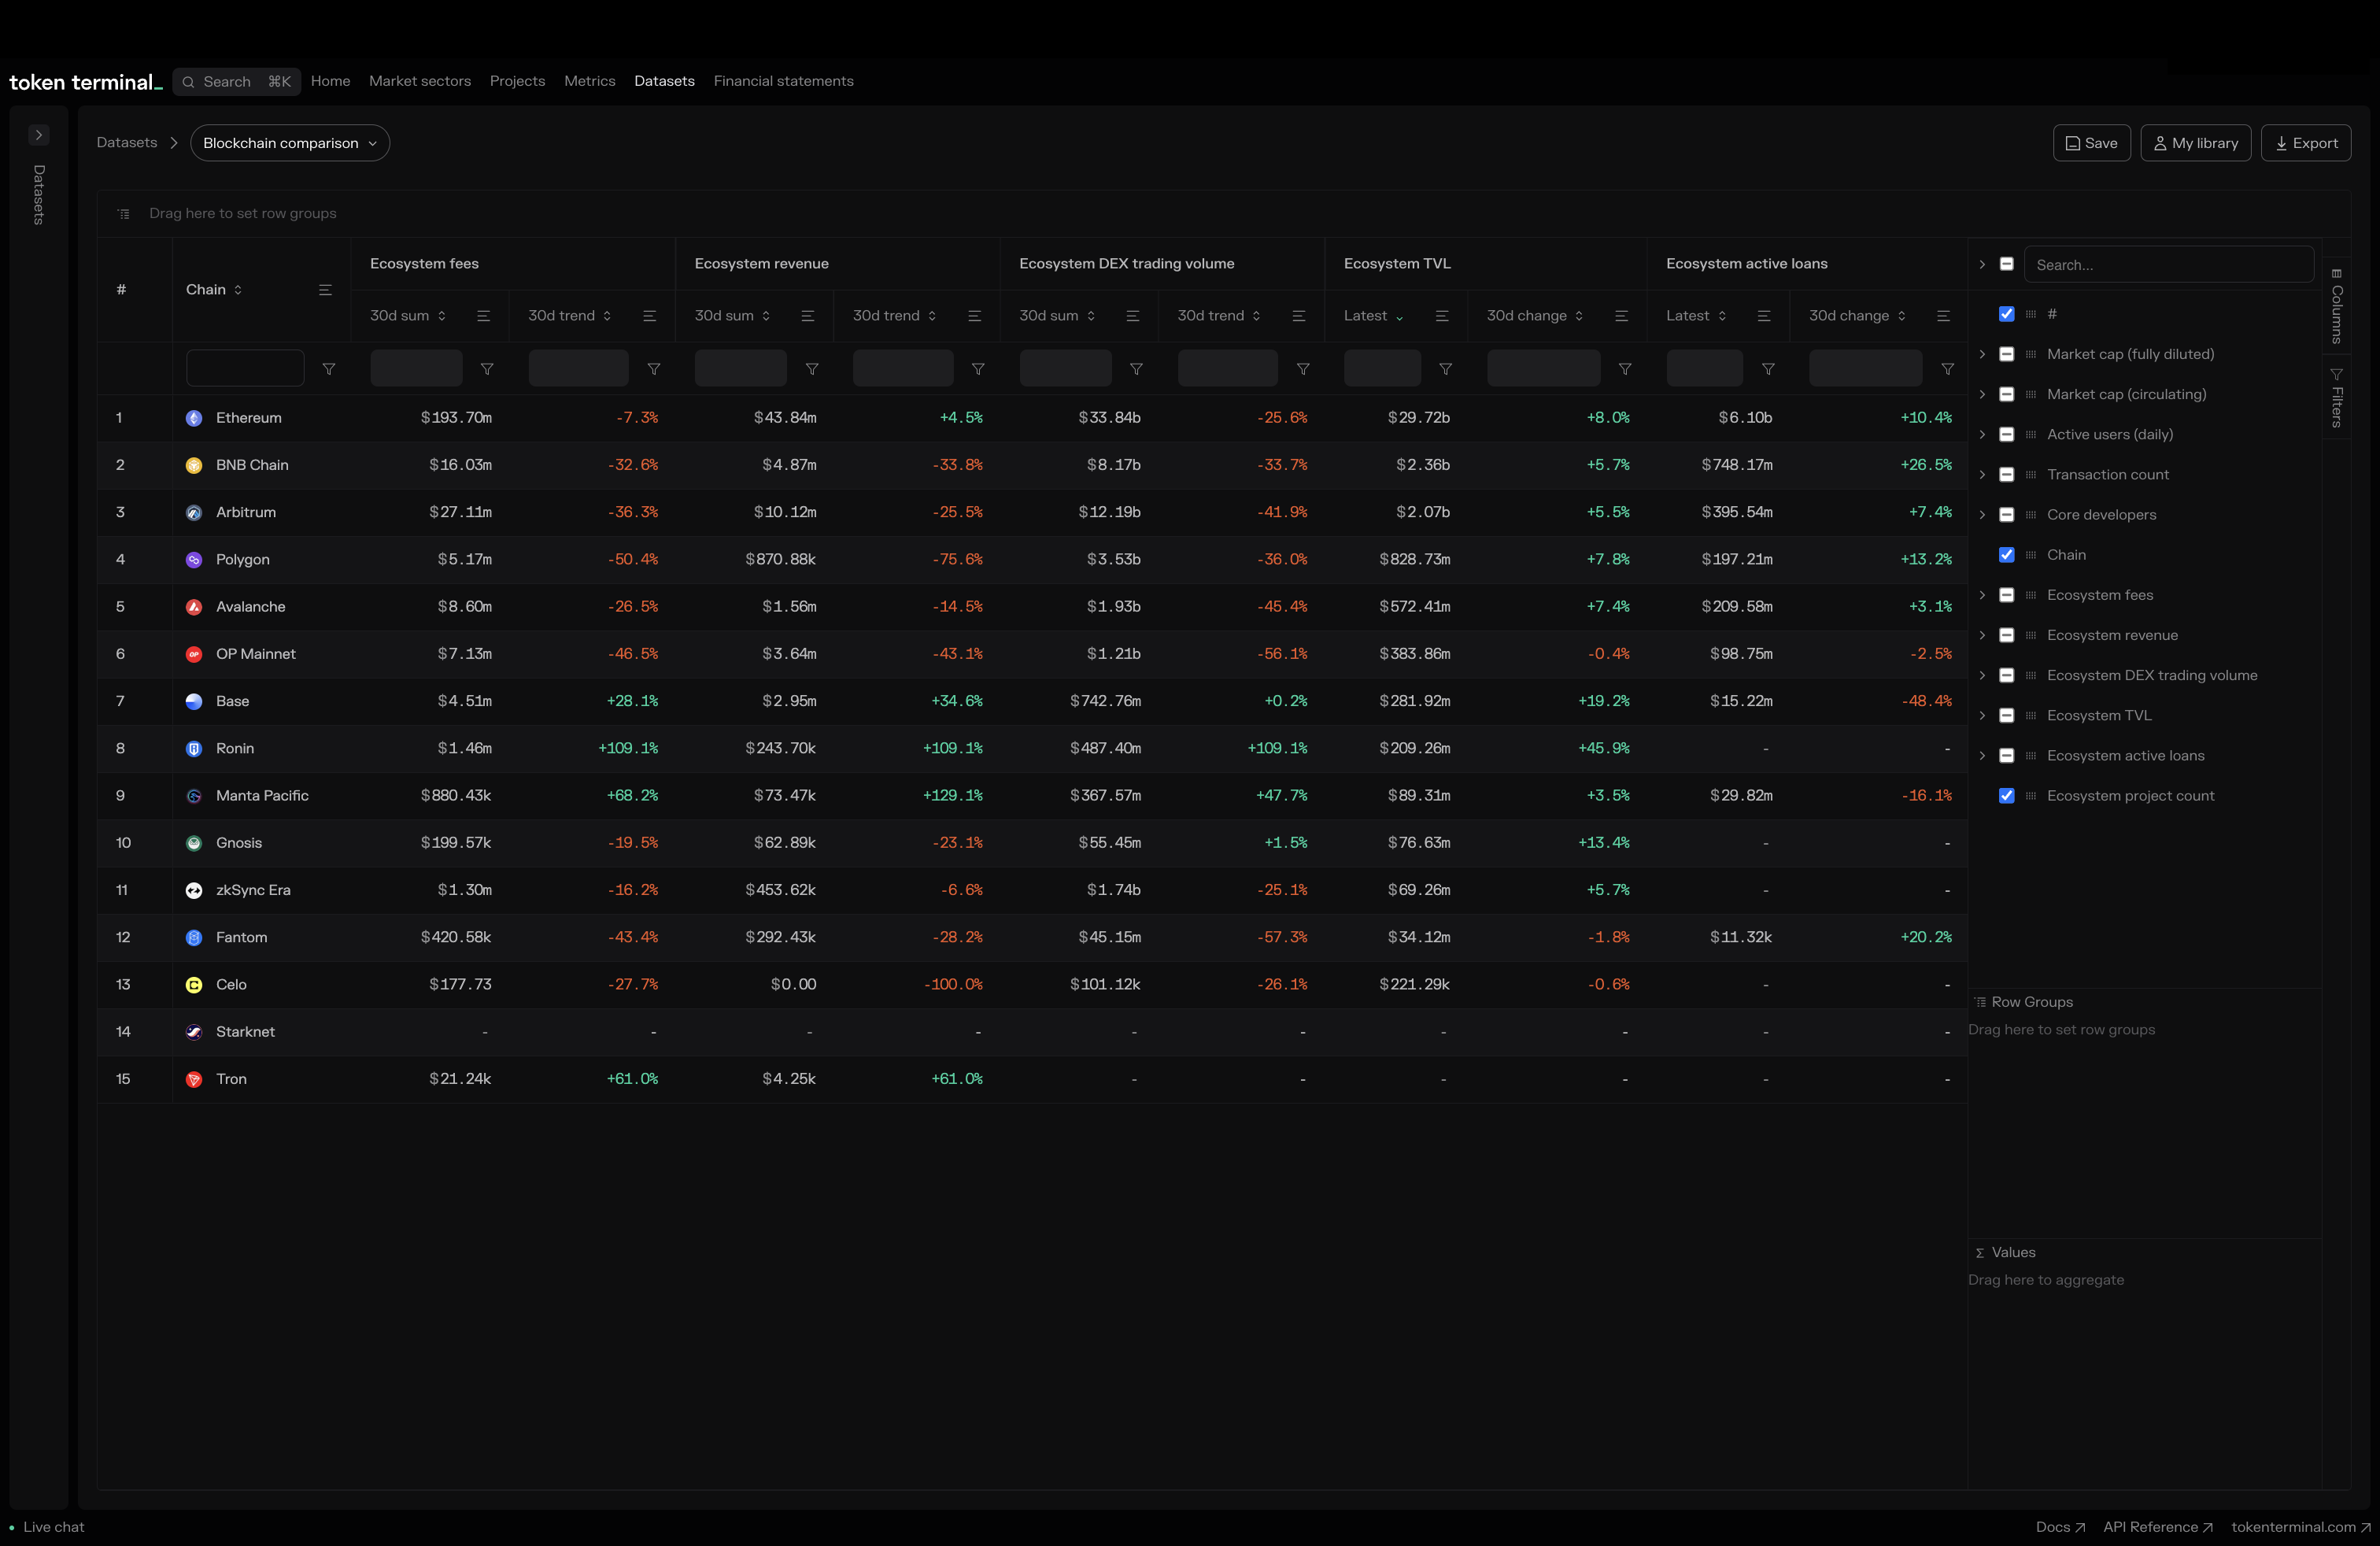
What is this data table: Ecosystem metrics for leading Blockchains (L1) & Blockchains (L2).
What does this data table show: The data table provides a comprehensive comparison of different blockchains, featuring five chain-specific metrics including fully diluted and circulating market cap, daily active users, transaction count, and number of core developers. Additionally, it covers six aggregate ecosystem metrics for each chain, encompassing ecosystem fees, revenue, DEX trading volume, TVL, active loans, and project count.
Why do we show it: We showcase this data to provide a comprehensive understanding of the economic and developmental status of key blockchain ecosystems and facilitate comparative analysis. It's vital to grasp the intricacies of these ecosystems to effectively evaluate blockchain applications, considering factors like constraints and competition within each chain. Our Blockchain comparison dataset serves as a fundamental starting point for conducting thorough top-down research, complemented by additional Token Terminal datasets such as Trending contracts and Cohort analysis.
Blockchain comparison data table: https://tokenterminal.com/terminal/datasets/blockchain-comparison
Updated 2 months ago