
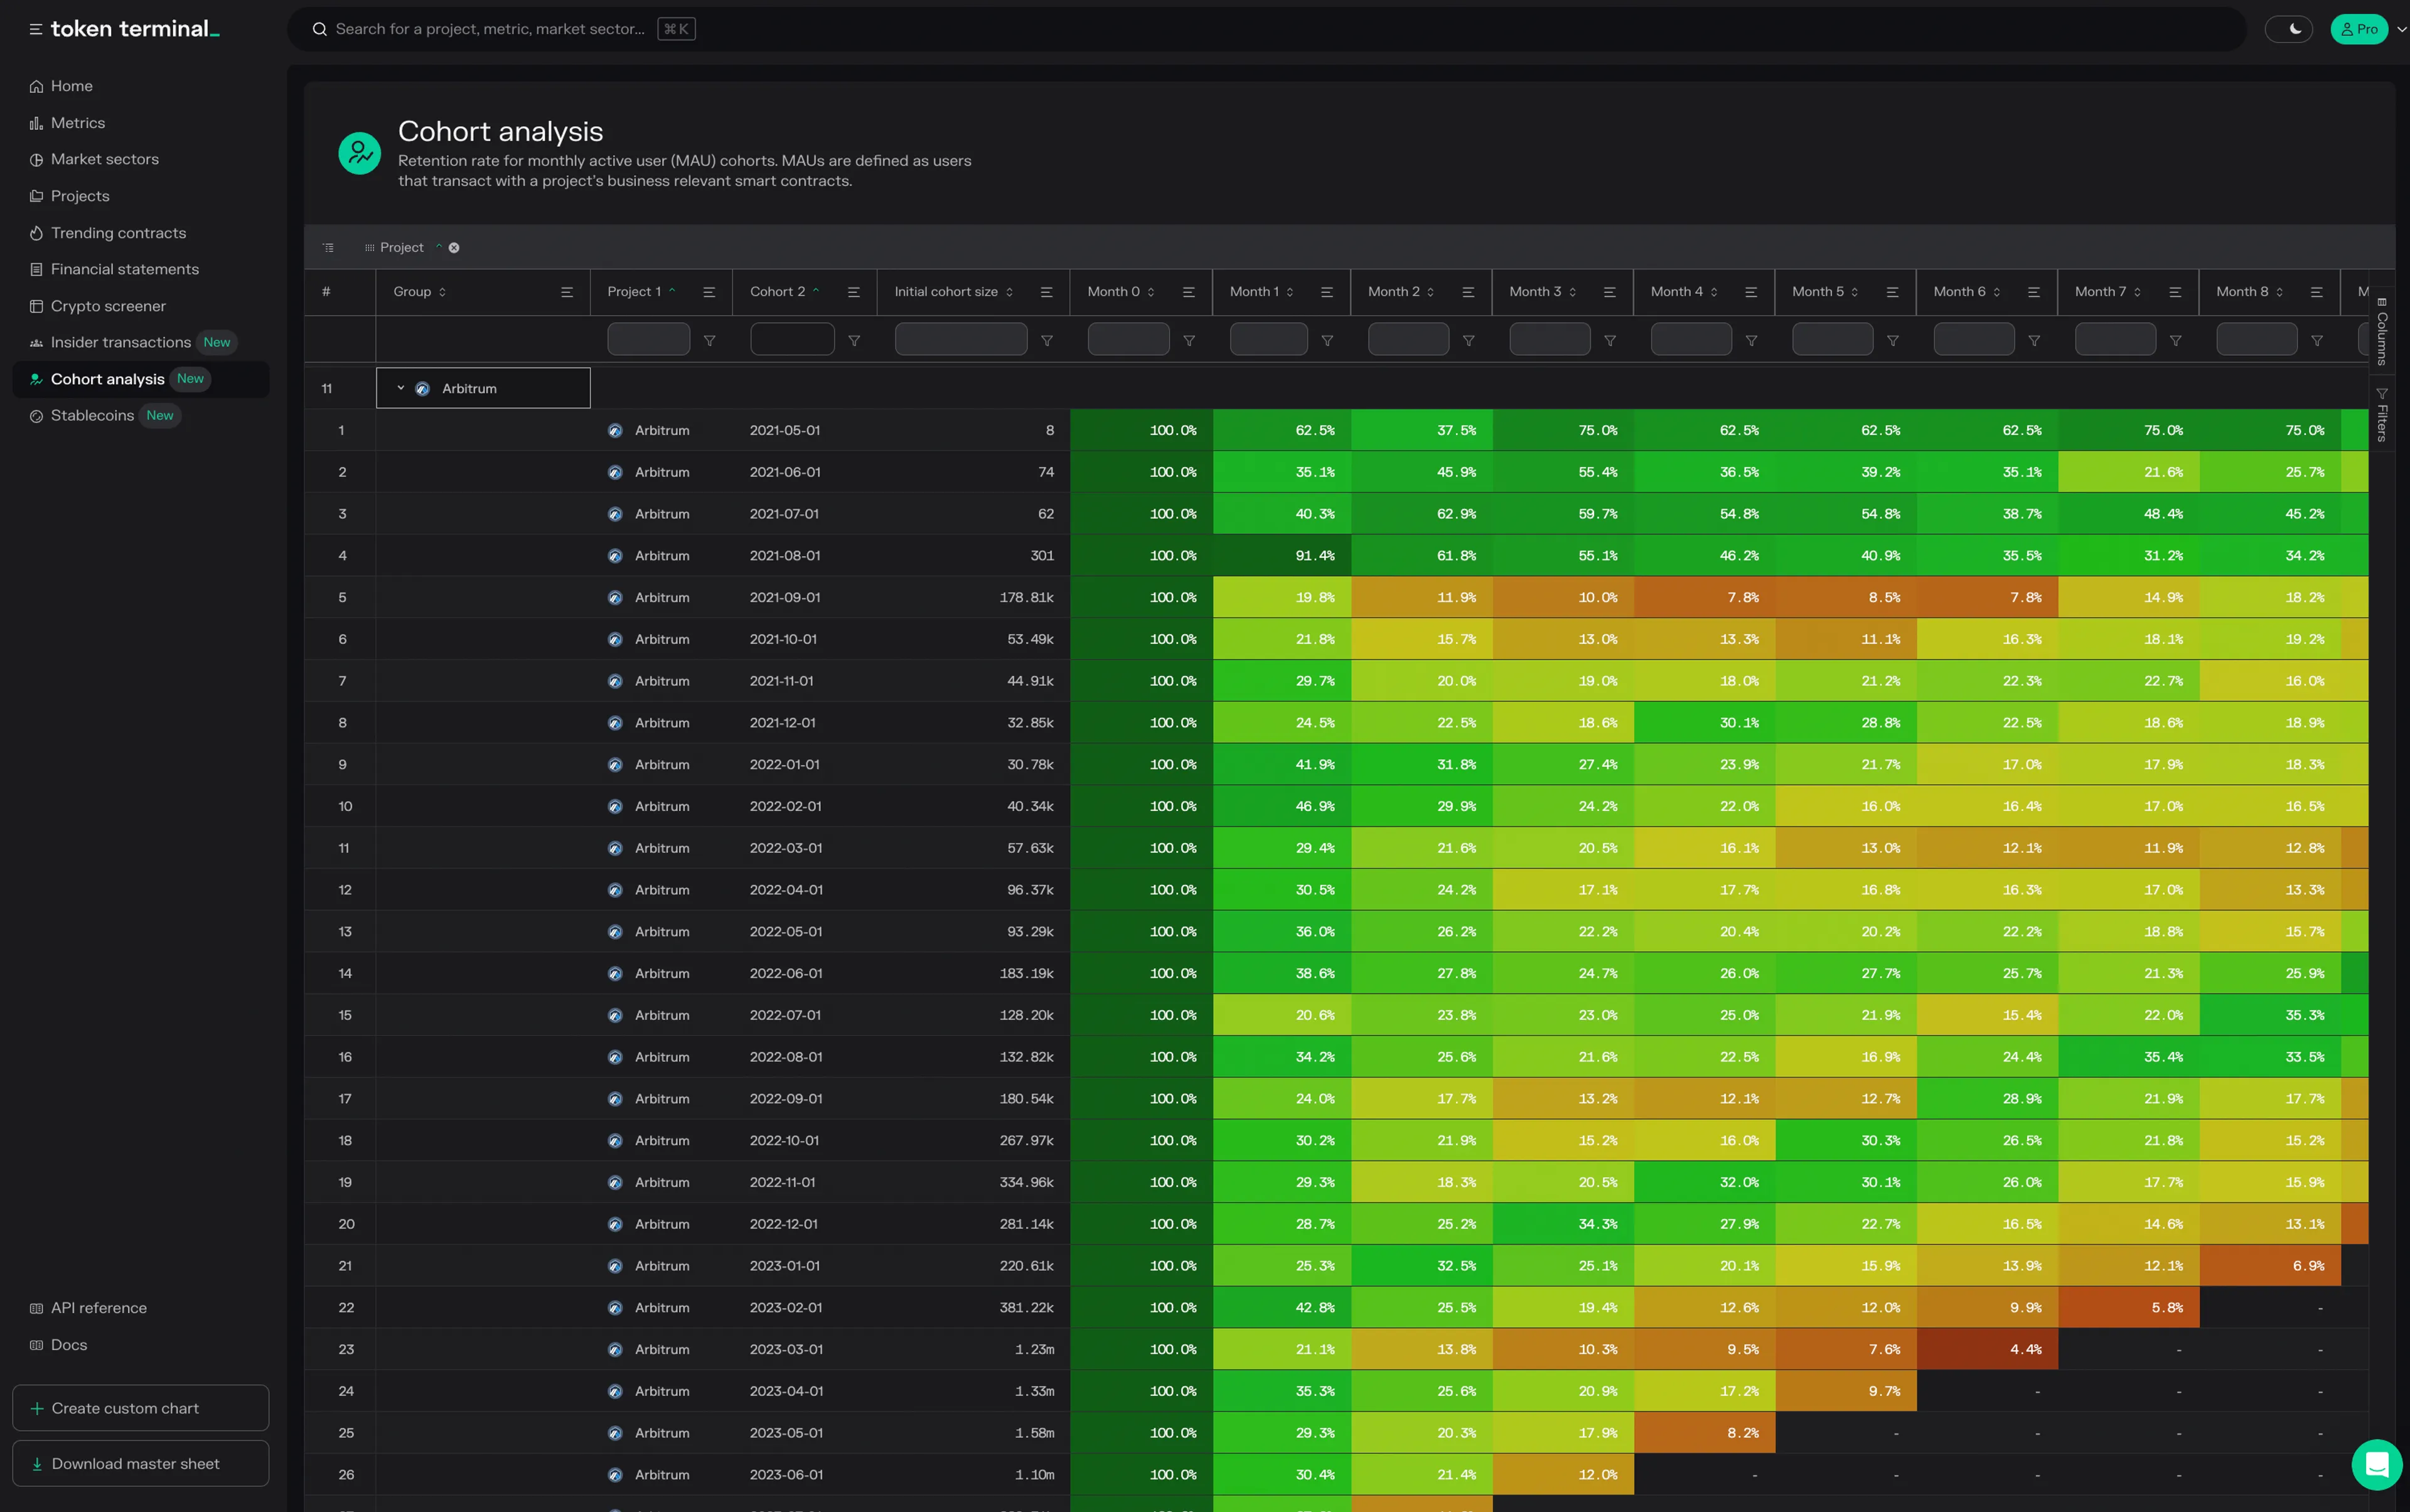
Cohort analysis
What does this data table show: Number of first time users for each month and the retention rate for all projects with active user data on Token Terminal.
How it is calculated: We track the number of first time users for each month and the portion of them that have been an active user in the n:th subsequent month.
Why do we show it: Using the data table you are able to get an overview of the number of first time users and retention rates for projects.
Cohort analysis data table: https://tokenterminal.com/terminal/cohort-analysis
Updated 2 months ago