
Balancer
In this issue we take a look at Balancer through the lens of traditional financial and business metrics.Note: The ‘DeFi average’ data in the charts is calculated based on all L2 projects currently listed on our site.
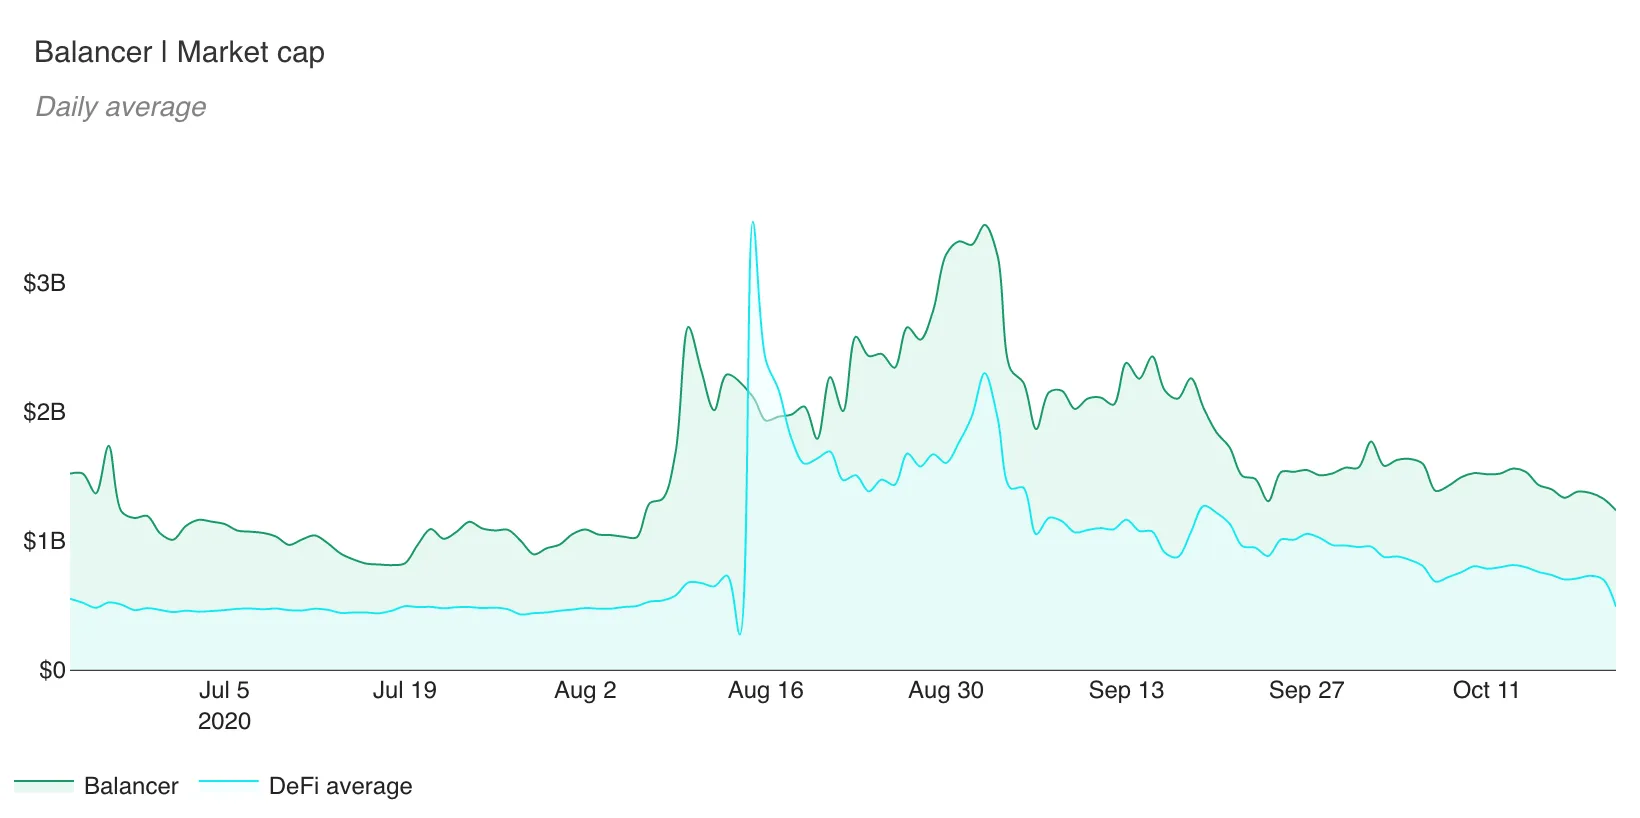
Market cap
What is Balancer valued at?
- Market cap: $1,239,000,000
- 30-day change: -38.30%
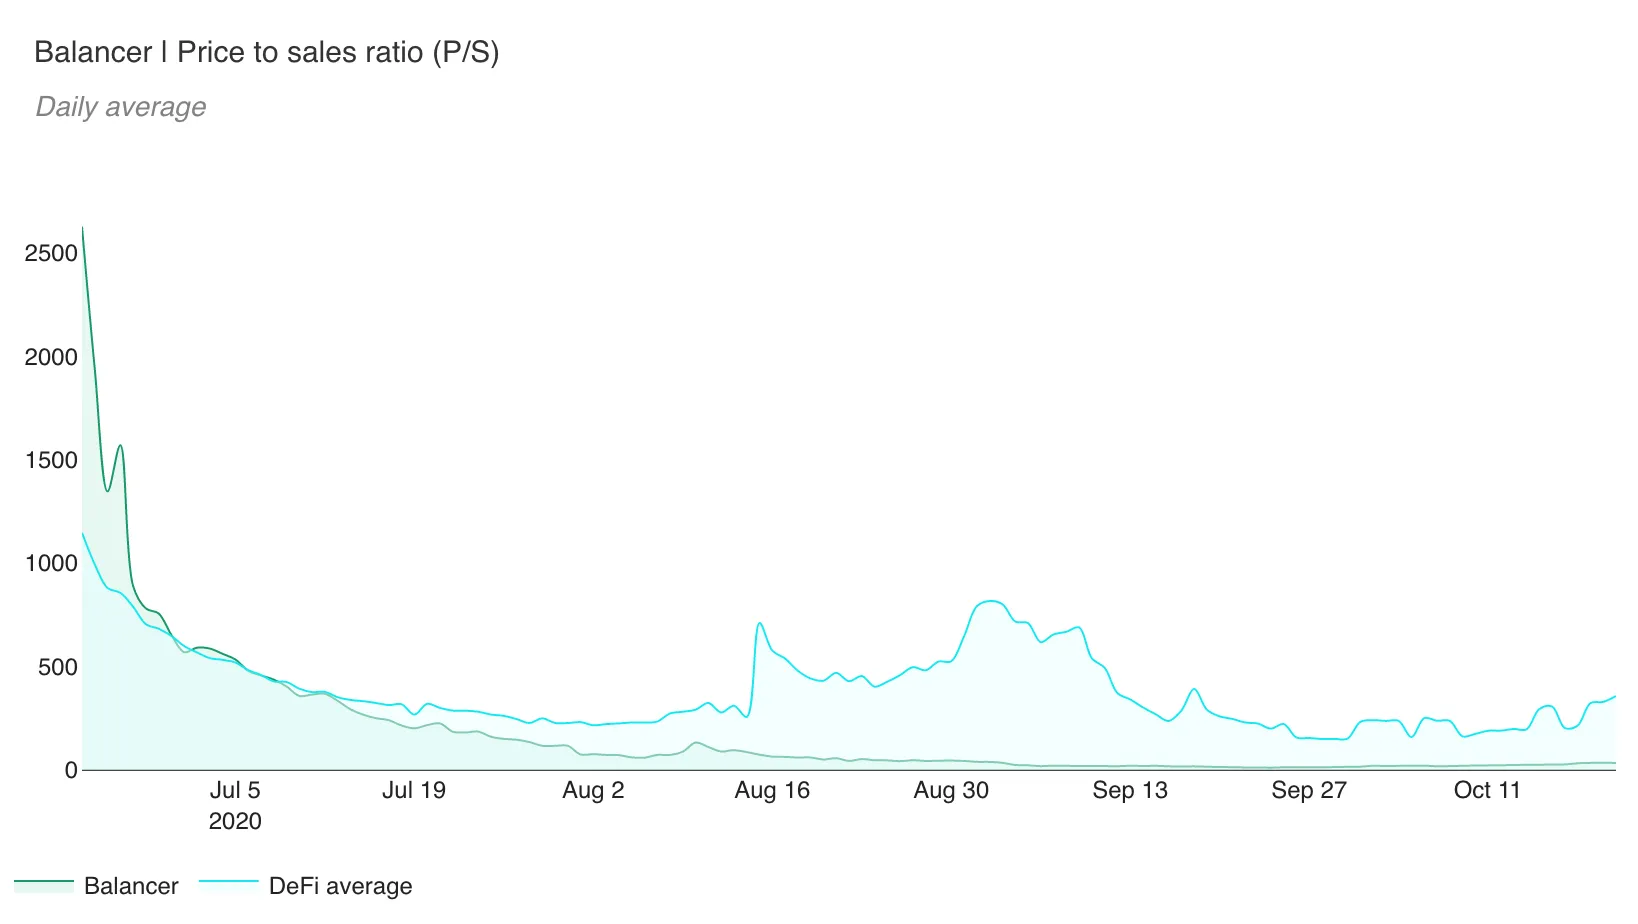
Price to sales ratio (P/S)
How is Balancer valued in relation to its revenues?
- P/S: 34.03x
- 30-day change: -27.71%
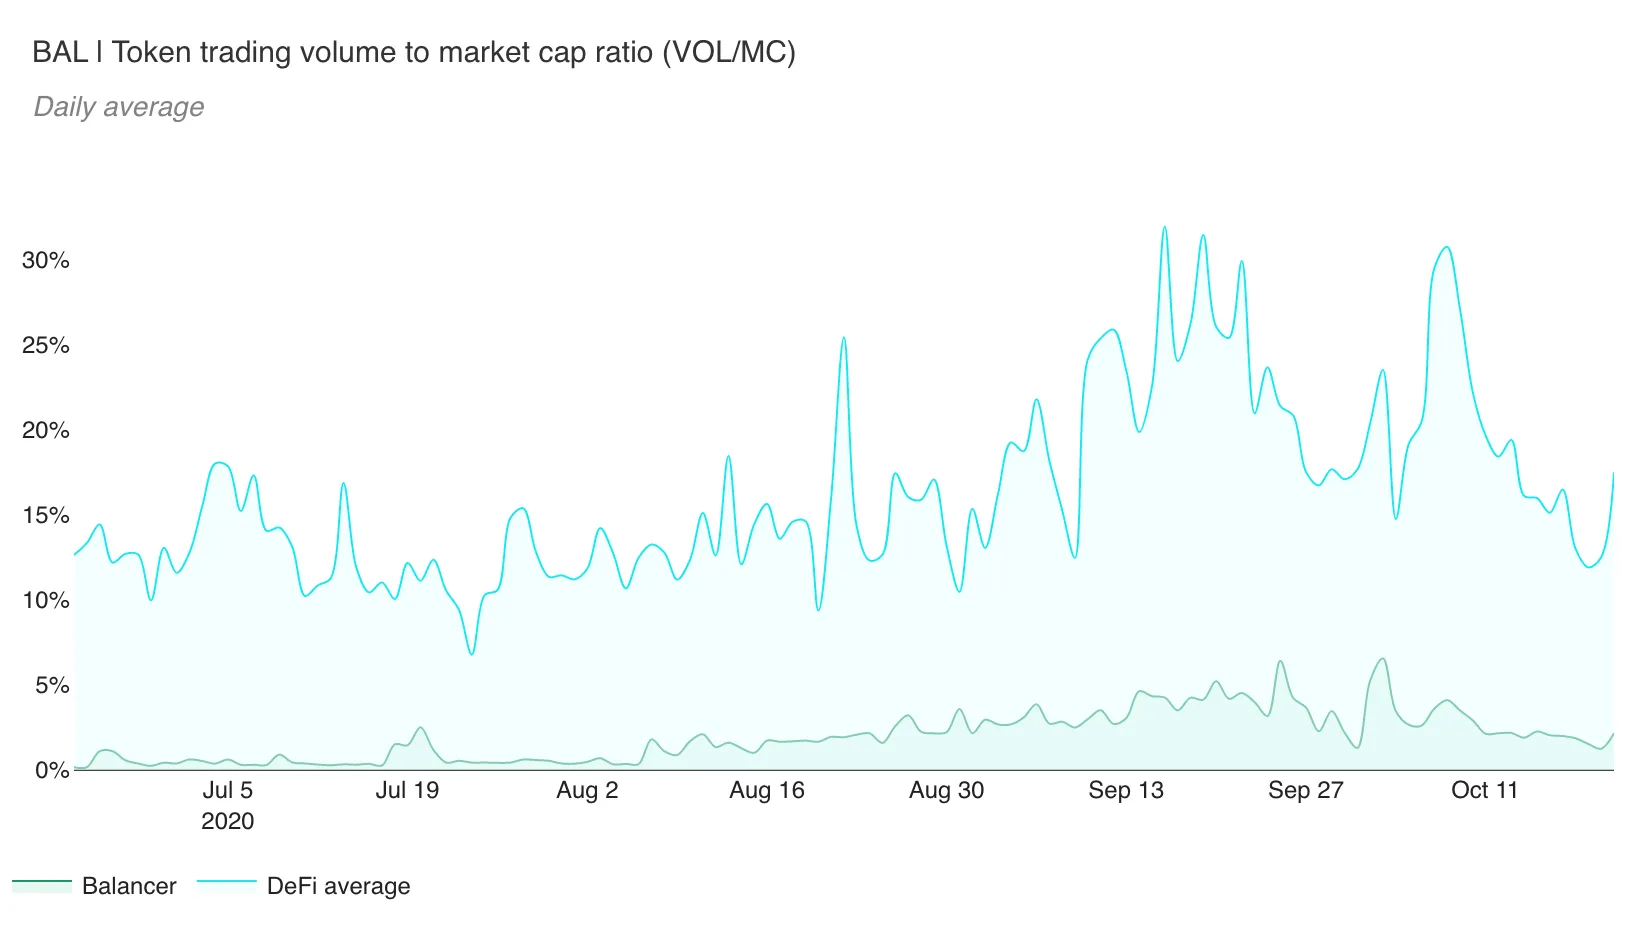
Token trading vol. to market cap ratio (VOL/MC)
How reliable is the BAL token's price discovery?
- VOL/MC: 1.58%
- 30-day change: -2.93%
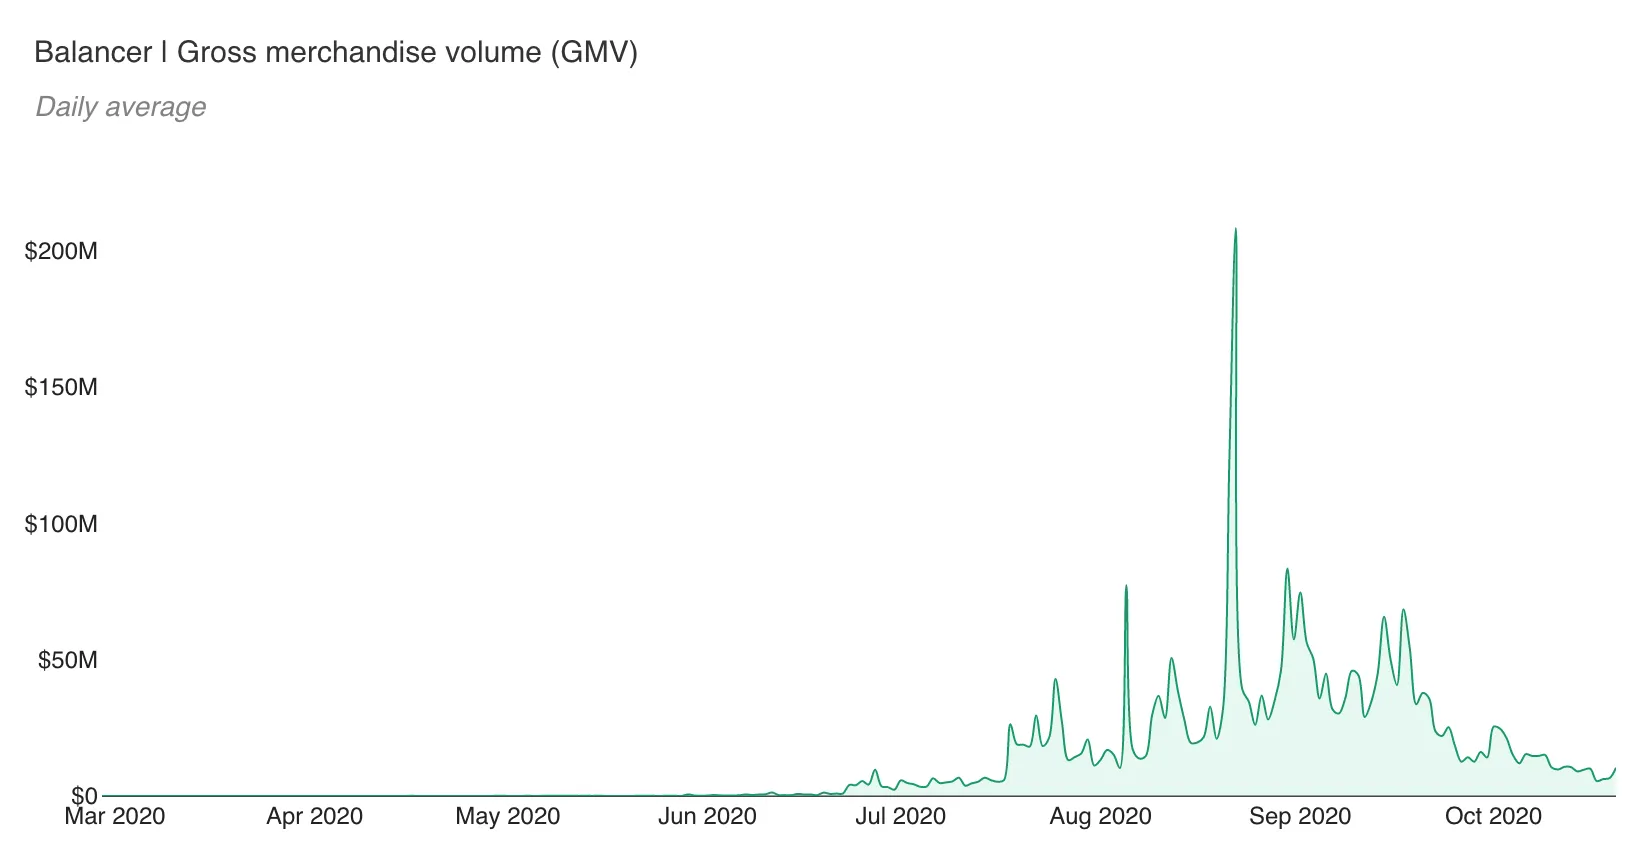
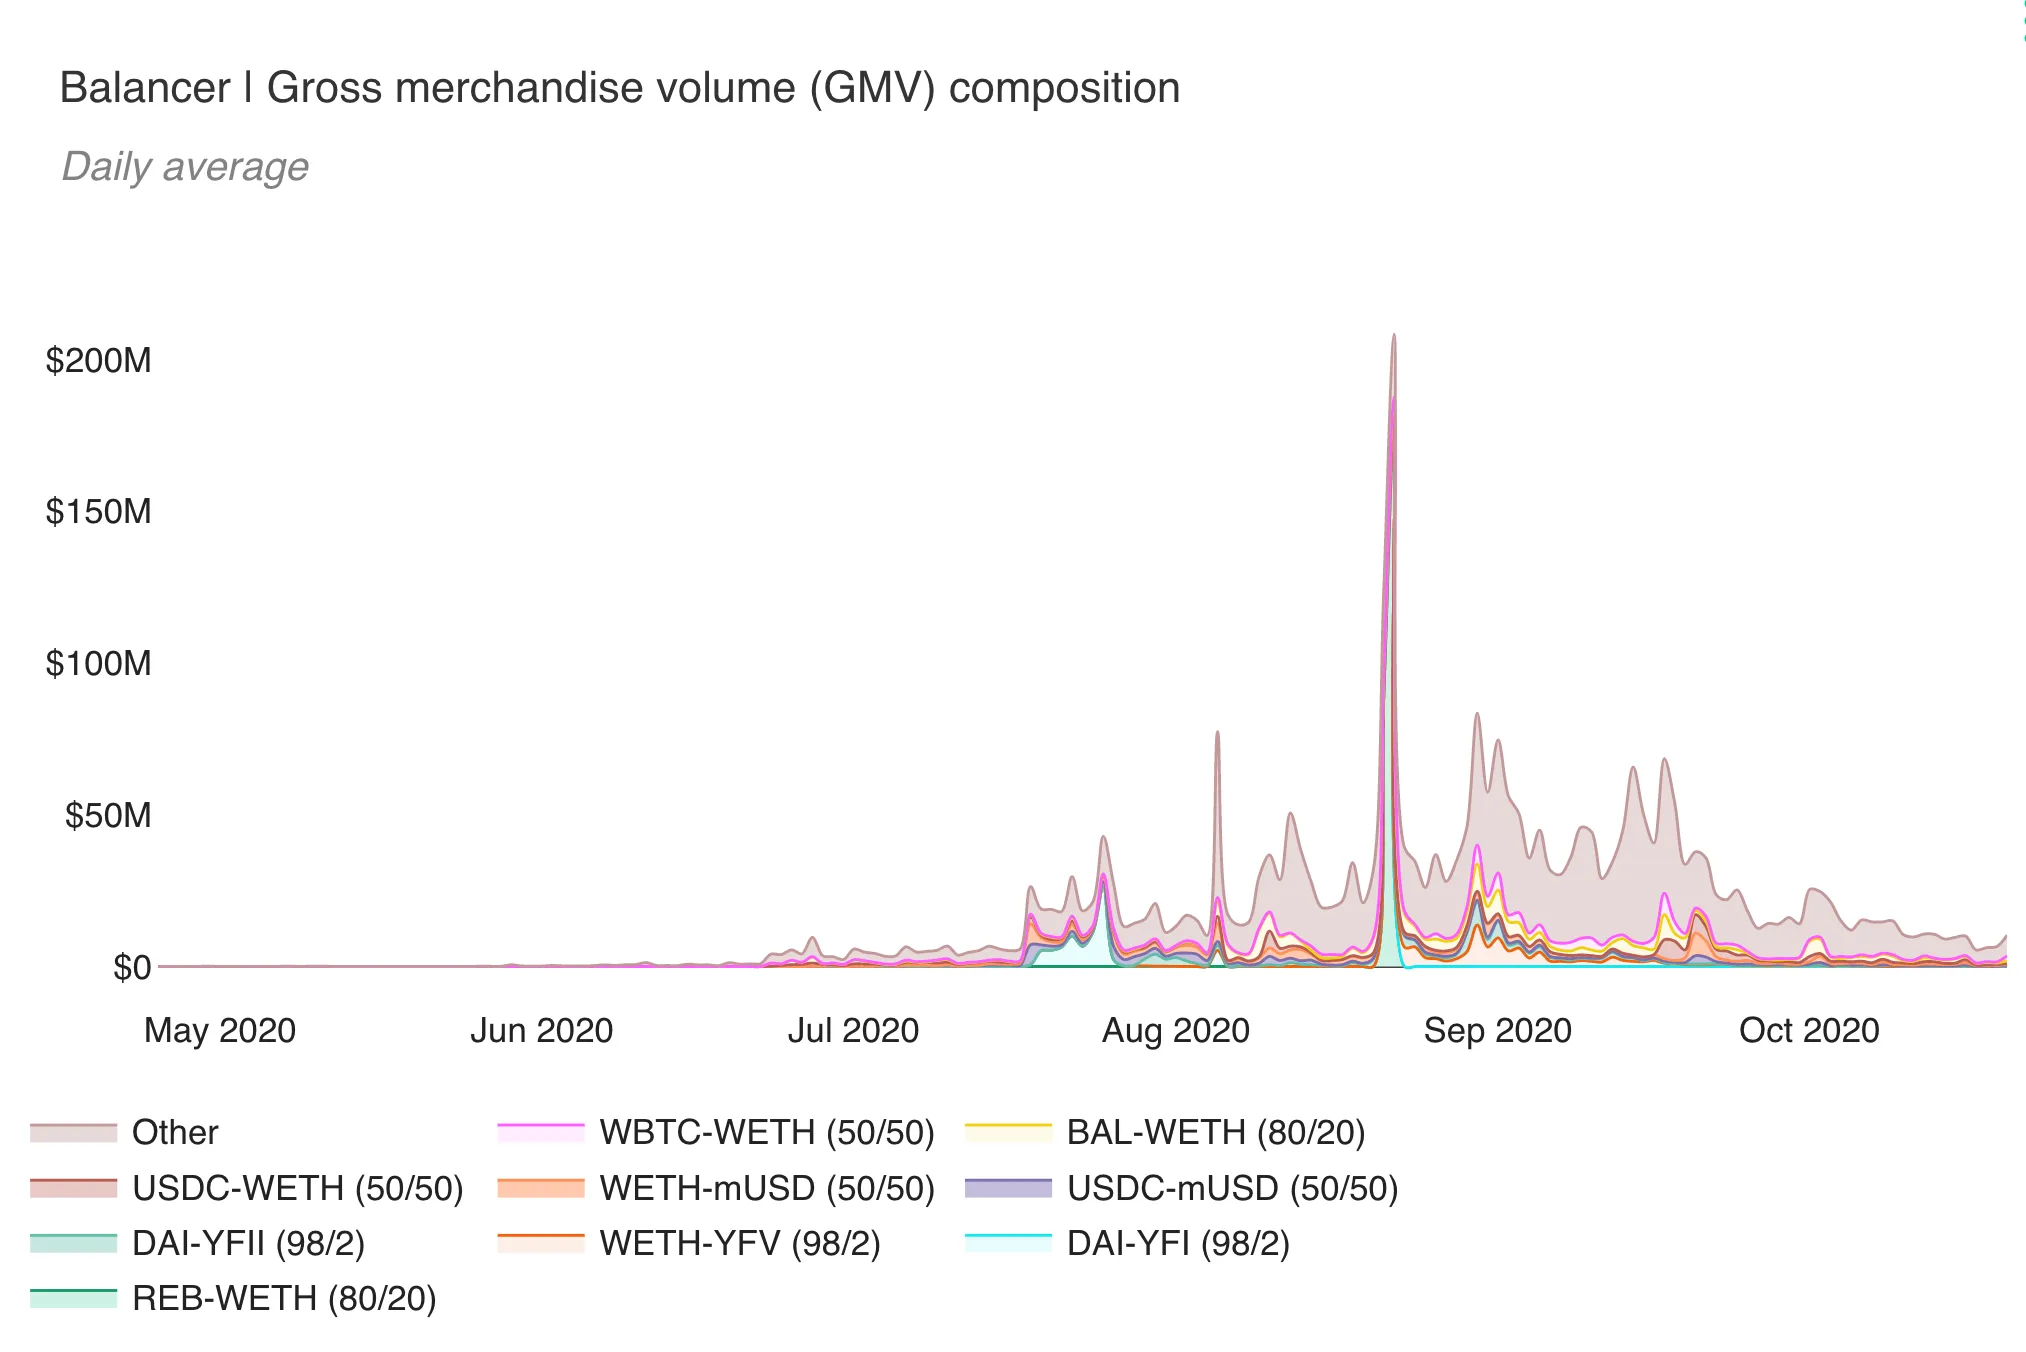
Gross merchandise volume (GMV)
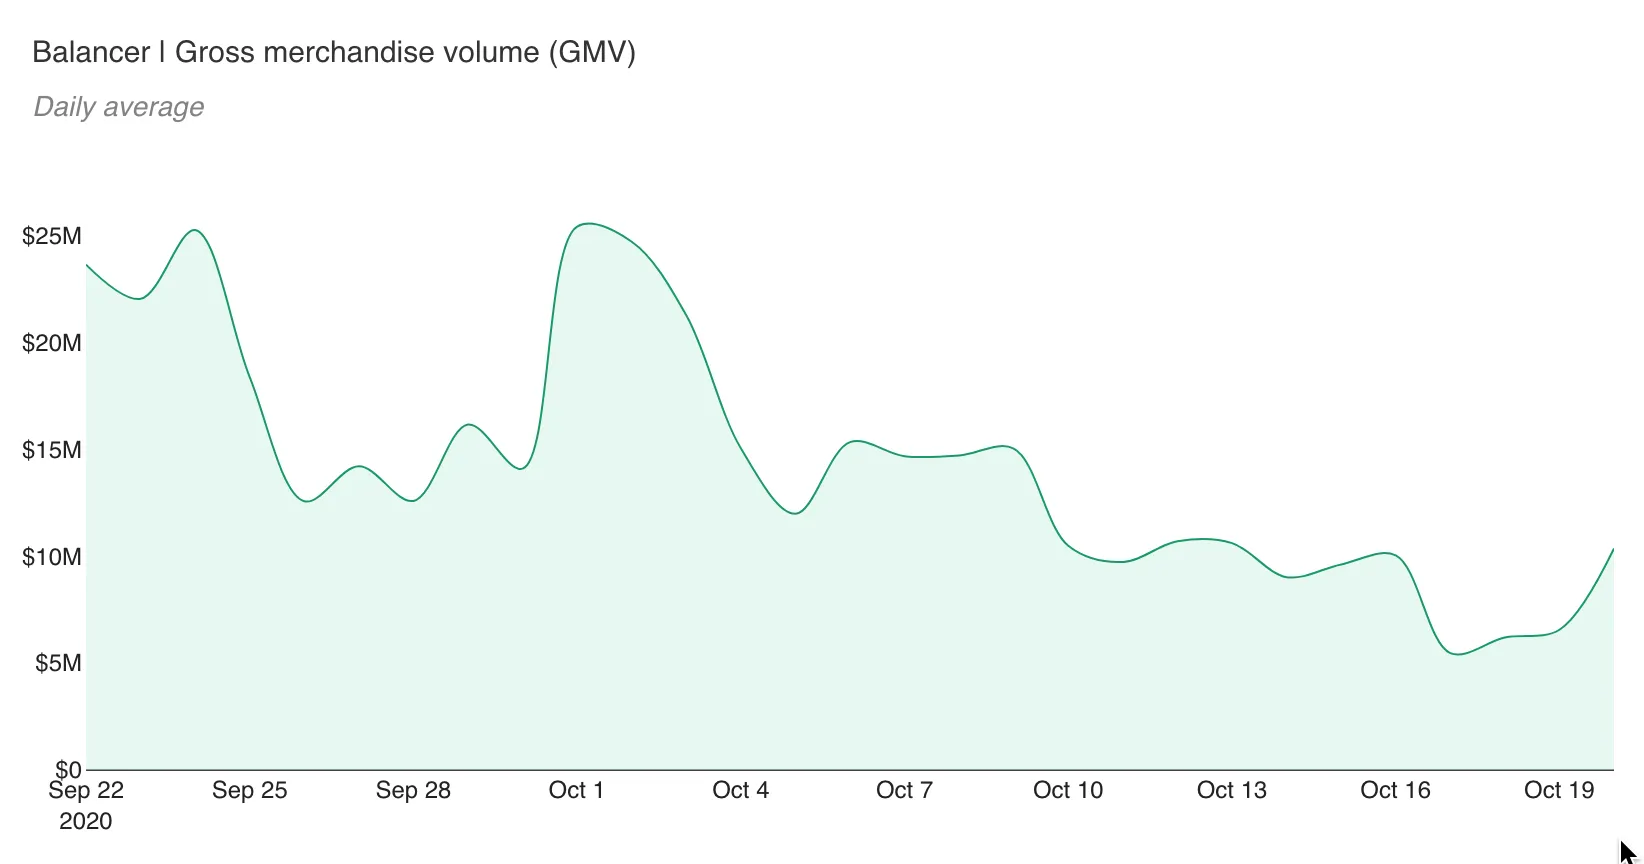
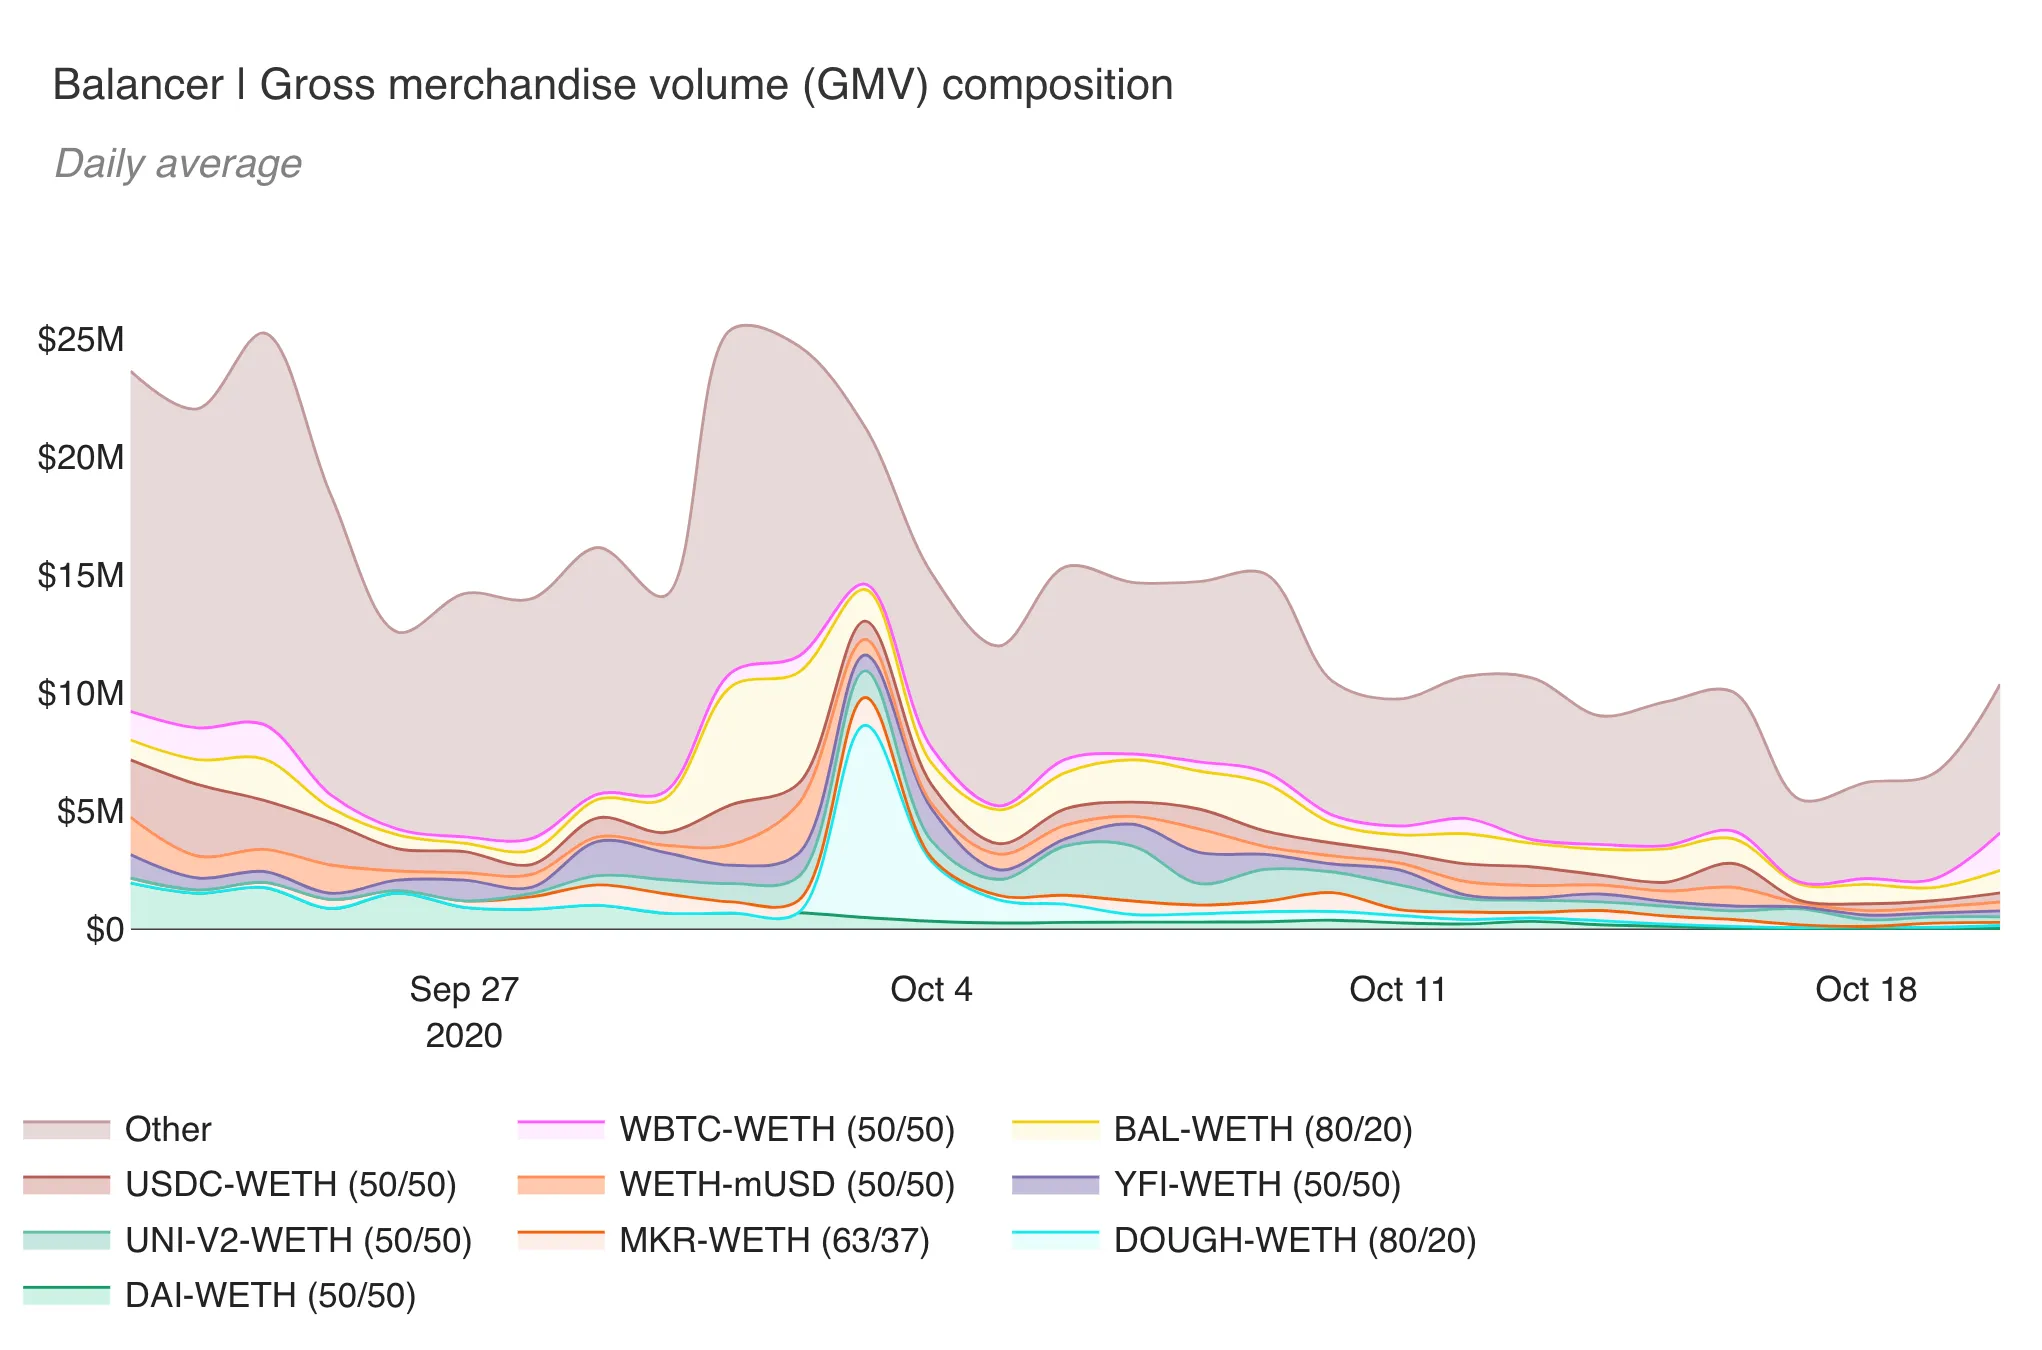
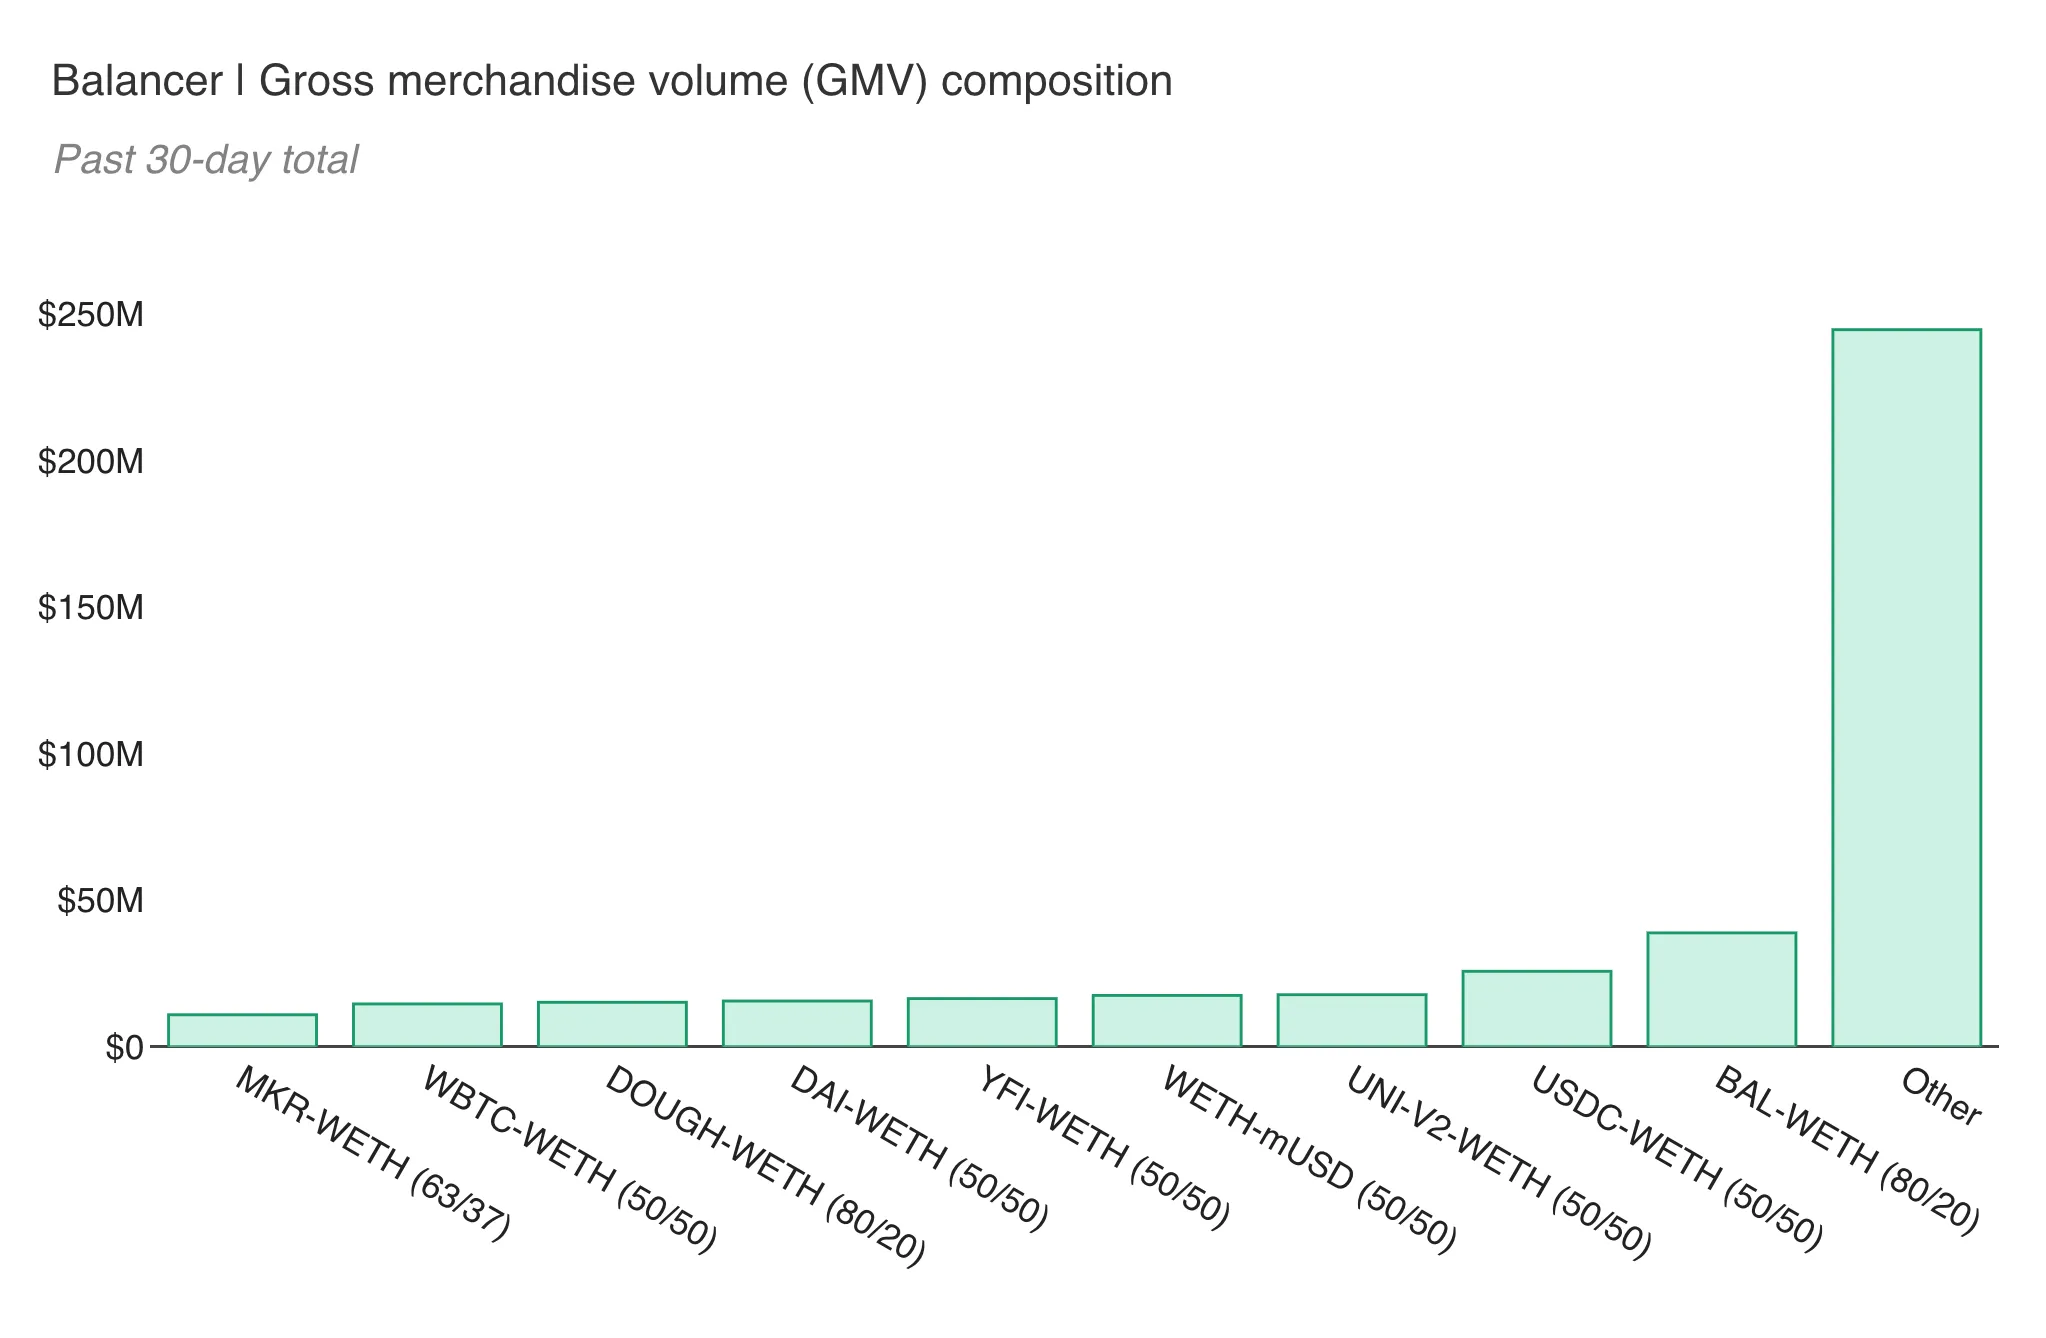
What is the total trading volume on Balancer?
- Past 30-day total GMV: $419,047,517
- 30-day change: -68.51%
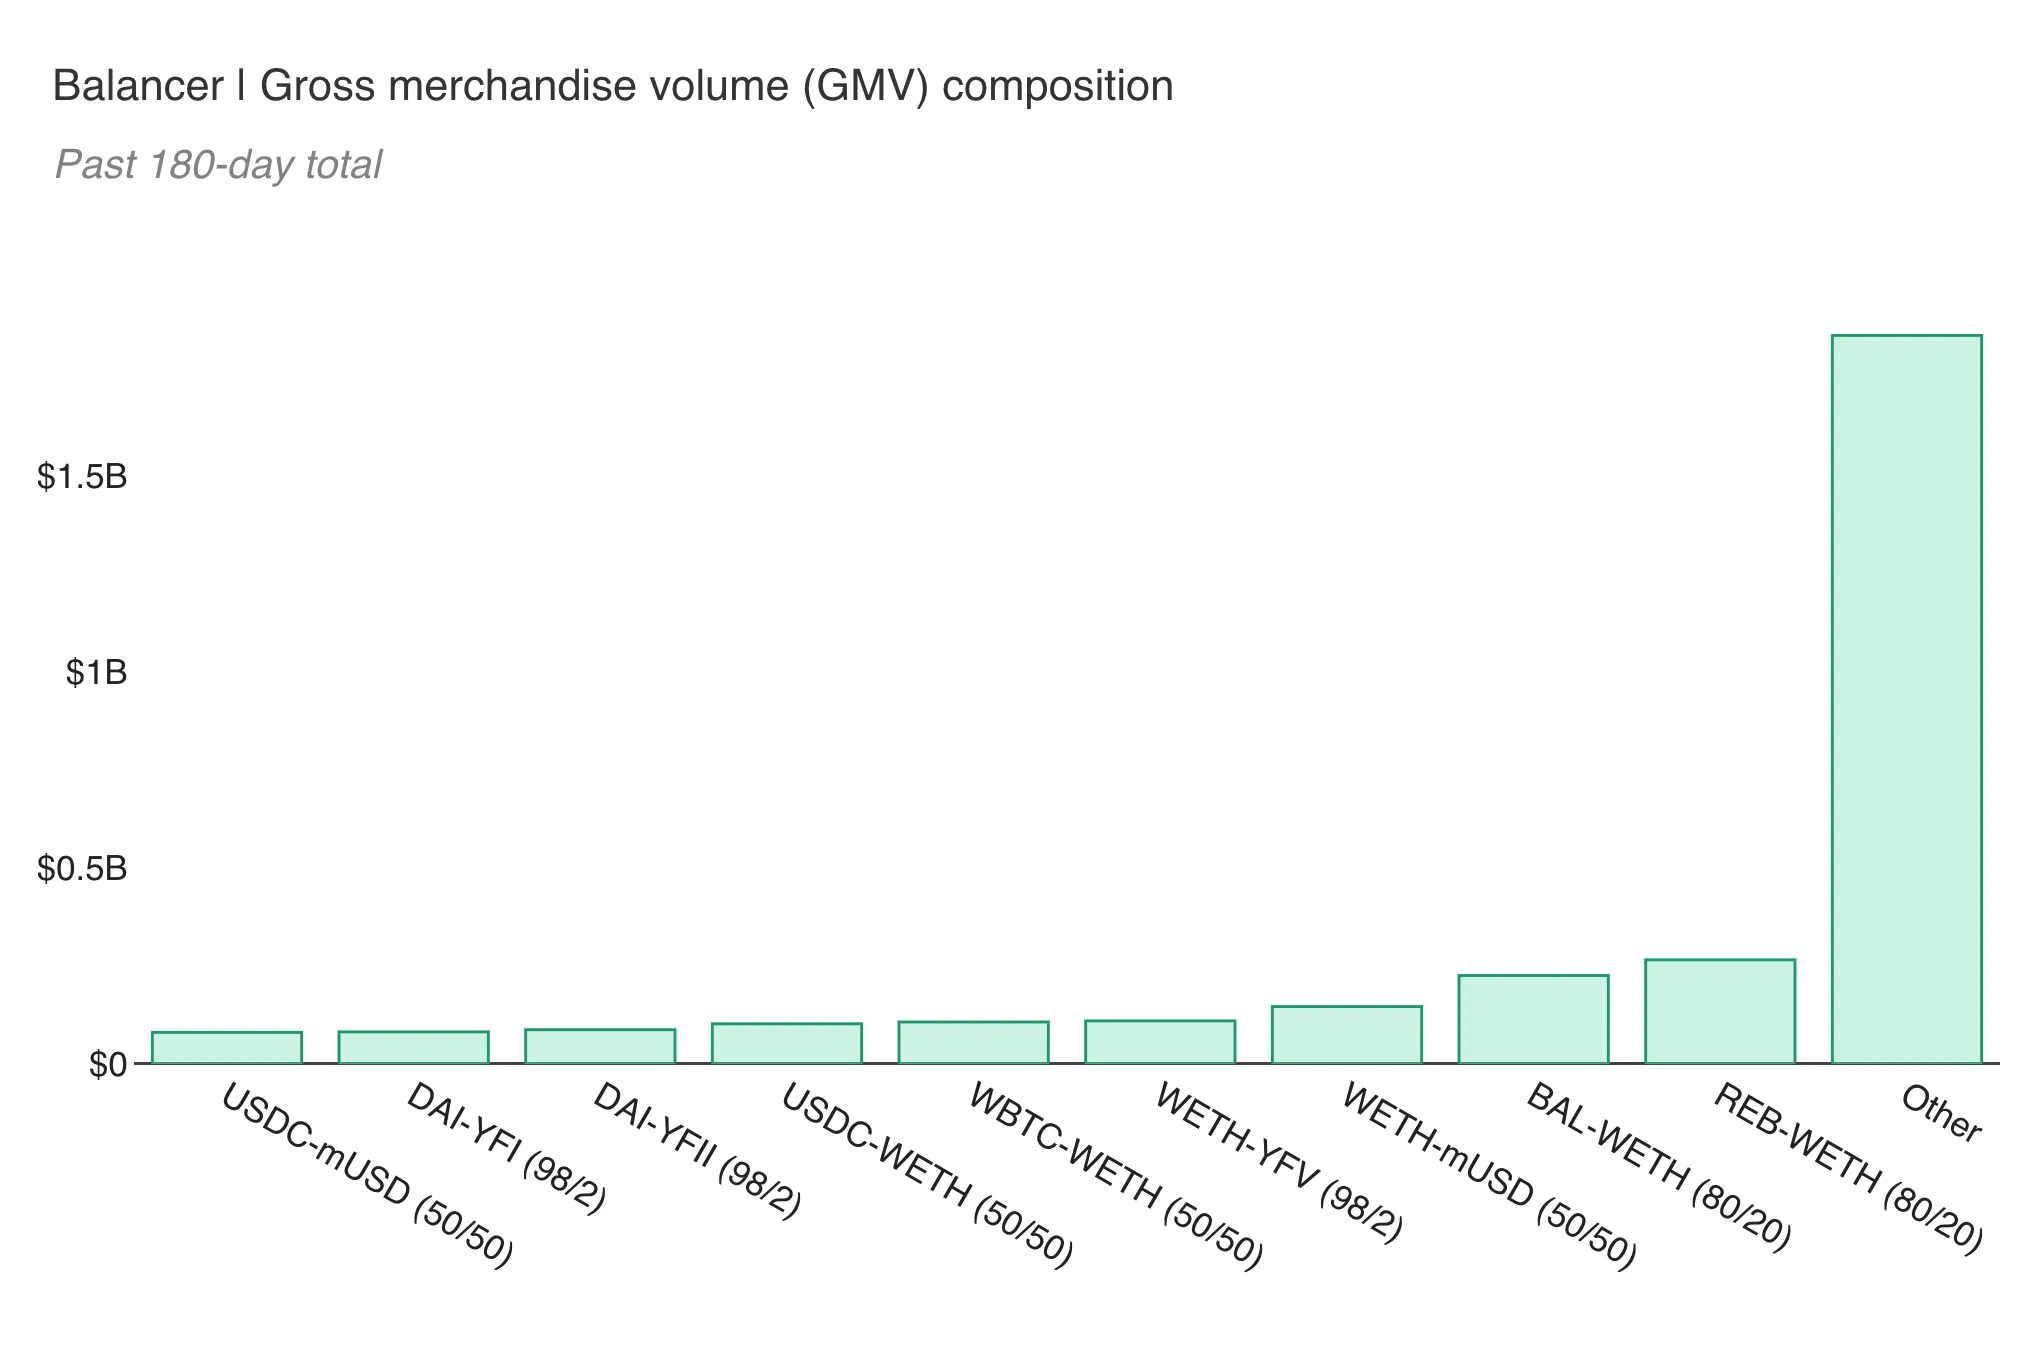
GMV past 180 days:
- Past 180-day total GMV: $3,053,361,205
- 180-day compounded monthly growth rate (CMGR): +210.02%
Revenue
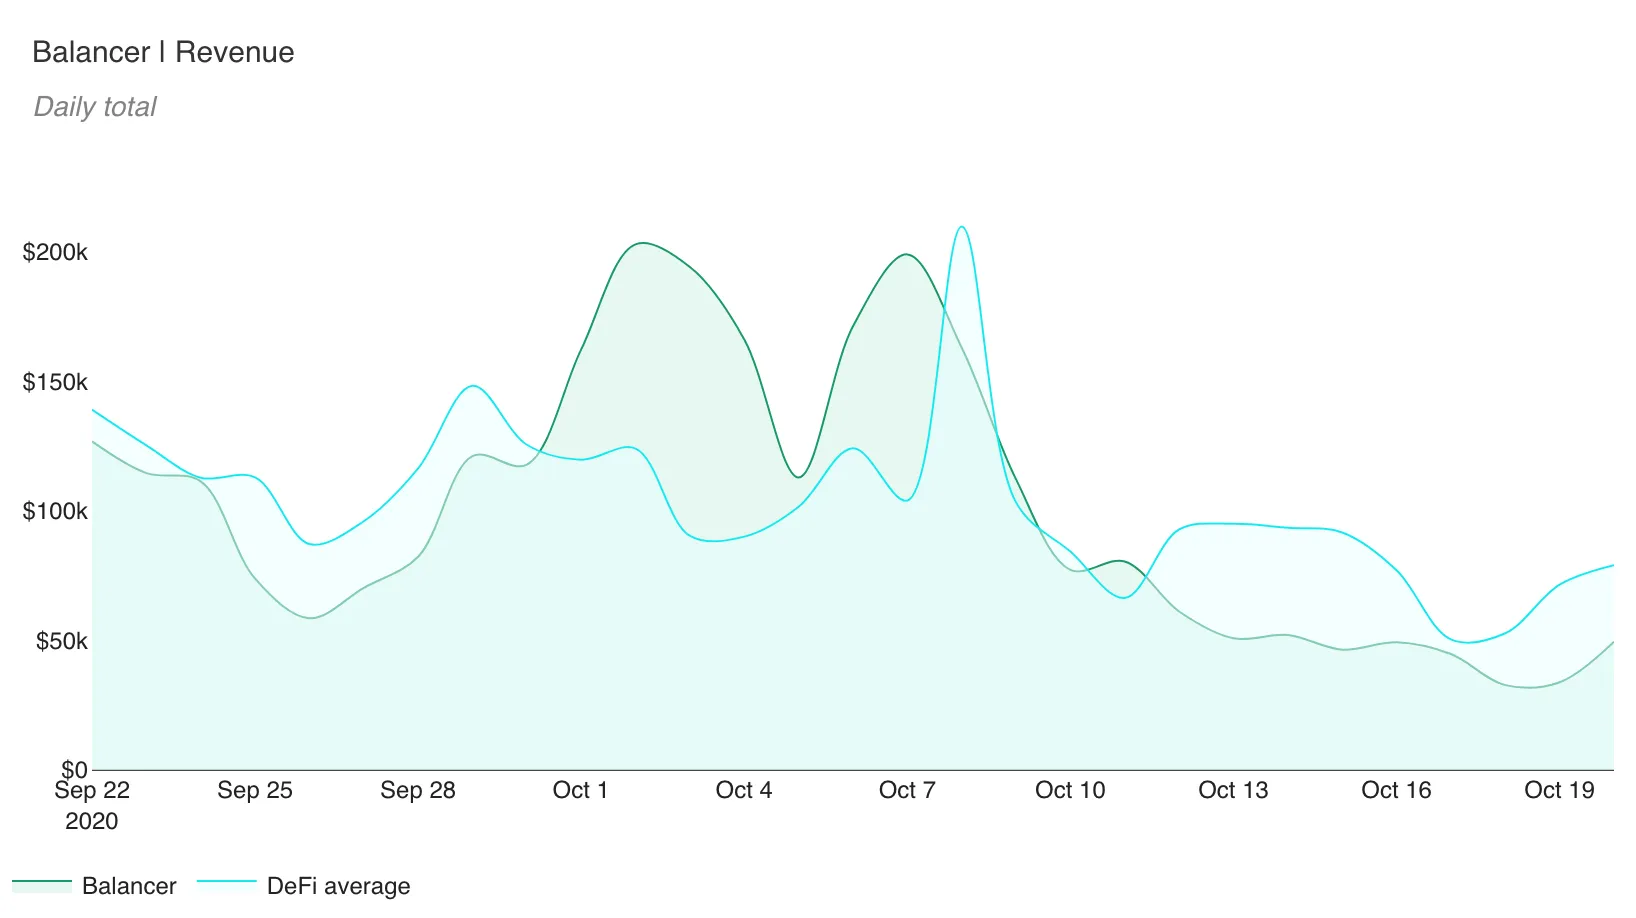
What are the total trading fees paid on Balancer?
- Past 30-day total revenue: $2,953,651
- 30-day change: -70.91%
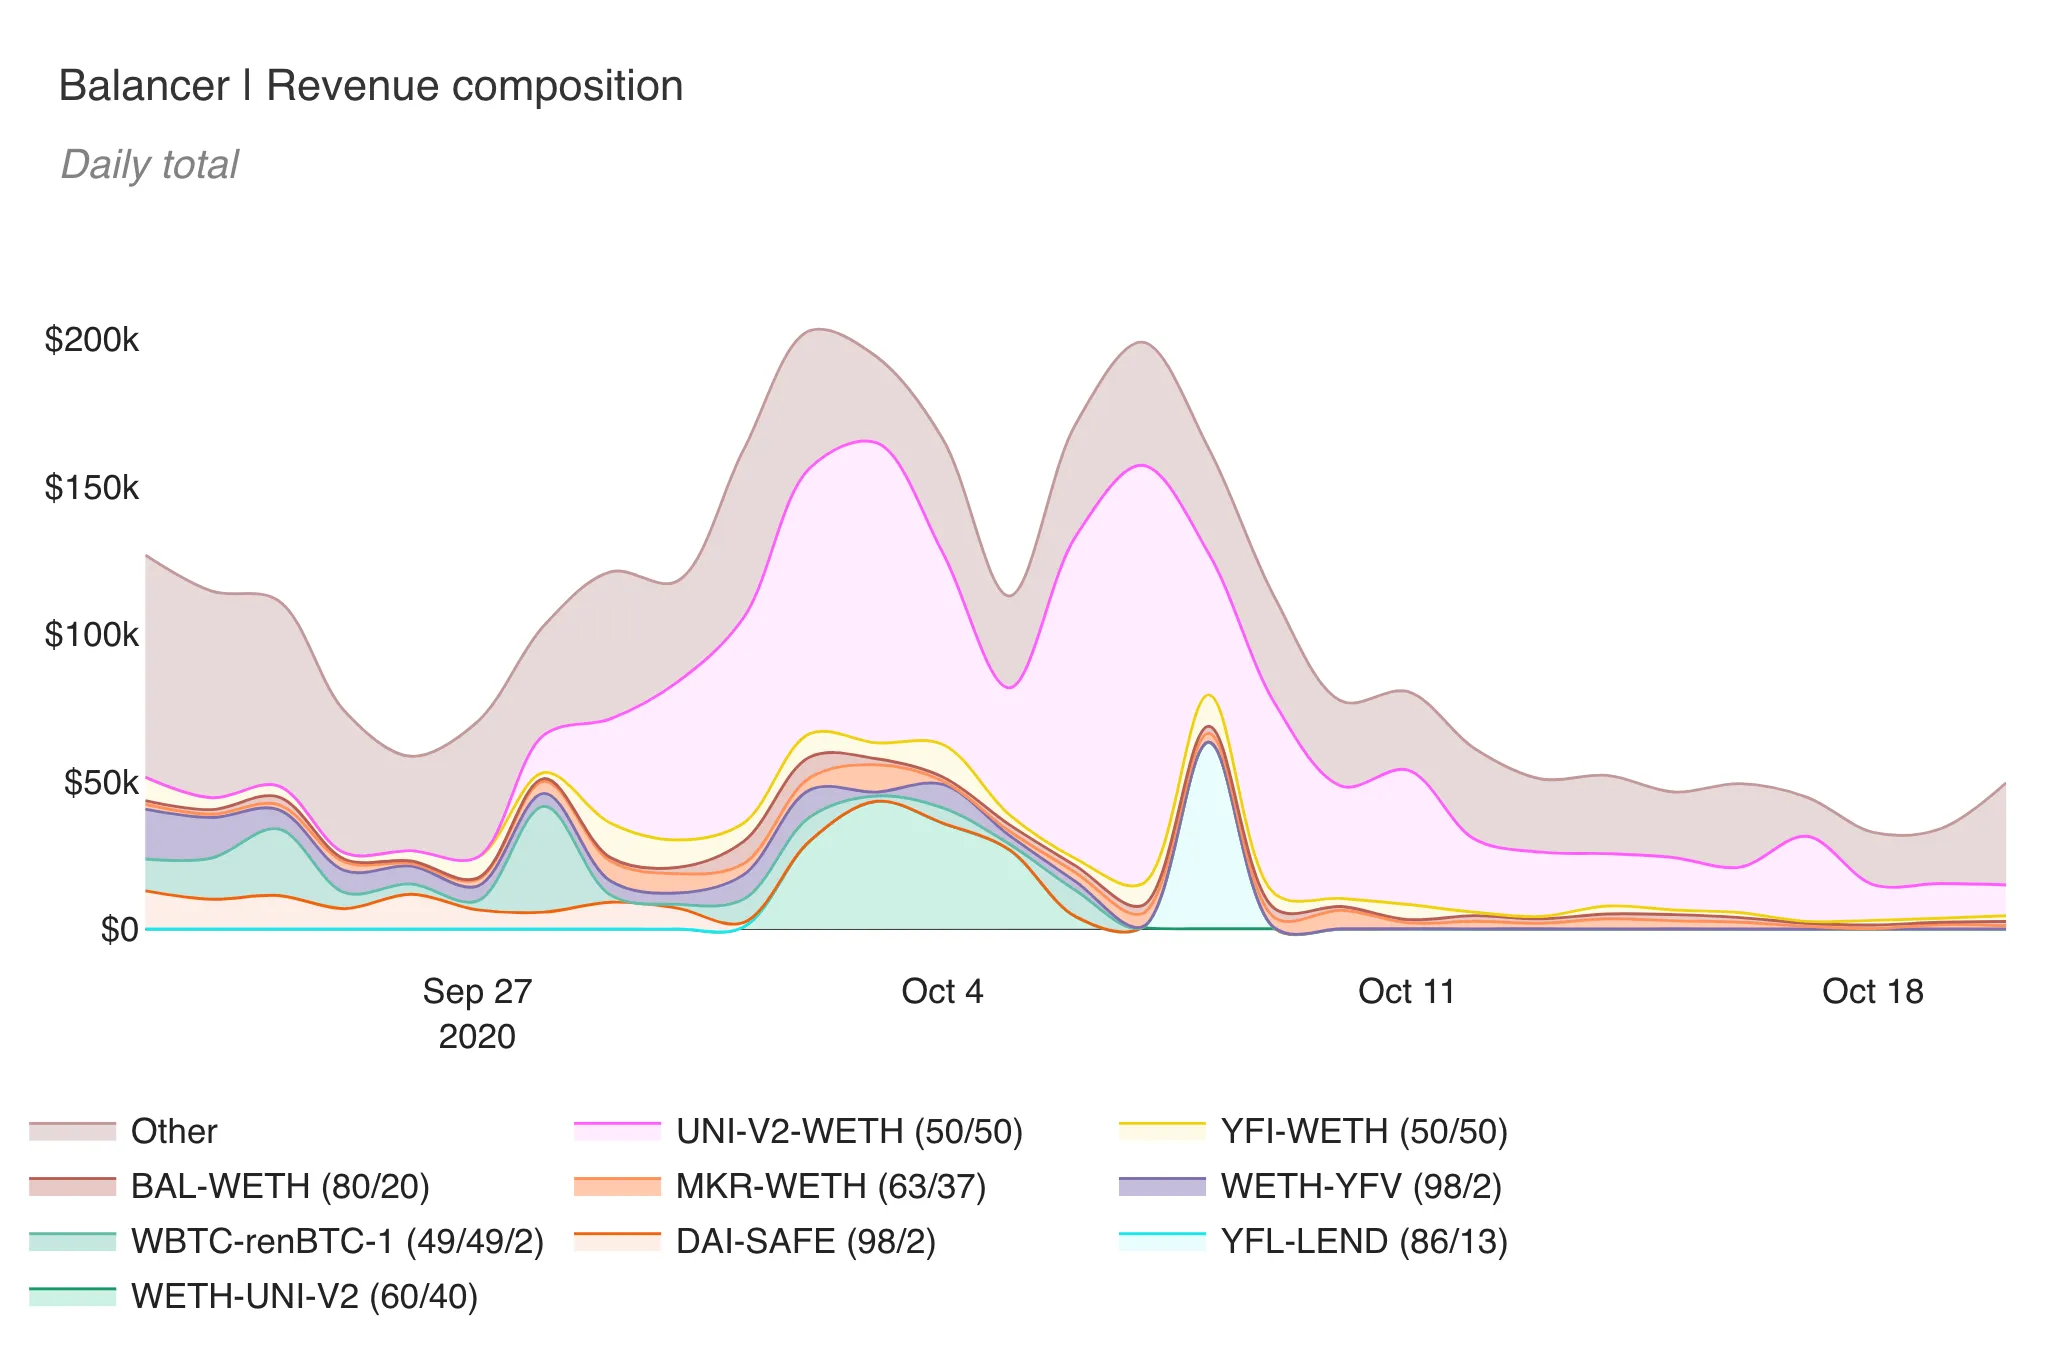
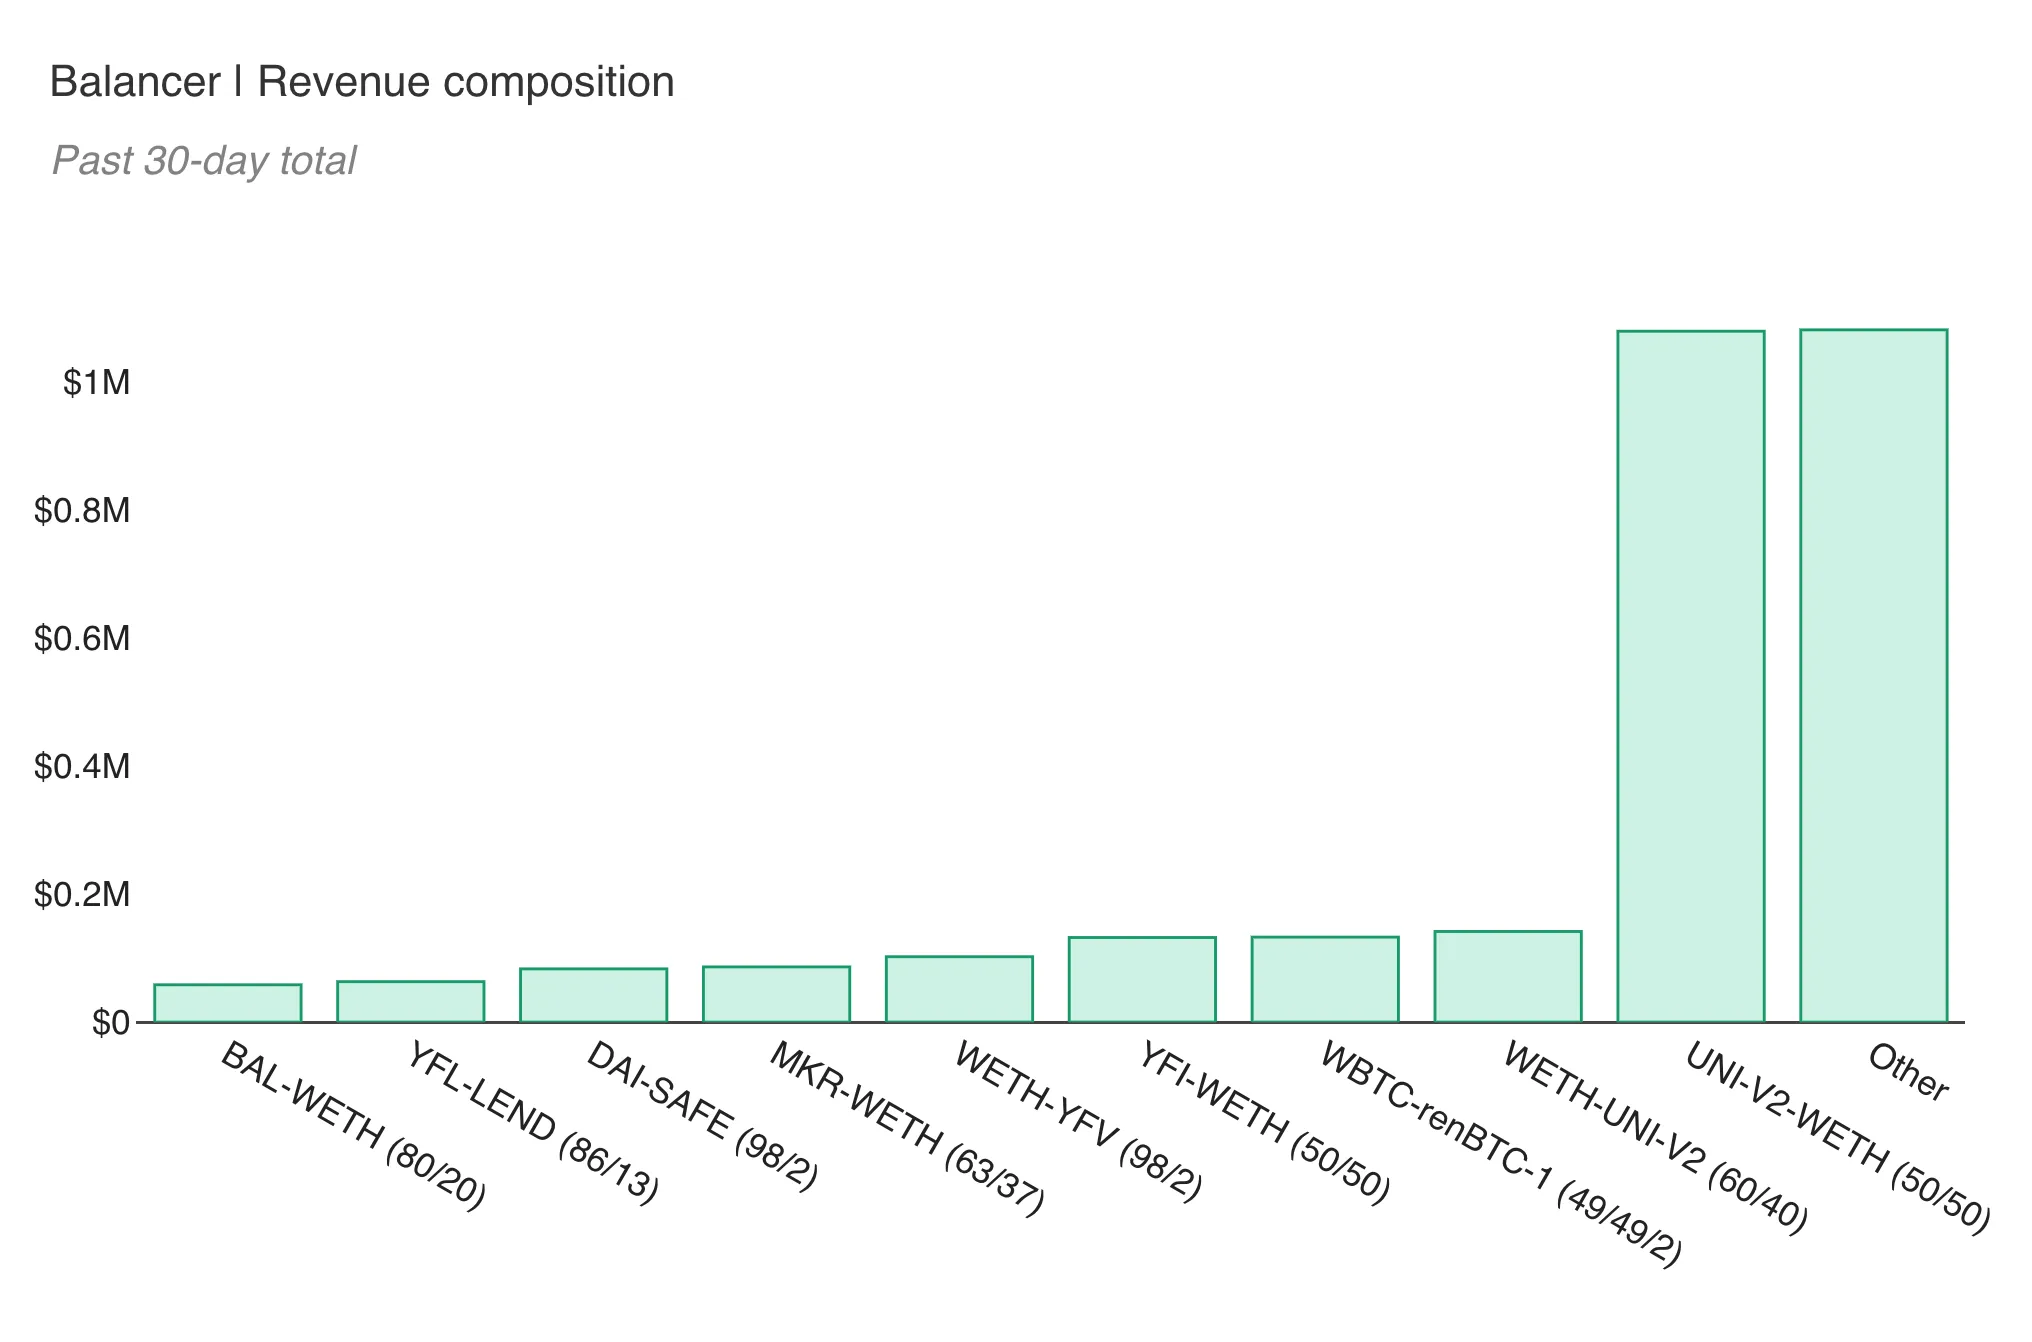
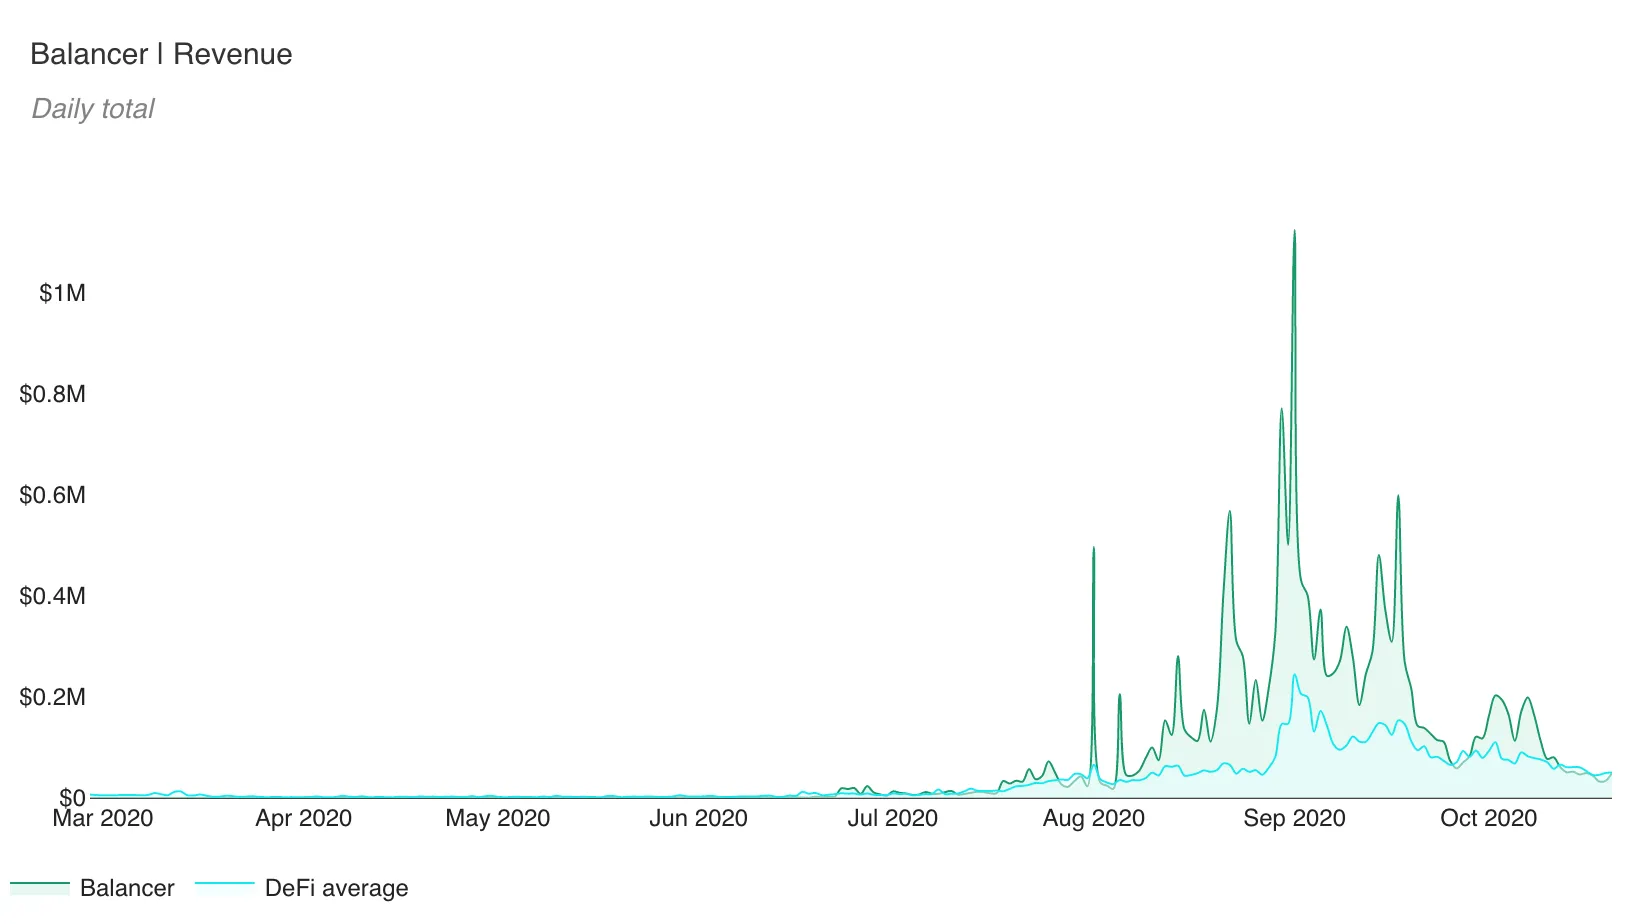
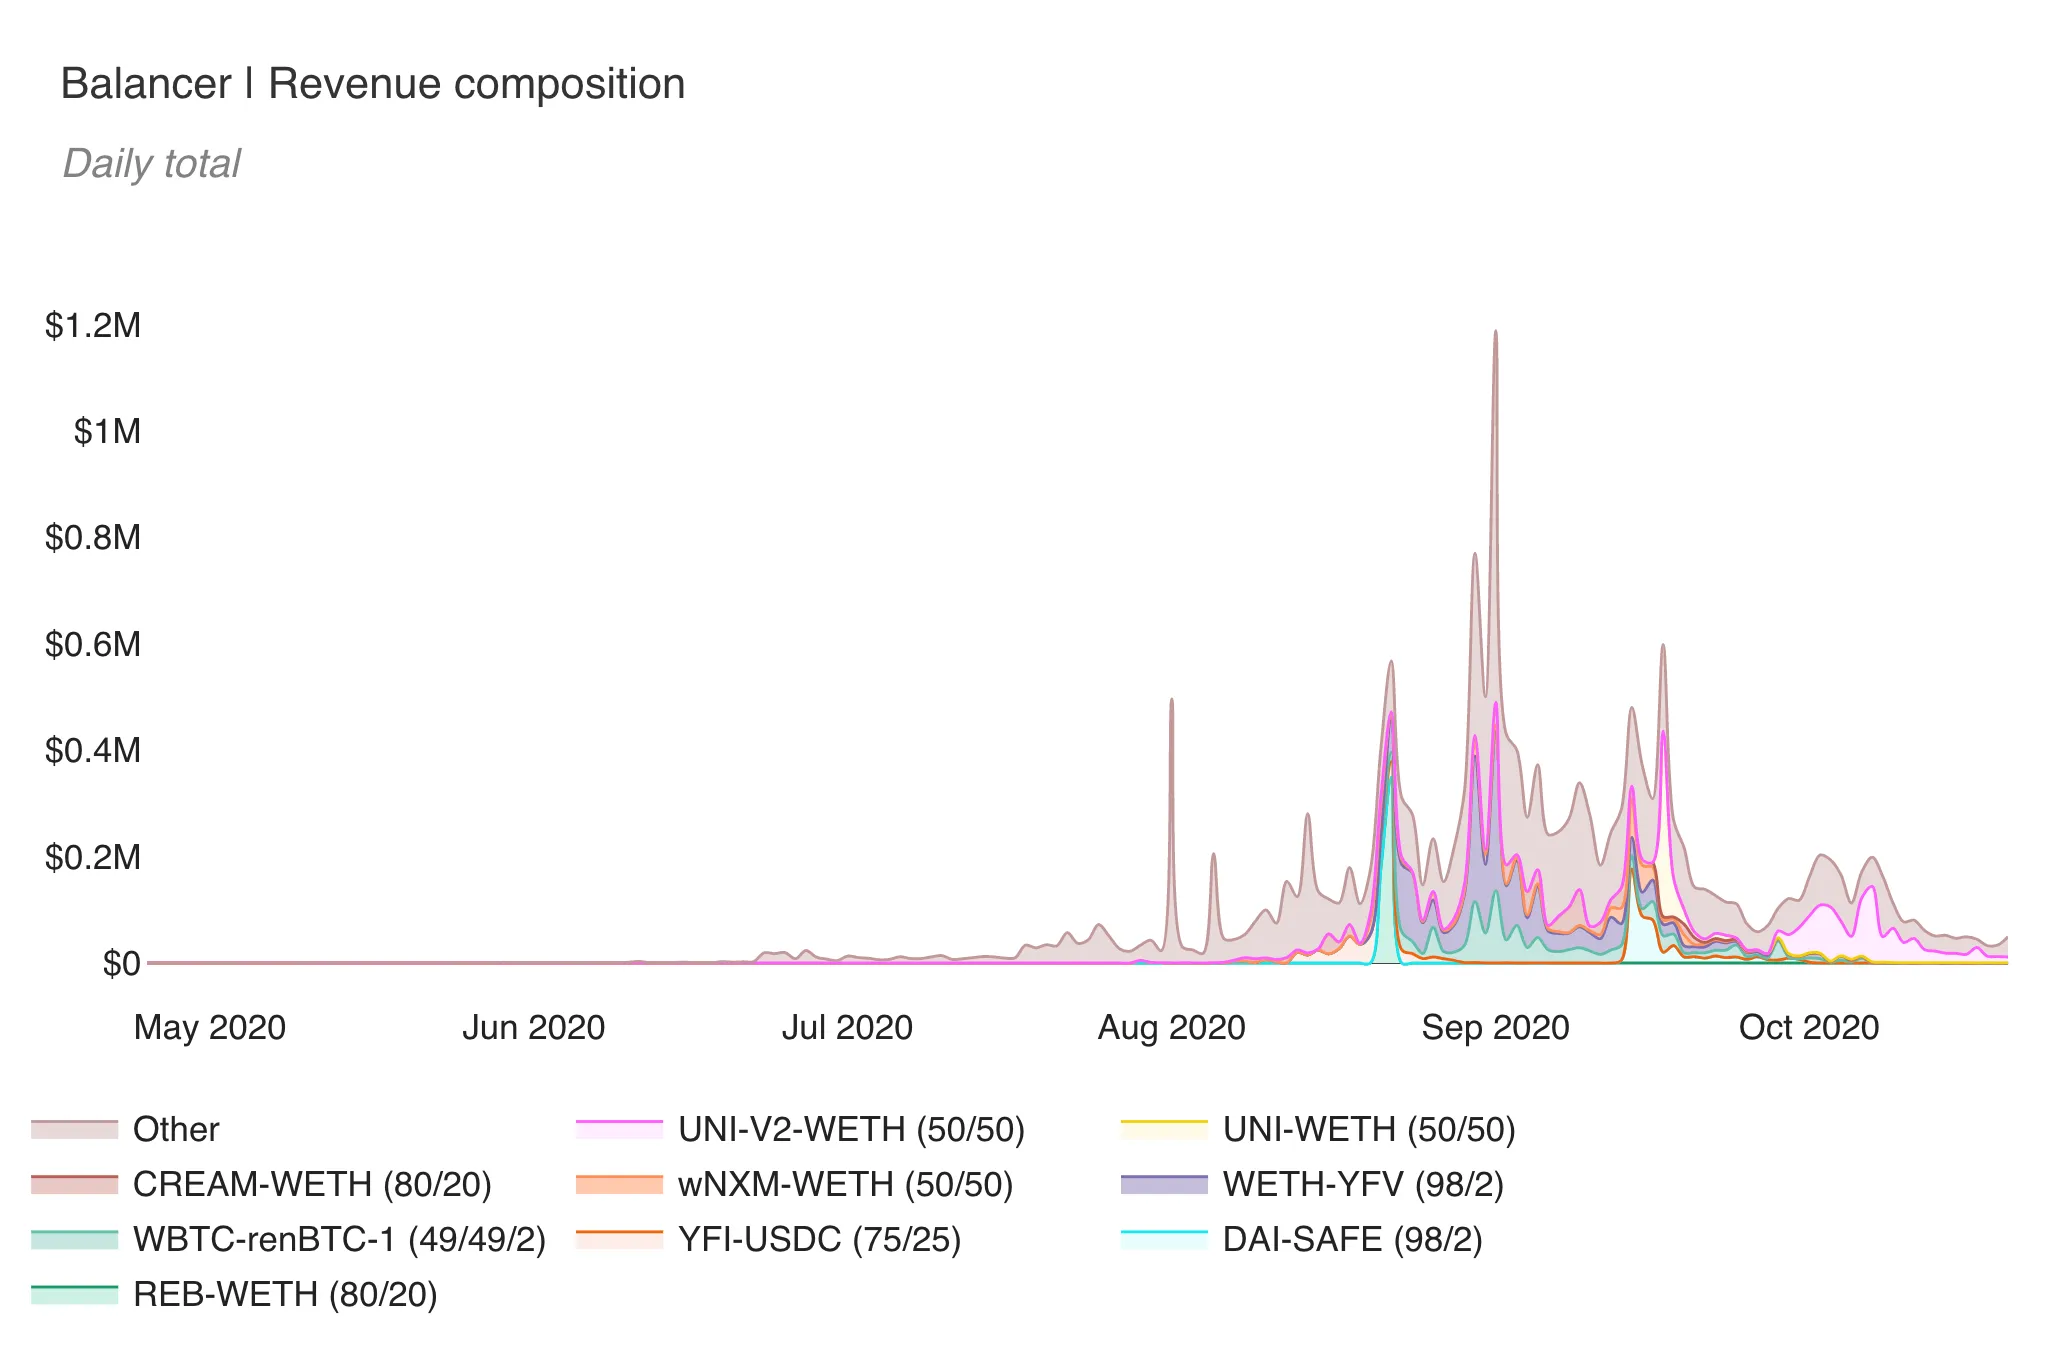
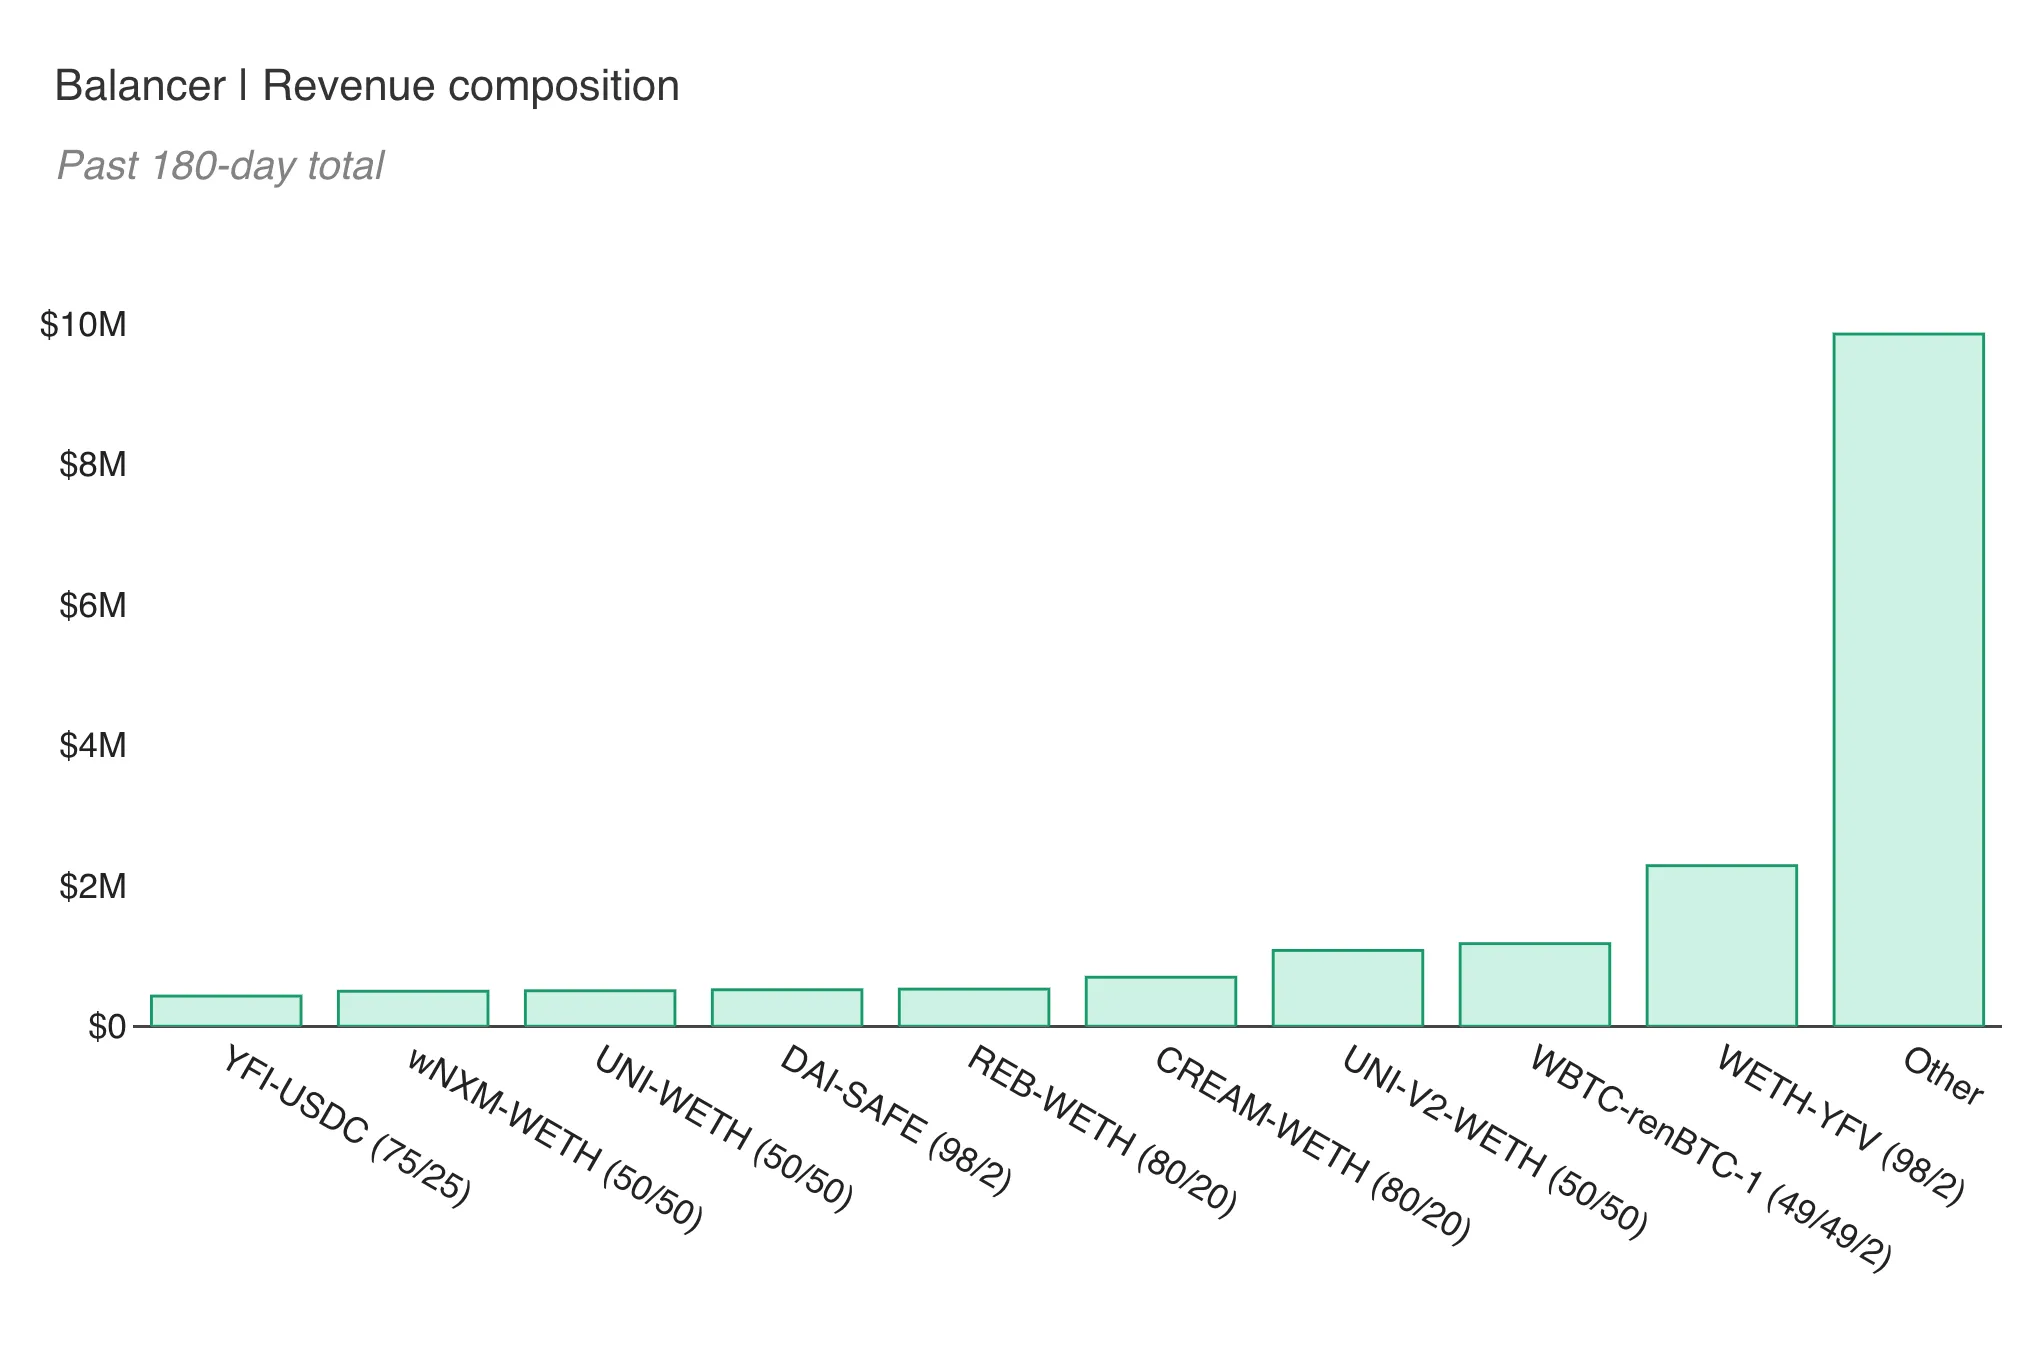
Revenue past 180 days:
- Past 180-day total revenue: $17,489,567
- 180-day compounded monthly growth rate (CMGR): +239.06%
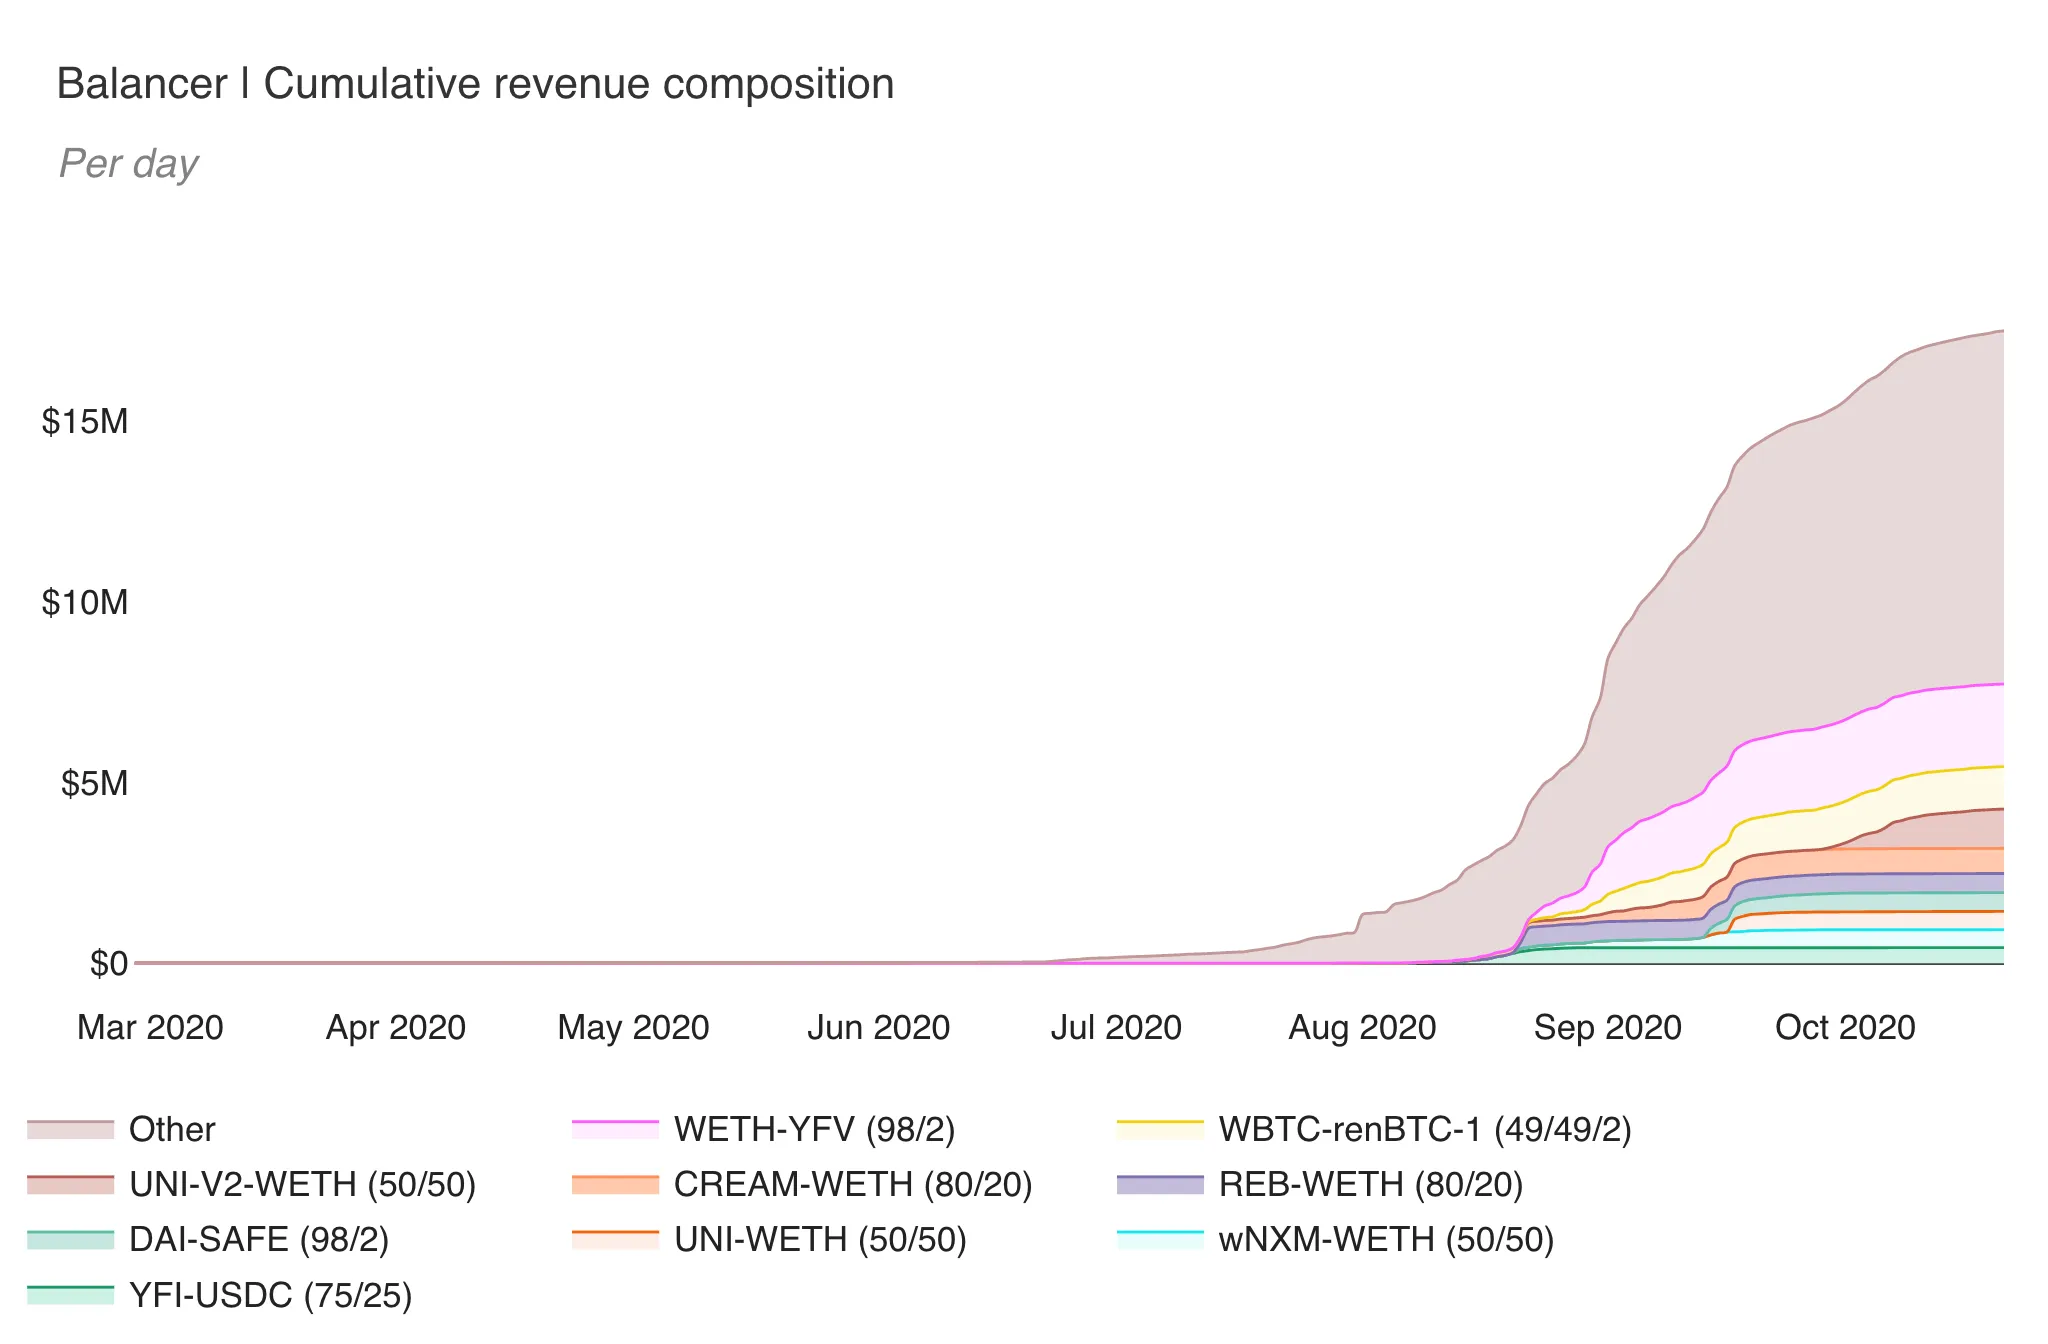
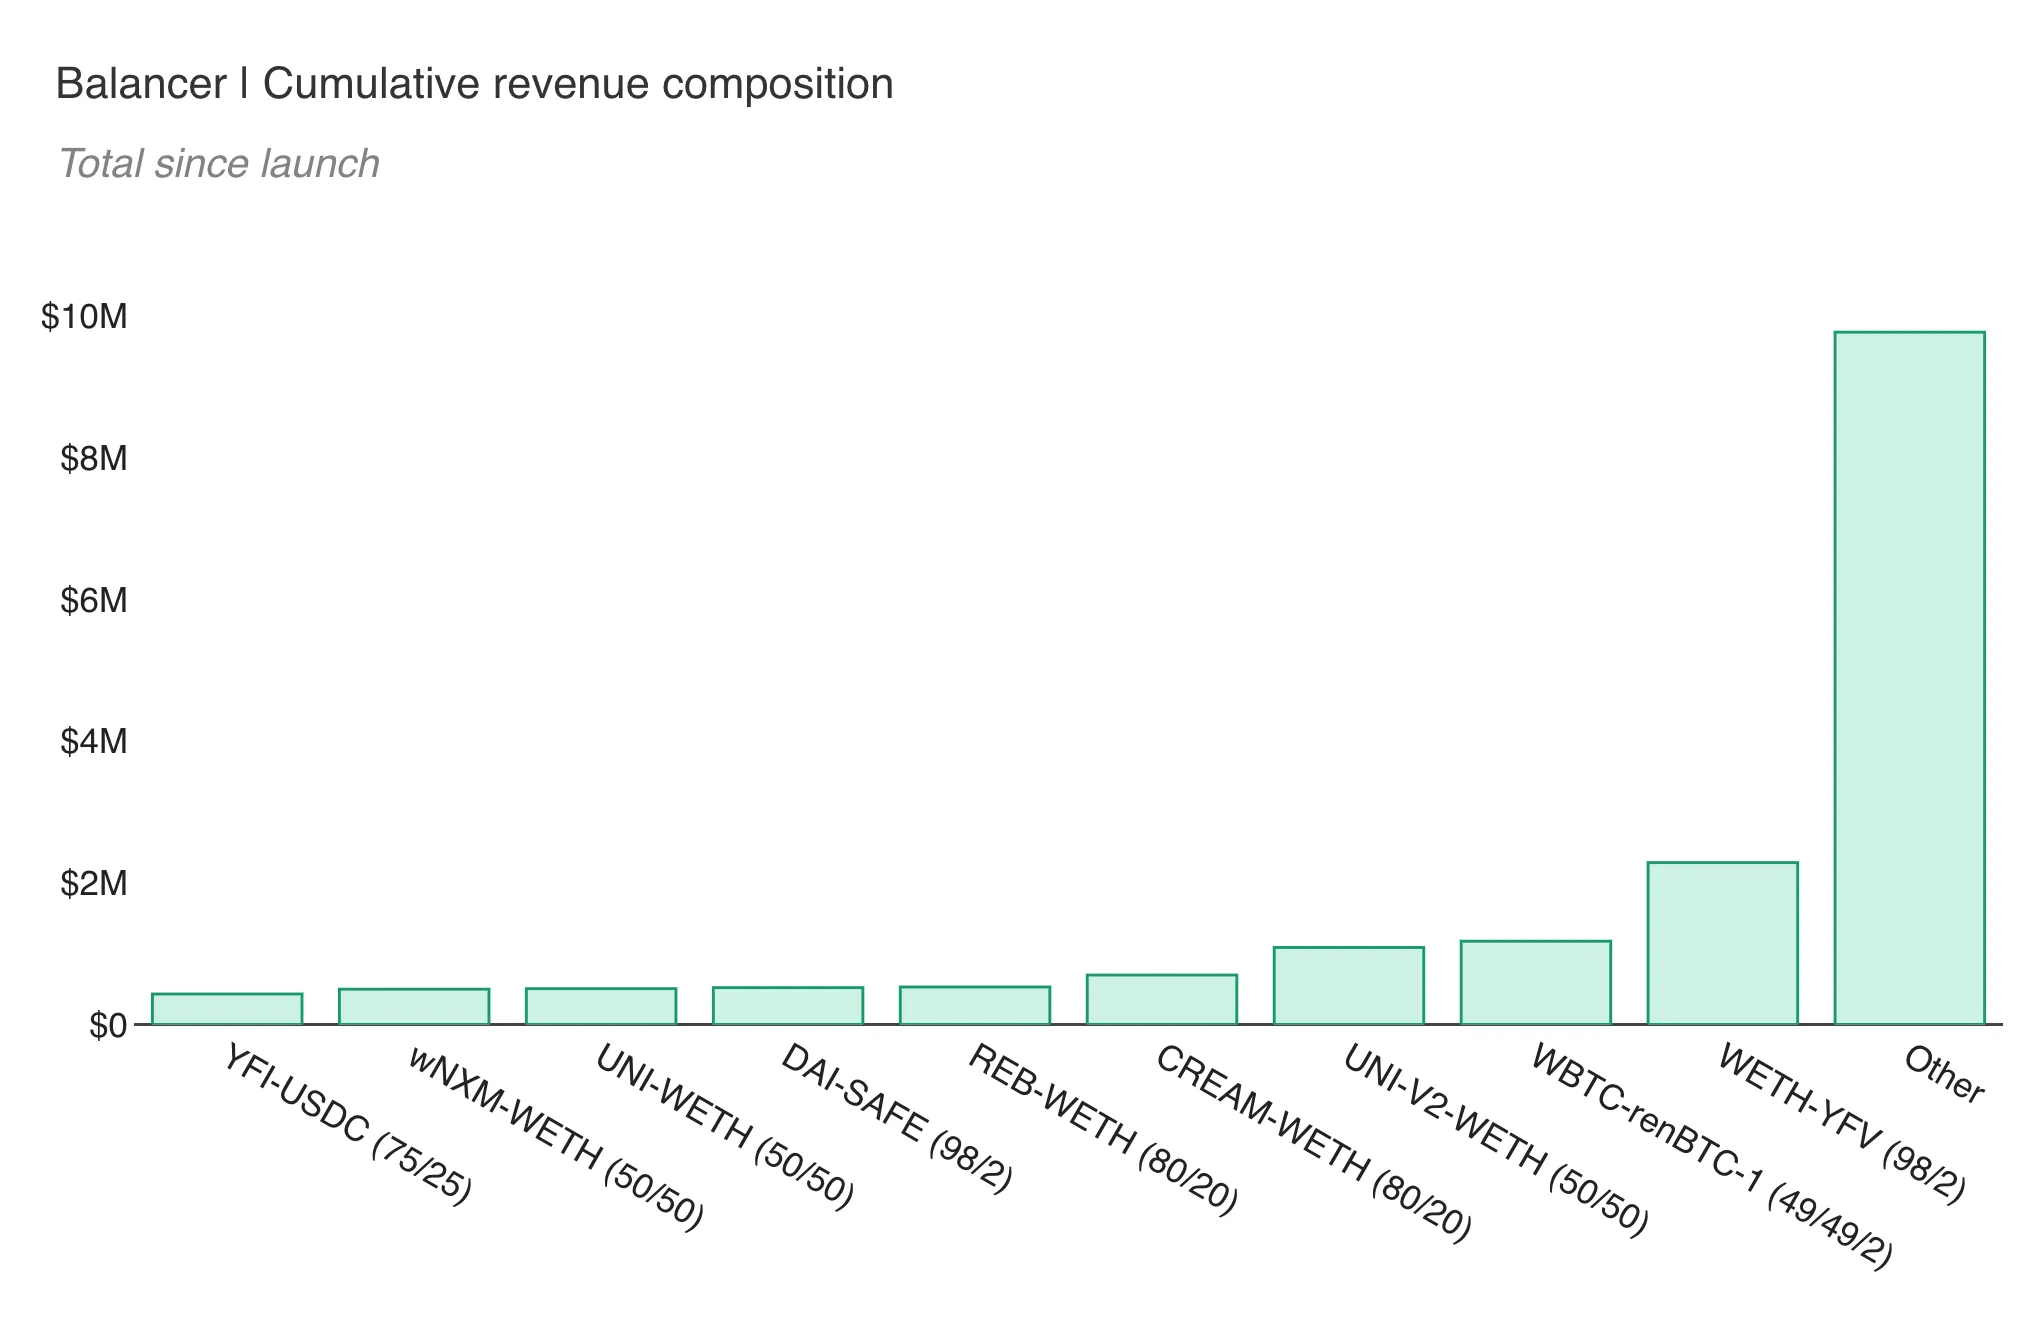
Cumulative revenue:
- Total revenue since launch: $17,496,771
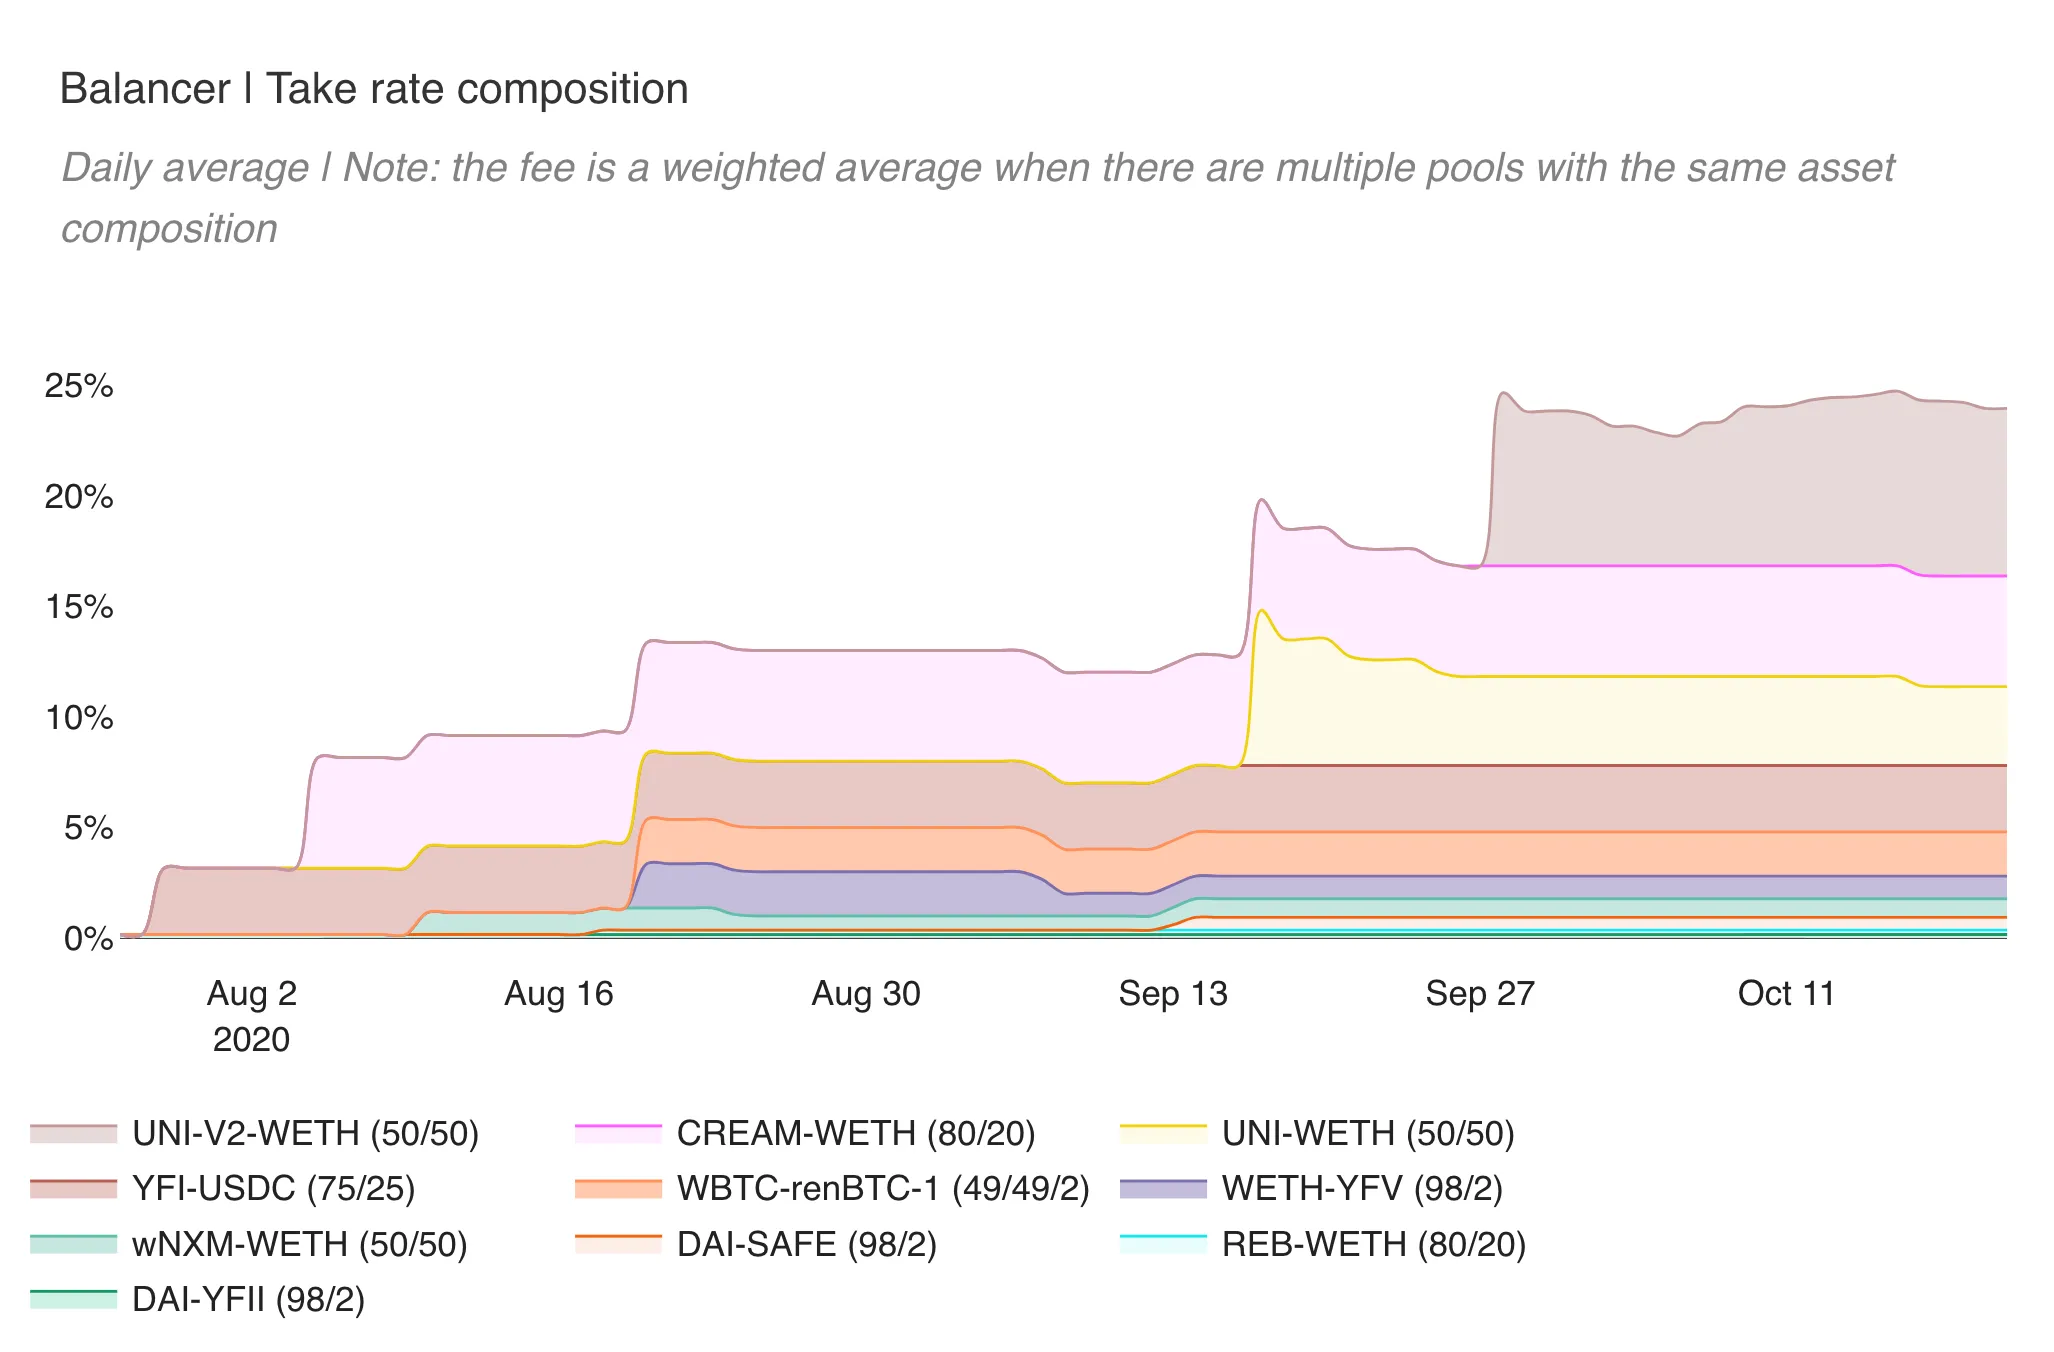
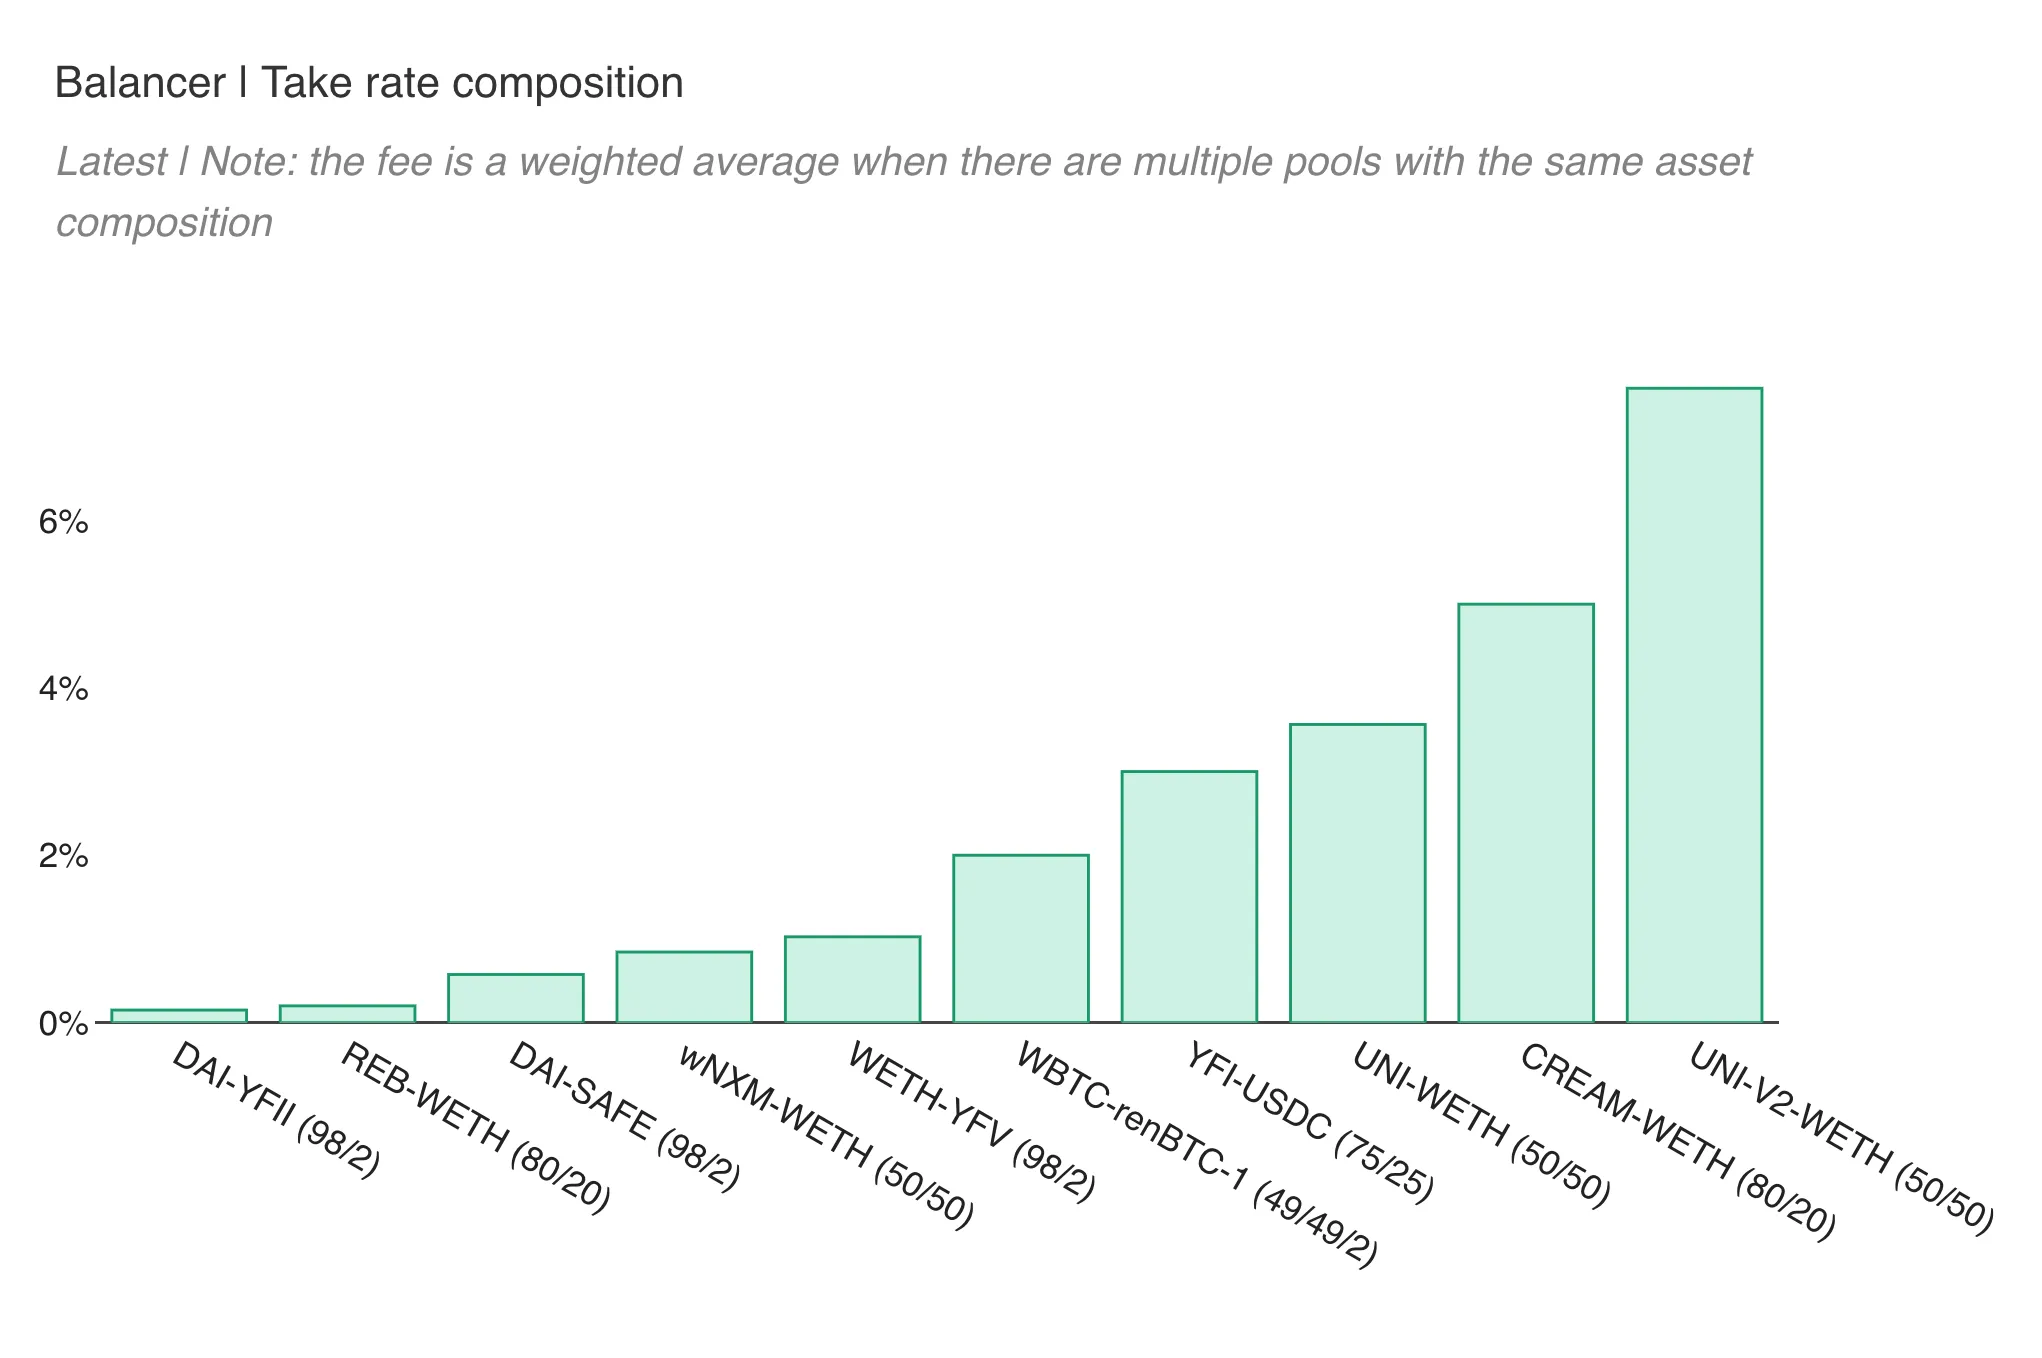
Take rate
What are the trading fees on Balancer?
Contribute to our Gitcoin grant here.
The authors of this content, or members, affiliates, or stakeholders of Token Terminal may be participating or are invested in protocols or tokens mentioned herein. The foregoing statement acts as a disclosure of potential conflicts of interest and is not a recommendation to purchase or invest in any token or participate in any protocol. Token Terminal does not recommend any particular course of action in relation to any token or protocol. The content herein is meant purely for educational and informational purposes only, and should not be relied upon as financial, investment, legal, tax or any other professional or other advice. None of the content and information herein is presented to induce or to attempt to induce any reader or other person to buy, sell or hold any token or participate in any protocol or enter into, or offer to enter into, any agreement for or with a view to buying or selling any token or participating in any protocol. Statements made herein (including statements of opinion, if any) are wholly generic and not tailored to take into account the personal needs and unique circumstances of any reader or any other person. Readers are strongly urged to exercise caution and have regard to their own personal needs and circumstances before making any decision to buy or sell any token or participate in any protocol. Observations and views expressed herein may be changed by Token Terminal at any time without notice. Token Terminal accepts no liability whatsoever for any losses or liabilities arising from the use of or reliance on any of this content.
Stay in the loop
Join our mailing list to get the latest insights!