Introducing Charts in Beta for Pro Subscribers

Studio Charts: Now in Beta
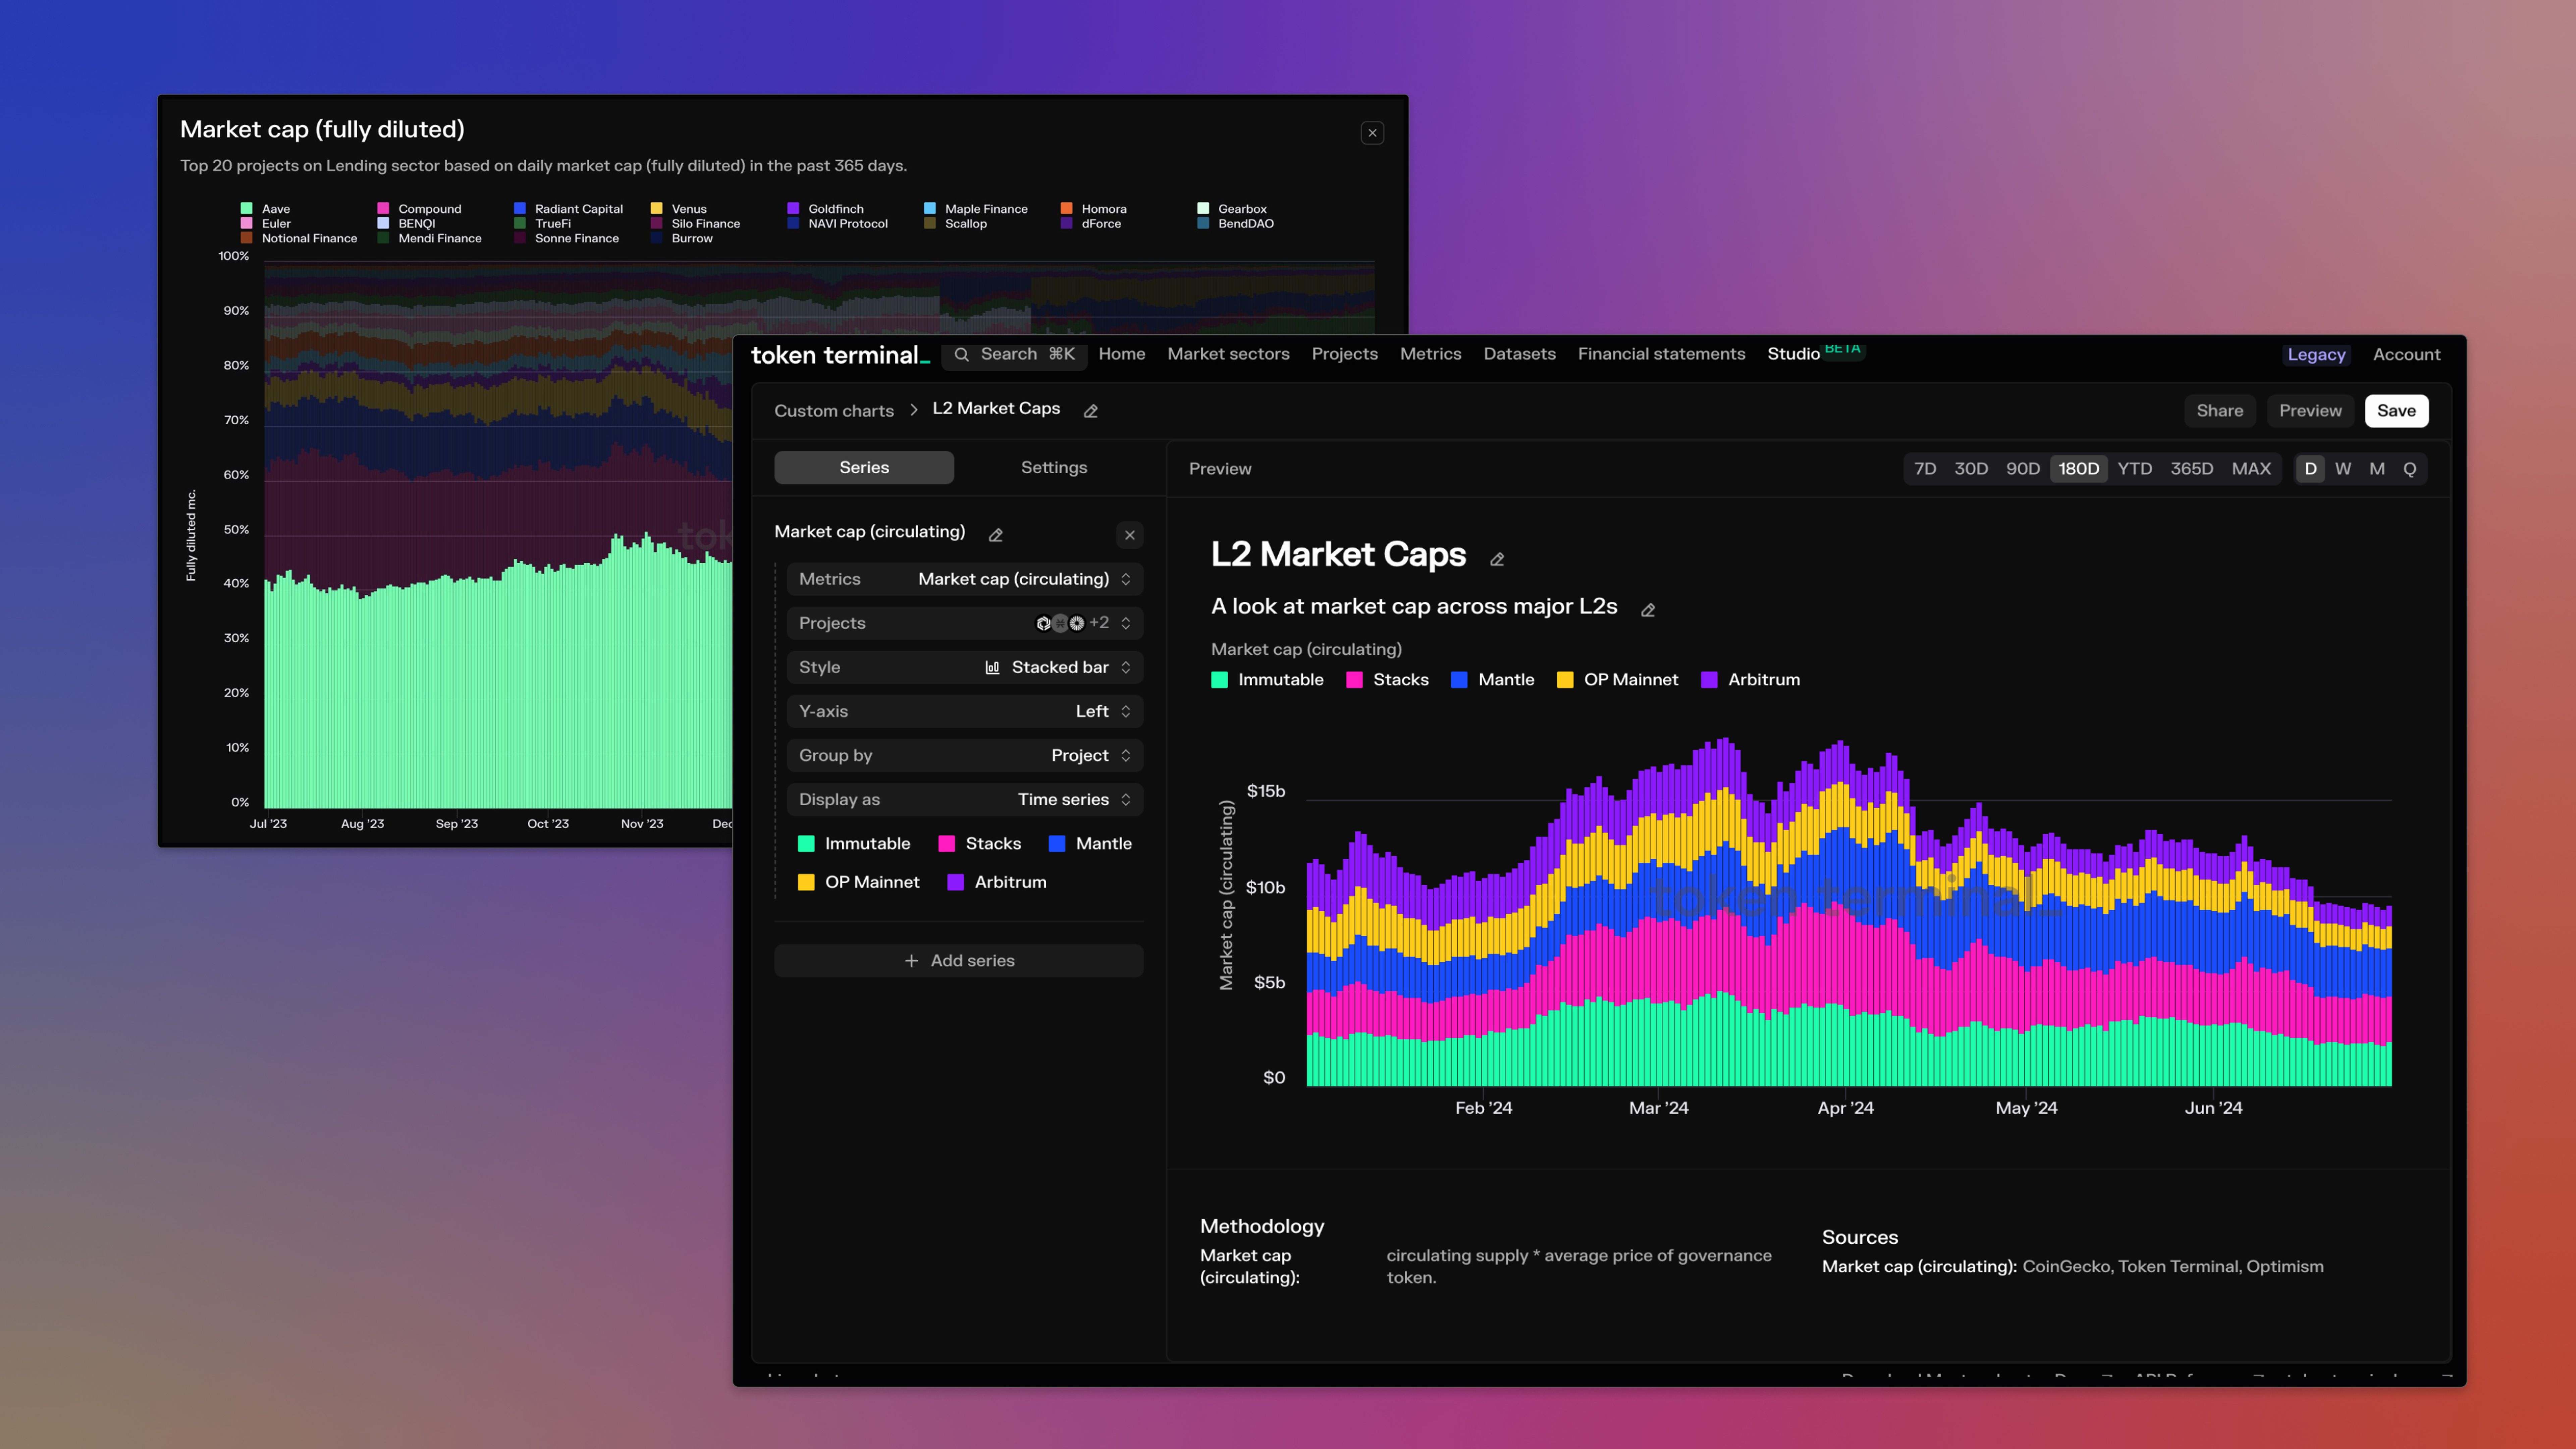
Today, we’re excited to announce the beta for a new way to analyze onchain data in Token Terminal: building your own custom charts in our new Studio.
At the core of exploring onchain data in Token Terminal is the humble chart. Showing one or two metrics at a time, these charts help you analyze standardized financial metrics by project and market sector. But, as we learned in our own research, as well as alongside customers, this can be limiting when you want to explore ideas across multiple projects, ecosystems, or even across different metrics.
Enter the new and improved chart building experience on Token Terminal. You can easily compare any number of projects with onchain data with multiple metrics all in the same chart. Charts can be created from scratch or from any existing charts in Token Terminal, allowing you to quickly create custom visualizations that help you analyze projects using our standardized, onchain data.
With the new chart, you can easily:
- 📈 Compare any metric across any or all projects listed on Token Terminal
- 📊 Compare up to 4 metrics in the same chart for any combination of projects
- ⛓️ Group projects by chain or aggregate each series for comparison
- 🧰 Leverage all types of data visualizations available on Token Terminal including line, bar, and area charts as well as stacked bar and stacked area charts
- 📅 See data as cumulative or in a time-series
- 👥 Share charts with anyone
- ⚡Easily create new charts from any charts in Token Terminal
The new charts experience is available in beta to all Pro customers. To get started, just log in and start exploring the new Studio page where you can create your first custom chart. And stay tuned for even more new customization features coming soon!
Data Updates
- Added support for non-ERC-20 tokens to our Top Tokenholders data set, unlocking tokenholder metrics across both BTC and ETH.
- Added tokenholder metrics to some additional ERC-20 based tokens: ONDO, AXS, and IMX.
- Added USDT on TON to our Stablecoin data set including data around outstanding supply, transfer volume, and other standard Stablecoin metrics.
- Extended our price feed for ETH historically to ensure the maximum coverage of historical price data.
- Added the outstanding supply of tokens for USDD, crvUSD, and FEI.
- Updated Solana transaction count to include all transactions, including unsuccessful ones in order to bring it inline with our standard transaction count definition.
- Updated all friend.tech metrics to include V2 contracts.
- Added active users (daily, weekly, monthly) for major stablecoin providers.
- Added market data for ZkSync Era including price, market capitalization, and circulating supply.
- Updated Uniswap to include transactions on zkSync Era.
- Added new custom metrics for Internet Computer: annualized estimated rewards, active internet identities, and total canister state.
- Added new Solana metrics including average transaction fee and transaction per second.
- Updated BNB Chain to take blob transactions into account for transaction based metrics.
- Added new metrics for Jito including daily active users, average fee per user, and average revenue per user.
- Added Ubeswap price feed data to ensure full historical price data for CELO.
Enhancements & Bug Fixes
- 💅 Added a stacked area chart for composition-based charts.
- 💅 Added byte-based scales for metrics using bytes.
- 🐛 Fixed a bug in the active user counts for Chainlink.
- 🐛 Fixed a bug in the trade counts for COW Protocol.
- 🐛 Fixed a bug with the scroll viewport on mini charts.
The authors of this content, or members, affiliates, or stakeholders of Token Terminal may be participating or are invested in protocols or tokens mentioned herein. The foregoing statement acts as a disclosure of potential conflicts of interest and is not a recommendation to purchase or invest in any token or participate in any protocol. Token Terminal does not recommend any particular course of action in relation to any token or protocol. The content herein is meant purely for educational and informational purposes only, and should not be relied upon as financial, investment, legal, tax or any other professional or other advice. None of the content and information herein is presented to induce or to attempt to induce any reader or other person to buy, sell or hold any token or participate in any protocol or enter into, or offer to enter into, any agreement for or with a view to buying or selling any token or participating in any protocol. Statements made herein (including statements of opinion, if any) are wholly generic and not tailored to take into account the personal needs and unique circumstances of any reader or any other person. Readers are strongly urged to exercise caution and have regard to their own personal needs and circumstances before making any decision to buy or sell any token or participate in any protocol. Observations and views expressed herein may be changed by Token Terminal at any time without notice. Token Terminal accepts no liability whatsoever for any losses or liabilities arising from the use of or reliance on any of this content.
Stay in the loop
Join our mailing list to get the latest insights!
Continue reading

Customer stories: Token Terminal’s Data Partnership with Linea
Through its partnership with Token Terminal, Linea turns transparency into a competitive advantage and continues to build trust with its growing community.

Introducing Tokenized Assets
Token Terminal is expanding its standardized onchain analytics to cover the rapidly growing category of tokenized real-world assets (RWAs) – starting with stablecoins, tokenized funds, and tokenized stocks.

Customer stories: Token Terminal’s Data Partnership with EigenCloud
Through its partnership with Token Terminal, EigenCloud turns transparency into a competitive advantage and continues to build trust with its growing community.